-53-
Peer Evaluation of Team Member Effectiveness as a
Formative Educational Intervention
Nathan Mentzer
,
Dawn Laux
,
Angelika Zissimopoulos
,
and K. Andrew R. Richards
Abstract
Peer evaluation of team member effectiveness is often used to complement cooperative learning in the classroom by holding students accountable for their team contributions. Drawing on the tenants of self-determination theory, this study investigated the impact of formative peer evaluation in university level team-based design projects. The hypothesis was that the introduction of formative peer evaluation cycles would result in a more student-centered learning climate, increased competence, reduced doubt, and improved student learning. Two semesters were compared in this quasi-experimental study in which results of peer evaluation became modifiers to students’ grades in the final project. In the second semester, peer evaluation was also used multiple times formatively to provide students with feedback and encourage changes in behavior without impacting grades. When formative peer evaluation was implemented, students earned higher grades on the final project and in the course and perceived a more student-centered learning environment, more competence, and less doubt about the course.
Keywords: learning climate; peer evaluation; self-determination theory; team member effectiveness
To be a successful member of the modern workforce, an effective employee must anticipate change and adapt quickly, be able to apply critical thinking skills, collaborate professionally with others, and self-monitor performance in teams (National Research Council, 2011). Active learning techniques that encourage student engagement in the learning process, such as cooperative learning, provide opportunities for students to develop critical thinking skills, engage in collaboration, and evaluate team effectiveness. This study investigated the impact of evaluating and communicating team member effectiveness as an ongoing, iterative feedback mechanism (formative evaluation) on university freshman student performance and perceptions in a technological design course at a major U.S. research institution.
-54-
by each individual member (Johnson, Johnson, & Smith, 1998; Prince, 2004; Smith et al., 2005). Johnson, Johnson, and Smith (1998) also noted that cooperative learning (as opposed to working alone) improves the quality of student relationships (effect size = 0.55). Johnson et al. reported that this finding is consistent across ethnic, cultural, language, social class, ability, and gender groups by measuring internal attraction, esprit de corps, cohesiveness, and trust. Finally, evidence indicates that the psychological adjustment to college life positively correlates with cooperative learning (Smith et al., 2005). Self-esteem has also been found to increase with the use of cooperative learning (Prince, 2004). Millis (2010) suggested that group work can encourage critical thinking while inspiring students to value the contributions of others.
Free-Rider Problems in Collaborative Learning
Challenges have been noted regarding cooperative learning. Notably, one concern for students is how to adequately evaluate participation among team members (Topping, 2009). In research pertaining to attitudes toward social loafing (Jassawalla, Sashittal, & Malshe, 2009), students perceived that nonparticipating team members submit poor quality work and negatively contribute with distractive and disruptive behaviors. Jassawalla, Sashittal, and Malshe’s (2009) data showed that student apathy and disconnectedness were precursors to the behavior, causing more work for the other team members.
-55-
Timeliness of Peer Evaluations
In a comparison-of-methods study, Baker (2008) discussed peer evaluation methodology and described the difference between formative and summative peer evaluation. When using peer evaluations for formative purposes, evaluation occurs during the project, and results are provided to students prior to the project ending so that students are given the opportunity to improve team skills before the conclusion of the group activity (Cestone, Levine, & Lane, 2008).
Summative peer evaluation is typically administered at the end of a team project, and members of the team evaluate the individual performance based on a predetermined set of requirements (Elliott & Higgins, 2005; Goldfinch & Raeside, 1990; Holland & Feigenbaum, 1998). Because summative peer evaluation takes place at the end of the project, individuals do not have the opportunity to take corrective action as they might with formative evaluation (Baker, 2008; Brooks & Ammons, 2003; Reese-Durham, 2005). In a study on the perceptions of social loafing, Jassawalla et al. (2009) discovered that some of the students who received a summative peer evaluation were unaware, until the end of the team activity, that their participation was perceived as lacking. These self-reports may be biased as students claim to be unaware that they were not meeting teammate’s expectations when in fact this is a defense mechanism (Oakley, 2002). However, assuming some students were unaware, Jassawalla et al. (2009) suggested that instruction on teamwork skills could alleviate this issue. Based on the developmental peer evaluation research, this level of disconnectedness within the team could possibly be alleviated with peer feedback during the activity rather than after the activity is over. A formative evaluation earlier in the team project may be the needed motivation to participate (Baker, 2008).
Understanding Human Motivation
Self-determination theory (Deci & Ryan, 1985, 2000) provides a framework to explain how human motivation influences behavior. Central to
self-determination theory is the notion that humans have three basic psychological needs that they seek to satisfy through their interactions with one another and the environment: relatedness, autonomy, and competence (Deci & Ryan, 1985).
-56-
Self-determination theory has been applied in educational settings to explain student motivation that results from different types of learning environments (e.g., Black & Deci, 2000; Levesque-Bristol, Knapp, & Fisher, 2010). When these interactions foster student-centered learning environments, students’ basic psychological needs will be satisfied and they will be more intrinsically motivated to learn. In contrast, when learning environments are perceived to be controlling and instructor-centered, the basic psychological needs are less likely to be satisfied, and motivation is extrinsically regulated (Deci, Ryan, & Williams, 1996). When students are extrinsically motivated they feel as if they are engaging in learning activities in order to achieve a reward (e.g., a good grade) or avoid a punishment (e.g., a failing grade) and are less likely to feel personally invested in the coursework. Related to
self-determination theory, active learning strategies such as cooperative learning can help to create student-centered learning environments, which satisfy the basic psychological needs and lead to more positive perceptions of the learning environment and better student-level outcomes.
Purpose of Study
The purpose of this study was to investigate the impact of using peer evaluation as a formative learning tool. It was hypothesized that peer evaluation might also have the potential to improve student performance if used as a formative tool during early stages of the final project in addition to its use as a summative tool at the conclusion. The underlying assumption here was that not all teams are fully functional. The hypothesis driving this inquiry was that peer evaluation used as formative feedback on a long-term final project will improve student performance, improve students’ perceptions of the learning climate, increase perceived competence, and reduce perceived doubt over a comparison group using cooperative learning with only summative feedback. This
hypothesis builds on the work of Brooks and Ammons (2003) who suggested that multiple peer feedback evaluation points reduce the occurrence of free-riding when used after each separate learning module. Although Brooks and Ammons (2003) administered multiple peer evaluation points, each was summative, and the main focus of their study was on alleviating free-riding on subsequent learning modules rather than the effects of formative peer evaluation on student performance during an extended project.
Research Questions
Two research questions guided the investigation. Multiple data sets and analysis strategies were required to address each question and are discussed separately. The research questions were:
-57-
2. Does formative peer evaluation improve students’ perceptions of the learning climate, increase competence, and reduce doubt over summative only peer feedback?
Methods
Data for this quasi-experimental study were drawn from students enrolled in a university freshman level design thinking course in the fall 2012 and fall 2013 semesters. In both semesters, peer evaluation was used as a summative tool to impact student grades based on the degree to which their teammates perceived that they contributed to the final project. The use of formative peer evaluation was piloted during spring 2013 and implemented in fall 2013. Therefore, data from fall 2013 included both formative and summative peer evaluation ratings, whereas data from fall 2012 only included summative peer evaluation. The Institutional Review Board approved this study as exempt because it involved typical educational procedures. All data were made anonymous and analyses were not conducted until after the conclusion of the fall 2013 semester.
Learning Environment
The course chosen for the study was a college core course focused on design thinking in a major research university. Most students were freshmen or transfers (mainly from other colleges at the university). This user-centered design course was initially implemented in the 2011–2012 academic year as the first course in a three-course sequence required for all undergraduate students in the college. Faculty members implementing the course participated in course redesign workshops the year before this study was implemented. Faculty members worked with pedagogical, technological, and information literacy experts to redesign the course from a traditional, large lecture format to a flipped model in which a blend of distance and face-to-face modalities were
implemented. Changes were made in learning outcomes, pedagogy, and content using research-backed strategies for sound student-centered teaching and learning. Changes made and described here as part of a course redesign were completed prior to the implementation of this study.
During the semesters in which this research study was conducted, students spent substantial time engaged in small-group learning experiences and team-based projects. Sections of the course were limited to 40 students each and situated in a technology-enabled classroom in which each student had a computer. Students were arranged in pods ranging from 4–6 students, and each pod had the ability to project on a large screen with a data projector. White boards and cameras were accessible for group work and documentation.
-58-
constant during the study with the only change being the treatment, which was the addition of formative feedback during the fall 2013 semester.
The following learning outcomes for the course were developed and approved. Students will be able to:
1. Write a narrowly focused problem statement.
2. Apply ethnographic methods to understand technological problems. 3. Develop a search strategy, access technical databases, and evaluate
results and source quality.
4. Create a technical report documenting results of the design process. 5. Manage design projects, develop project timelines, and negotiate
individual responsibilities and accountability in the team environment. 6. Apply strategies of ideation to develop novel and innovative solutions. 7. Rapidly prototype solutions for purposes of design, testing, and
communication.
Learning experiences based on these outcomes were developed and thematically linked to the domain of technology through the lens of design. Students began the semester generally working individually outside of class and in pairs or small groups in class. As the semester progressed, students gradually transitioned to working outside of class in small groups and working in small and large groups in class. Students typically completed two assignments per week. One assignment was given prior to each class session to engage students in content and prepare them for class, and one assignment was given in class.
Assignments were based on course materials and included readings, videos, field work, and student creation of artifacts. As an example, students would read about design thinking, watch a video on ethnography in the context of a design problem, conduct and document observations, and synthesize results based on their data collection leading to defining a problem. An example assignment would include developing constraints and criteria, refining them to be
measurable, and identifying solutions for potential development. Students have online access to procedures and rubrics used to grade their submissions. Submissions were graded quickly (in less than 1 week) and returned to the students with feedback and explanation of missed points so that students could improve their approach to coursework.
-59-
of the refined conceptual design. Prototypes at the conclusion of the course demonstrated a proof of concept but were not ready for implementation. Final project topics had loose boundaries so that students from various disciplines in the college had the autonomy to focus on a common area of interest, which may or may not have been directly central to their major (although the connection was encouraged). In both the fall 2012 and fall 2013 semesters, final projects were done in teams ranging from 2–6 students with the typical group being 4–5 students, which is consistent with research on cooperative learning (Slavin, 1991). Final project teams were created at the beginning of the project (around midterm of the semester). Student teams were self-selected, and each team negotiated the definition of their team’s problem statement.
Treatment Method
Various methods of approaching peer evaluation have been developed and published including paper- and computer-based surveys. A web-based survey called the Comprehensive Assessment for Team-Member Effectiveness (CATME), which is available for a nominal fee to educational institutions, was used in this study (for more information about CATME, see www.CATME.org). CATME was selected because it has been determined to be reliable and valid (Loughry, Ohland, & Moore, 2007; Ohland et al., 2012), which is essential when the results will be factored into student grades (Baker, 2008). The CATME instrument is a behaviorally anchored rating scale that describes behaviors typical of various levels of performance. Raters select the category of behaviors that most closely matches the actual behavior of each student (including themselves) on their team (Ohland et al., 2012). Five scales of teamwork are included in this survey: Contributing to the Team’s Work, Interacting with Teammates, Keeping the Team on Track, Expecting Quality, and Having Relevant Knowledge Skills and Abilities. The CATME interface asks students to rate themselves and their peers by selecting one of five behavioral
descriptions per metric selected by the instructor. For Interacting with Teammates, for example, which best describes your peer: “asks for and shows an interest in teammates’ ideas and contributions,” “respects and responds to feedback from teammates,” or “interrupts, ignores, bosses, or makes fun of teammates?” (Ohland et al., 2005). (Please note that the descriptions are greatly abbreviated here; please see the survey for more detailed descriptions.) The instrument quantifies these behavioral ratings such that high-quality interactions receive a 5, average interactions receive a 3, and poor interactions receive a 1. After students were surveyed, the instructor released results back to the students. Results included the student’s self-rating compared to how their peers rated them and the average of their team for each metric.
In both comparison and treatment semesters, peer evaluations were
-60-
summative because of the timing. The process of administering the survey and receiving feedback spanned at least 2 weeks and overlapped the next project component. Therefore, students did not have a chance to learn from the evaluation results prior to the next evaluation period. In the treatment semester, the evaluation process was rescheduled such that cycles of work, peer
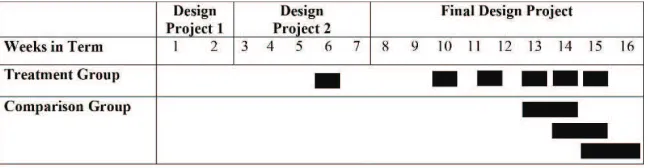
evaluation, and feedback occurred more rapidly. This rapid succession resulted in students having the ability to receive feedback prior to engaging in the next main deliverable, and the evaluation experience was more formative in nature. During the treatment semester, peer evaluation was also implemented an additional two times during early stages of the final project. These two additional formative evaluations were spaced apart so that students had an opportunity to review results and discuss them in class prior to the next iteration. As a result, students in the comparison semester experienced predominately summative evaluation, whereas students in the treatment semester experienced five cycles of formative evaluation.
Figure 1. Peer evaluation schedule for comparison and treatment groups by weeks in the term and design project. The schedule is approximate and represents the time cycles from survey administration to release.
-61- Participants
There were 193 students enrolled in the course in the fall 2012 semester and 140 enrolled in the fall 2013 semester. However, data were incomplete for 13 students in the fall 2012 semester (6.74%) and 19 students in the fall 2013 semester (13.57%). Given that the incomplete data made it impossible to complete the analyses, these cases were omitted from the study. The final sample included 301 students (180 from fall 2012 and 121 from fall 2013).
To answer research question one, data were drawn from all 301 students (259 males and 42 females) from a single instructor’s sections of the course. The average student was 20.63 years old (SD = 3.52). Most of the students were White (n = 218, 72.4%) and were born in the United States (n = 283, 94%). Over three-quarters of the students were freshmen (n = 241, 80.1%) with only a few sophomores (n = 39, 13%), juniors (n = 12, 4%), and seniors (n= 9, 3%). The average student had a combined SAT math and verbal (SAT composite) score of 1119.97 (SD = 130.59, approximately 69th percentile) and an SAT writing score of 522.56 (SD = 73.26, approximately 57th percentile).1
Data to answer research question two were drawn from a subset of 80 students (64 males, 16 females) who completed a voluntary course perceptions survey at the end of each semester. There were 22 students (12.22%) in fall 2012 and 58 students (47.93%) in fall 2013. The average student was 21.03 years old (SD = 4.86). Most of the students were White (n = 65, 81.3%) and were born in the United States (n = 75, 93.8%). Three-quarters of the participants were freshmen (n = 60, 75%) with a few sophomores (n = 11, 13.8%), juniors (n = 3, 3.8%), and seniors (n = 6, 7.5%). The average student had a SAT composite score of 1096.87 (SD = 132.83, approximately 66th percentile) and an SAT writing score of 513.13 (SD = 74.35, approximately 54th percentile).
Data Collection
Demographic data. The quasi-experimental research design assumes that both groups began the semester being similar and that the instructor manipulated only the reported variable. Demographic data were gathered from the university database to permit comparisons between students in both semesters.
Demographic data included SAT scores, class rank, gender, and racial or ethnic identity. Students entering the university are required to either take the SAT or the ACT college entrance exams. To standardize comparisons, ACT exam scores were converted to SAT comparable scores using the College Board Concordance Tables (The College Board, 2009).
Student performance data. Evidence of student learning data were collected in two forms: overall course grades and grades in components of the final project. Course grades were composed of a series of assignments, typically two per week, in which rubrics were used to evaluate authentic application
-62-
experiences. Students had access to the rubrics in advance. Assignments included individual and small-group work outside of class and in class.
The final project included three main components: a planning document, a written technical document, and a video. Each component was submitted separately with at least 1week between submissions. The planning document included a Gantt chart, evidence of a finalized prototype, a storyboard, and a draft technical document. The video was limited to 60 seconds in length and was expected to communicate the problem, the existing but inadequate solutions, and the proposed solution and to demonstrate the proposed solution in action. The instructor and a teaching assistant used a rubric to rate each of these three main final project components. Prior to analysis, it was discovered that an error in the fall 2012 video rubric caused artificial final project grade inflation on this component (the impact of this error on the semester grade may account for less than 1% of the overall course grade based on point values for some students in the fall 2012 semester only). As a result, the video component of the final project was not considered in the analysis. In the final project, individual scores for each student were derived as a function of the group score and the individual student’s effectiveness as a team member. The group score was determined by rubrics used to measure the quality of the submitted product. The individual score was the result of the group score multiplied by an individual effectiveness indicator extracted from CATME. The team effectiveness value ranged from approximately 0.20–1.05. This process was conducted to calculate individual student grades for the two components of the final project included in this study (the final project planning component and the final project technical document component).
Overall course grade was determined by a series of existing assignments. Prior to the start of the fall 2012 semester, assignments, instructions, and rubrics were generated collaboratively by a group of four faculty members under the guidance of two course-design experts from the university’s center for teaching and learning. The use of instructor-generated assignments as a measure of student learning is consistent with previous studies (Fraenkel & Wallen, 2009; Gay, Mills, & Airasian, 2009). During both semesters of this study, the
-63-
Student perception data. An online survey was administered at the end of each semester to measure students’ perceptions of the learning environment. This survey included measures of the learning climate, competence, and doubt
(refer to the Appendix for the instrument). The survey was administered by the university’s center for teaching and learning during both semesters of this study. Fall 2012 was the first semester that this survey was used on campus and the instructors, campus wide, were not well informed. As a result, instructors typically did not encourage students to participate, which explains the low response rate during that semester.
Students’ perceptions of the learning climate were measured using the Learning Climate Questionnaire (Williams & Deci, 1996). This instrument measures students’ perceptions of the “autonomy supportiveness” of the learning environment. High scores reflect a more student-centered learning climate, whereas lower scores reflect a more instructor-centered environment. Participants responded to the seven questions on a 7-point, Likert-type scale ranging from strongly disagree (1) to strongly agree (7). Example items included: “my instructor provided me with choices and options on how to complete the work,” “my instructor understood my perspective,” and “my instructor encouraged me to ask questions.” Validity and internal consistency for the instrument have been established through prior research (Levesque-Bristol et al., 2010; Williams & Deci, 1996), and internal consistency was excellent in the
current study (Cronbach’s α = .93).
Perceptions of competence and doubt were measured using the competence subscale of the Basic Psychological Needs at Work Scale (Deci & Ryan, 2000), which was modified to reflect a classroom situation (Levesque-Bristol et al., 2010). The subscale contains three positively worded items and three negatively worded items. Participants responded to the six questions on a 7-point, Likert-type scale ranging from strongly disagree (1) to strongly agree (7). Example items included: “When I was in this course, I often did not feel very capable,” and “I was capable of learning the materials in this course.” In the current study, an exploratory factor analysis using maximum likelihood extraction and a varimax rotation (orthogonal) indicated that the six items were better represented as two subscales, each of which contained three items. The first subscale included the positively worded items related to competence. The second subscale included the negatively worded items and was taken to reflect doubt in one’s abilities to meet the demands of the course environment. Validity and internal consistency for the Basic Psychological Needs at Work Scale has been documented through prior research (Deci & Ryan, 2000; Levesque-Bristol et al., 2010), and was adequate for both competence and doubt in the current
-64- Data Analysis
Data were first screened as recommended by Tabachnick and Fidell (2007), and it was determined that the data met the basic requirements for inferential statistics (scores on the dependent variable approximate an interval level of measurement, scores on the dependent variable are normally distributed, observations are independent, and homogeneity of variance).
Prior to conducting analyses to answer the research questions, the researchers performed two separate manipulation checks. The first examined differences in demographic and performance variables between the students who were enrolled in the course in fall 2012 and those who were enrolled in fall 2013. The second examined differences in demographic and performance variables for student survey responders and nonresponders in each semester
separately. Pearson χ2 tests were used to determine if student groups differed in
terms of gender (male or female), class rank (freshman, sophomore, junior, or senior), ethnicity (White or other), and nationality (international or domestic student). Independent samples t-tests were used to examine if students differed in terms of SAT composite (math + verbal) and writing scores. SAT data were used because most students were first-semester college freshmen, and college-level measures of performance (e.g., overall GPA) were not available.
The first research question was: Does formative peer evaluation improve student learning, as measured by final project grade and course grade, over summative only peer feedback? For question one, three analyses were
conducted. Course grades were compared between semesters as well as between two of the main components of the cooperative learning-based final project. Analysis of Covariance (ANCOVA) procedures were used to examine differences in student performance on the three components (the final project planning component, the final project technical document component, and course grade) between the fall 2012 and fall 2013 semesters while controlling for SAT composite and SAT writing scores.
The second research question was: Does formative peer evaluation improve students’ perceptions of the learning climate, increase competence, and reduce doubt over summative only peer feedback? To address question two, composite scores were created by averaging the items related to each of the three constructs (learning climate, competence, and doubt) included in the study. Analysis of Covariance (ANCOVA) procedures were used to examine differences in student perceptions of the learning climate, competence, and doubt in the fall 2012 and fall 2013 semesters while controlling for SAT composite and SAT writing scores.
For all of the ANCOVA procedures, η2 is presented as a measure of effect
size. A η2 value between .01 and .06 is associated with a small effect, between
-65-
a small effect, between .40 and .75 with a medium effect, and above .75 with a large effect (Cohen, 1992).
Results
Pre-analysis Manipulation Checks: Comparison of Demographic and Performance Variables
Prior to conducting analyses to answer the research questions, two pre-analysis manipulation checks were performed to examine differences related to student demographic and prior performance data. The first check sought to examine if there were differences between students enrolled in the class in the
fall 2012 and fall 2013 semesters. Pearson χ2 tests were used for the categorical
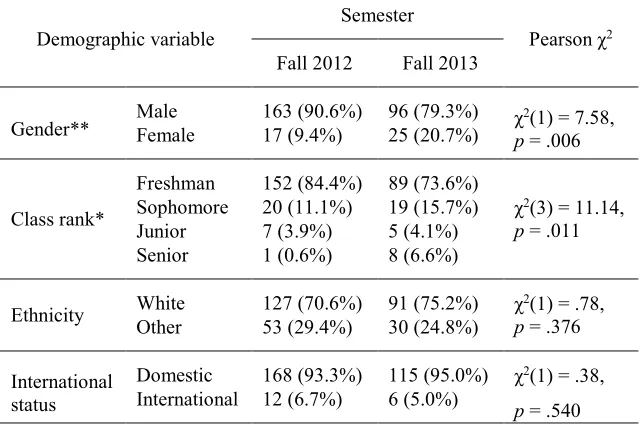
variables of gender, class rank, ethnicity, and nationality. Table 1 summarizes
the results of the Pearson χ2 tests. There was a higher percentage of females in
fall 2013, and there was a lower percentage of freshmen and a higher percentage of seniors in fall 2013. There were no differences in the distribution of ethnicity or international student status between the two semesters.
Table 1
Results of Pearson χ2 Analyses Examining Differences in Demographic
Variables by Semester
Demographic variable
Semester
Pearson χ2
Fall 2012 Fall 2013
Gender** Male 163 (90.6%) 96 (79.3%) χ
2(1) = 7.58,
p = .006 Female 17 (9.4%) 25 (20.7%)
Class rank*
Freshman 152 (84.4%) 89 (73.6%)
χ2(3) = 11.14,
p = .011 Sophomore 20 (11.1%) 19 (15.7%)
Junior 7 (3.9%) 5 (4.1%) Senior 1 (0.6%) 8 (6.6%)
Ethnicity White 127 (70.6%) 91 (75.2%) χ
2(1) = .78,
p = .376 Other 53 (29.4%) 30 (24.8%)
International status
Domestic 168 (93.3%) 115 (95.0%) χ2(1) = .38,
p = .540 International 12 (6.7%) 6 (5.0%)
Note. Number of cases reported and percentage of the students in
each
semester.
-66-
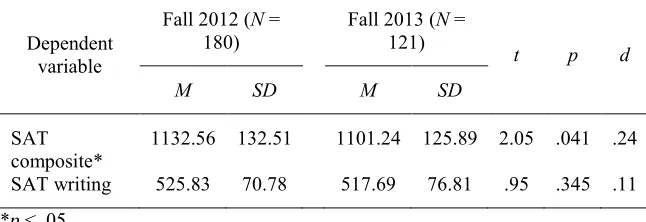
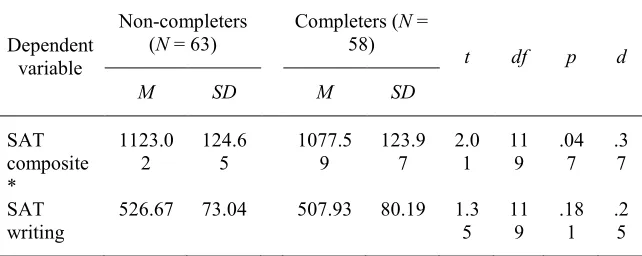
Independent samples t-tests were used to examine differences in SAT composite and writing scores of students in the fall 2012 and fall 2013 semesters. Results of the analyses are reported in Table 2. For SAT composite scores, the t-test was significant( t(299) = 2.05, p = .041, d = .24), which indicates that students in the fall 2012 semester had a higher average SAT composite score than their peers in the fall 2013 semester (the Levene’s test was not significant, so the equal variances assumed t-test was used).
Table 2
Results of Independent Samples t-testExamining Differences in SAT Scores by Semester
Dependent variable
Fall 2012 (N = 180)
Fall 2013 (N = 121)
t p d
M SD M SD
SAT composite*
1132.56 132.51 1101.24 125.89 2.05 .041 .24
SAT writing 525.83 70.78 517.69 76.81 .95 .345 .11
*p < .05.
The second manipulation check identified whether there were differences between students who elected to respond to the class perceptions survey and
those who did not in each semester. Pearson χ2 tests were used for the
categorical variables of gender, class rank, ethnicity, and nationality of students in the fall 2012 and fall 2013 semesters separately. Tables 3 and 4 summarize
the results of the Pearson χ2 tests. There were no demographic differences
-67- Table 3
Results of Pearson χ2 Analyses Examining Differences in Demographic
Variables by Survey Completion Status in Fall 2012
Demographic variable
Completed survey
Pearson χ2
No Yes
Gender Male 143 (90.5%) 20 (90.9%) χ
2(1) = .42,
p = .517 Female 15 (9.5%) 2 (9.1%)
Class rank
Freshman 134 (84.8%) 18 (81.8%)
χ2(3) = 7.33,
p = .062 Sophomore 18 (11.4%) 2 (9.1%)
Junior 6 (3.8%) 1 (4.5%) Senior 0 (0.0%) 1 (4.5%)
Ethnicity White 112 (70.9%) 15 (68.2%) χ
2(1) = .07,
p = .485 Other 46 (29.1%) 7 (31.8%)
International status
Domestic 149 (94.3%) 19 (86.4%) χ2(1) = 1.96,
p = .162 International 9 (5.7%) 3 (13.6%)
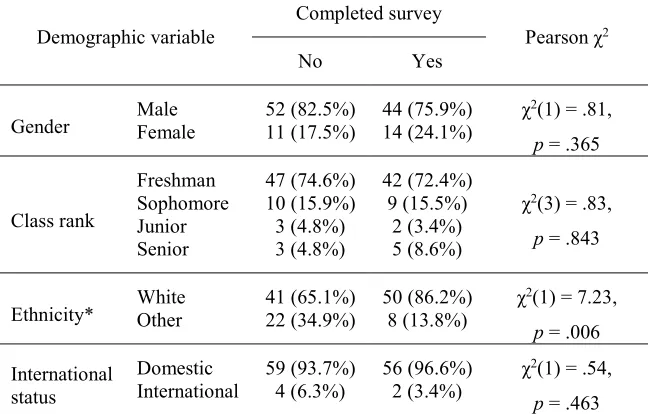
-68- Table 4
Results of Pearson χ2 Analyses Examining Differences in Demographic
Variables by Survey Completion Status in Fall 2013
Demographic variable
Completed survey
Pearson χ2
No Yes
Gender Male 52 (82.5%) 44 (75.9%) χ
2(1) = .81,
p = .365 Female 11 (17.5%) 14 (24.1%)
Class rank
Freshman 47 (74.6%) 42 (72.4%)
χ2(3) = .83,
p = .843 Sophomore 10 (15.9%) 9 (15.5%)
Junior 3 (4.8%) 2 (3.4%) Senior 3 (4.8%) 5 (8.6%)
Ethnicity* White 41 (65.1%) 50 (86.2%) χ
2(1) = 7.23,
p = .006 Other 22 (34.9%) 8 (13.8%)
International status
Domestic 59 (93.7%) 56 (96.6%) χ2(1) = .54,
p = .463 International 4 (6.3%) 2 (3.4%)
Note. Number of cases reported and percentage of the students who completed or did not complete the survey.
*p < .01.
-69- Table 5
Results of Independent Samples t-test Examining Differences in SAT Scores for Responders and Non-responders in Fall 2012
Dependen
Note. Levene’s test indicated equality of variances for all tests.
Table 6
Results of Independent Samples t-test Examining Differences in SAT Scores for Responders and Non-responders in Fall 2013
Dependent
Note. Levene’s test indicated equality of variances for all tests. *p < .05.
Research Question 1: Relationship Between Formative Peer Feedback and Student Performance
-70-
significant difference indicates that students in the fall 2013 semester (M = .95,
SD = .11) earned higher scores on the final project technical document component than those in the fall 2012 semester (M = .88, SD = .15). Neither of the covariates were significant.
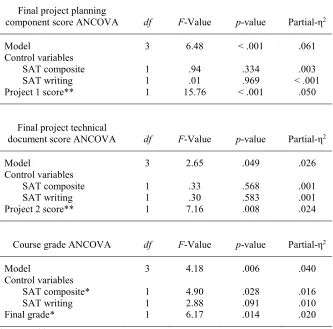
Table 7
Results of ANCOVAs to Examine Differences in Student Performance Variables in Fall 2012 and Fall 2013 While Controlling for SAT Composite and Writing Scores
Final project planning
component score ANCOVA df F-Value p-value Partial-η2
Model 3 6.48 < .001 .061
Control variables
SAT composite 1 .94 .334 .003
SAT writing 1 .01 .969 < .001
Project 1 score** 1 15.76 < .001 .050
Final project technical
document score ANCOVA df F-Value p-value Partial-η2
Model 3 2.65 .049 .026
Control variables
SAT composite 1 .33 .568 .001
SAT writing 1 .30 .583 .001
Project 2 score** 1 7.16 .008 .024
Course grade ANCOVA df F-Value p-value Partial-η2
Model 3 4.18 .006 .040
Control variables
SAT composite* 1 4.90 .028 .016
SAT writing 1 2.88 .091 .010
Final grade* 1 6.17 .014 .020
*p < .05. **p < .01.
There was also a significant difference between semesters for the final project technical document component after controlling for SAT composite and SAT writing scores, F(1,297) = 7.16, p= .008, η2 = .024. This significant
-71-
earned higher scores on the final project planning component than those in the fall 2012 semester (M = .89, SD = .15). Neither of the covariates were significant.
Related to course grade, there was a significant difference between the fall 2012 and fall 2013 semesters, F(1,297) = 6.17, p= .014, η2 = .020. This
significant difference indicates that students in the fall 2013 semester (M = .90,
SD = .11) earned higher course grades than those in the fall 2012 semester (M = .86, SD = .12). SAT composite was a significant covariate in the model
(F(1,297) = 4.90, p= .028, η2 = .016), but SAT writing was not.
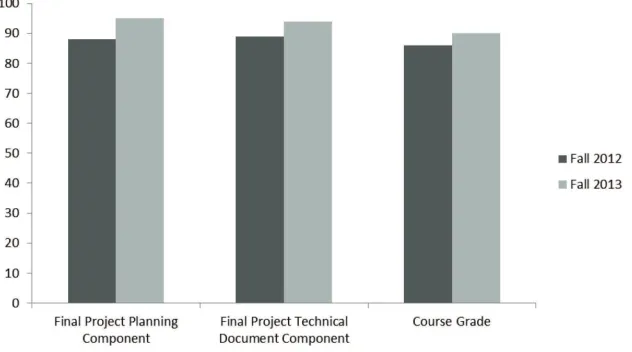
Figure 2 summarizes the results of analyses related to research question one. The final project planning component, final project technical document component, and course grade variables were all significantly higher in fall 2013 than in fall 2012 after controlling for SAT composite and SAT writing scores.
Figure 2. Percentage scores differences in final project planning component, final project technical document, and course grade between the fall 2012 and fall 2013 semesters.
*p < .05. **p < .01.
Research Question 2: Relationship Between Formative Peer Feedback and Classroom Perceptions
-72-
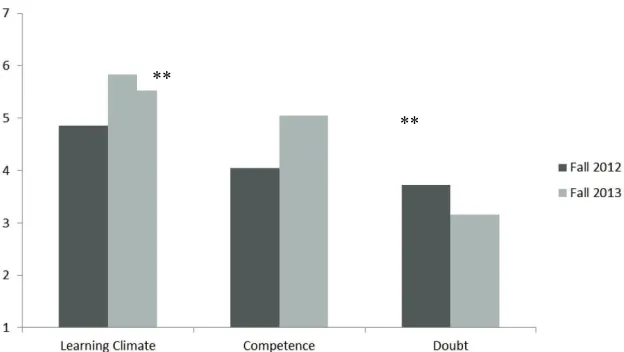
difference between semesters when controlling for SAT composite and SAT writing scores, F(1,76) = 11.98, p< .001, η2 = .136. This significant difference
indicates that students in the fall 2013 semester (M = 5.82, SD = .90) perceived a more student-centered learning environment than those in the fall 2012 semester (M = 4.85, SD = 1.49). Neither of the covariates were significant.
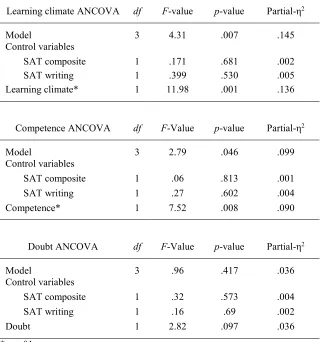
Table 8
Results of ANCOVAs to Examine Differences in Student Perception Variables in Fall 2012 and Fall 2013 While Controlling for SAT Composite and Writing Scores
Learning climate ANCOVA df F-value p-value Partial-η2
Model 3 4.31 .007 .145
Control variables
SAT composite 1 .171 .681 .002
SAT writing 1 .399 .530 .005
Learning climate* 1 11.98 .001 .136
Competence ANCOVA df F-Value p-value Partial-η2
Model 3 2.79 .046 .099
Control variables
SAT composite 1 .06 .813 .001
SAT writing 1 .27 .602 .004
Competence* 1 7.52 .008 .090
Doubt ANCOVA df F-Value p-value Partial-η2
Model 3 .96 .417 .036
Control variables
SAT composite 1 .32 .573 .004
SAT writing 1 .16 .69 .002
Doubt 1 2.82 .097 .036
*p < .01
-73-
F(1,76) = 7.52, p= .008, η2 = .090. This significance indicates that students in
the fall 2013 semester (M = 5.05, SD = .1.25) perceived a higher level of competence than those in the fall 2012 semester (M = 4.05, SD = 1.72). Neither of the covariates were significant.
ANCOVA results indicated that there was not a significant difference between students’ perceptions of doubt in fall 2012 and fall 2013 after
controlling for SAT composite and SAT writing scores. Neither of the covariates were significant.
Figure 3 summarizes the results related to research question two. Students in the fall 2013 semester perceived a more student-centered learning
environment and more competence than did students in the fall 2012 semester after controlling for SAT composite and SAT writing scores. Differences in doubt between the semesters were not significant.
Figure 3. Differences in learning climate, competence, and doubt between the fall 2012 and fall 2013 semesters.
**p < .01.
Discussion
Teamwork is an essential skill in negotiating life in the 21st century at work and in social settings. As students practice working in groups, they develop the ability to negotiate, share responsibilities, and communicate and can tackle a broader range of challenges. When formative peer evaluation was implemented, students earned higher grades on the final project and in the course and
perceived a more student-centered learning environment with an increased feeling of competence. We do need to acknowledge that instructor growth may have some impact on interpreting the findings of this work. It is possible that
**
-74-
instructor growth may account for some improvements in the student experience documented here.
Improvements in learning climate (more student centered) and competence as well as reductions in doubt have been attributed to increased student persistence (Freeman et al., 2014). If more students persist as a result of the improved experience in the fall 2013 semester, two outcomes may be worth considering. First, as Freeman et al. (2014) suggested, struggling students are more likely to drop courses than high-achieving students. In our study, fewer low-achieving students may have dropped out in the treatment group as a result of the improved learning climate, higher competence, and reduced doubt. This may have depressed final project and course grade scores during the fall 2013 semester, causing the increase documented here to be artificially low and underrepresenting the benefits shown in this study. Second, a longitudinal study may help to uncover the impact on long-term college persistence as it is related to developing a sense of connectedness through improved team-based projects. Peer evaluation used as a formative tool may have the potential to sustain a longer term impact as students engage more successfully with their peers, build competence, and reduce doubt.
Teamwork can be frustrating for high-achieving students when other members of their team will receive equal credit without contributing at the same level. Peer team member evaluation holds students accountable, which improves the experiences of the students who want grades to be representative of effort and contribution. Peer evaluation also serves to motivate students who otherwise might not participate. Educators may consider using peer evaluation as both a feedback and accountability mechanism for students.
These results suggest that our field should consider including both formative and summative peer evaluation in educational experiences to foster student skill in teamwork as well as improve the success of learning
experiences. Instructors interested in implementation strategies may find Mentzer’s (2014) article in the Technology and Engineering Teacher journal to be helpful.
-75-
compared to previous classes. Teamwork skills such as communication and acceptance of criticism can also be developed through peer assessment by educating students on how to honestly and professionally rate team participation (Topping, 1998). In addition, results of peer evaluation can serve as
documentation of student growth over time as evidence of student effectiveness in team environments, which is increasingly critical for meeting graduation requirements and programmatic accreditation (Loughry, Ohland, & Woehr, 2014).
Although assessing individual performance in groups can be beneficial, it is prudent to cover the practical issues that can arise and suggestions for mitigating them. The preparedness of the students, with respect to working in teams and evaluating peers, is critical to the success of the assessment process (Kennedy, 2005; Vickerman, 2009). In an attempt at peer assessment in a computing course, Kennedy (2005) implied that the failure of the assessment and negative perception of the process was due to the lack of understanding about teamwork and how to effectively rate peers. Students were reluctant to judge peers, causing tension among the groups. Kaufman, Felder, and Fuller (2000) provided a list of concerns with peer evaluations, such as collusion among team members, inflating self-ratings, and evaluating on personal prejudices. Kaufman et al. (2000) suggested that these concerns can be managed with a primer for students on how to complete peer evaluations objectively and the skills needed for effective teamwork. Vickerman (2009) and Chen and Lou (2004) also suggested that issues with peer evaluations can be mitigated with clear instructions on how the peer evaluations will be used in the course as well as a validated assessment tool. King and Behnke (2005) voiced concerns with grading by incorporating peer-rating data. They argued that by allowing peers to assess individual contributions to a group assignment, the instructor relinquishes full control of the grade to the team and thus may have an issue with defending a grade if challenged. It was concluded by King and Behnke (2005) that the instructor should just assign one grade to the entire group to avoid this issue. Counter to this concern, Chen and Lou (2004) suggested that “group members spend a substantial amount of time working with each other [on group assignments] and, thus, are in a good position to recognize and assess their peers’ efforts and [the individual] contributions” made by each member of the team (p. 276).
Formative peer assessment provides feedback, and students can alter their performance before the evaluative assessment is administered. Brooks and Ammons (2003) implemented assessments multiple times in a course, but the peer evaluations were utilized as summative assessments at the end of each short-term team project in the course. Whether the peer evaluations are
-76-
also recommended that learners are prepared for how to participate in peer evaluations as well as how to interpret feedback. When determining the method in which a peer evaluation instrument will be used, the validity of the chosen evaluation instrument and the behaviors that are to be measured are important factors to consider, especially when the results will be factored into student grades (Baker, 2008).
Limitations
This study had a few limitations that should be considered regarding generalization to other educational environments. Evaluation of the final project included three main components which were a planning document, a technical document, and a multimedia presentation in video form. The rubric for the video assessment in the fall 2012 semester had a typo which artificially inflated that component of the final project for only that semester. Thus, the comparison between semesters represents only two of three components of the final project rather than the entire project. Further, the grade inflation on the video
assessment in 2012 would not have created more than a 1% inflation for some students in the fall 2012 semester. The results of this work show that the fall 2013 semester course grades were significantly higher, but this may slightly underrepresent the overall impact of the treatment.
Another limitation of this study was that measures of student learning were limited to course assignments, which were not subjected to rigorous validity and reliability measures. However, the assignments and rubrics used were
intentionally codeveloped by a team of four faculty members and two
instructional developers to align with the objectives of the course. The instructor of the course initiated the study collaboratively with instructors from other sections of the course and the university’s center for learning and teaching support team. The external members of the research team served to minimize the potential for instructor bias because the course sections studied were not theirs. Although instructor-led studies of courses potentially introduce bias, the study was conceptualized after the conclusion of the semesters in which data were collected, minimizing the impact of evaluation bias on student submissions. An additional limitation related to the instructor is that although he was an
experienced faculty member, this study was set in the second and third year the course was offered at the university. This was also the first and second year that this faculty member was the instructor of this course. Therefore, instructor growth during his first and second year instructing this particular course may account for some impact on student experience.
-77-
problematic and biased as suggested by Haidt (2012) and Oakley (2002). On the other hand, Fehr and Gächter (2000) and Henrich and Boyd (2001) suggested that students are very willing to punish noncooperating students (in this case punishment comes in the form of a poor peer evaluation). Further, Henrich and Boyd (2001) suggested there may be a tendency for cooperation to potentially stabilize as students copy the most successful students’ behaviors.
Finally, conclusions about the learning climate, competence, and doubt measures were based on data from voluntarily participating students. During the fall 2013 semester, significant differences existed between students who choose to respond and those who did not. Differences discovered included SAT composite scores and ethnicity. These differences should be considered when generalizing the findings in that students’ responses were biased toward students who had lower composite SAT scores and students who identified as White, as compared to other ethnicities.
Further Research
Future research could provide additional support for this study’s hypothesis by employing a randomized control treatment in an experimental design. Research validated instruments could be used to measure student learning instead of instructor-generated assignments and assessment rubrics. This study purposefully relied on student perceptions of learning climate, competence, and doubt, which are related to student persistence, rather than direct measures of actual competence, for example. Additional research may holistically consider relatedness and student autonomy, which are aspects of self-determination theory that were not directly measured in this study. Further, trends in student contribution and their potential changes across time in a repeated measures design may shed light on how students develop teamwork skills and what “dosage” of peer feedback is appropriate for causing changes. Other measurable indicators of team success might illustrate a larger perspective including overall satisfaction with the course, ability to collaborate with students from other cultures, communication skills, ability to reflect, and ability to respond positively to criticism.
References
Baker, D. F. (2008). Peer assessment in small groups: A comparison of methods.
Journal of Management Education, 32(2), 183–209. doi:10.1177/1052562907310489
Bandura, A. (1986). Social foundations of thought and action: A social cognitive theory. Englewood Cliffs, NJ: Prentice-Hall.
-78-
Brooks, C. M., & Ammons, J. L. (2003). Free riding in group projects and the effects of timing, frequency, and specificity of criteria in peer assessments.
Journal of Education for Business, 78(5), 268–272. doi:10.1080/08832320309598613
Brutus, S., & Donia, M. B. L. (2010). Improving the effectiveness of students in groups with a centralized peer evaluation system. Academy of Management Learning & Education, 9(4), 652–662. doi:10.5465/AMLE.2010.56659882 Cestone, C. M., Levine, R. E., & Lane, D. R. (2008). Peer assessment and
evaluation in team‐based learning. New Directions for Teaching and Learning, 2008(116), 69–78. doi:10.1002/tl.334
Chen, Y., & Lou, H. (2004). Students' perceptions of peer evaluation: An expectancy perspective. Journal of Education for Business, 79(5), 275–282. doi:10.3200/JOEB.79.5.275-282
Cohen, J. (1992). A power primer. Psychological Bulletin, 112(1), 155–159. doi:10.1037/0033-2909.112.1.155
The College Board. (2009). ACT and SAT® concordance tables. Retrieved from https://research.collegeboard.org/publications/content/2012/05/act-and-sat-concordance-tables
Deci, E. L., & Ryan, R. M. (1985). Intrinsic motivation and self-determination in human behavior. New York, NY: Plenum Press. doi:10.1007/978-1-4899-2271-7
Deci, E. L., & Ryan, R. M. (2000). The "what" and "why" of goal pursuits: Human needs and the self-determination of behavior. Psychological Inquiry, 11(4), 227–268. doi:10.1207/S15327965PLI1104_01
Deci, E. L., Ryan, R. M., & Williams, G. C. (1996). Need satisfaction and the self-regulation of learning. Learning and Individual Differences, 8(3), 165– 183. doi:10.1016/S1041-6080(96)90013-8
Elliott, N., & Higgins, A. (2005). Self and peer assessment—Does it make a difference to student group work? Nurse Education in Practice, 5(1), 40– 48. doi:10.1016/j.nepr.2004.03.004
Fehr, E., & Gächter, S. (2000). Cooperation and punishment in public goods experiments. The American Economic Review, 90(4), 980–994.
doi:10.1257/aer.90.4.980
Fellenz, M. R. (2006). Toward fairness in assessing student groupwork: A protocol for peer evaluation of individual contributions. Journal of Management Education, 30(4), 570–591. doi:10.1177/1052562906286713 Fraenkel, J. R., & Wallen, N. E. (2009). How to design and evaluate research in
education (7th ed.). New York, NY: McGraw-Hill.
Freeman, S., Eddy, S. L., McDonough, M., Smith, M. K., Okoroafor, N., Jordt, H., & Wenderoth, M. P. (2014). Active learning increases student
-79-
Gay, L. R., Mills, G.E., & Airasian, P. (2009). Educational research:
Competencies for analysis and applications (9th ed.). Upper Saddle River, NJ: Pearson Education.
Goldfinch, J., & Raeside, R. (1990). Development of a peer assessment technique for obtaining individual marks on a group project. Assessment & Evaluation in Higher Education, 15(3), 210–231.
doi:10.1080/0260293900150304
Haidt, J. (2012). The righteous mind: Why good people are divided by politics and religion. New York, NY: Vintage Books.
Henrich, J., & Boyd, R. (2001). Why people punish defectors. Weak conformist transmission can stabilize costly enforcement of norms in cooperative dilemmas. Jornal of Theoretical Biology, 208(1), 79–89.
doi:10.1006/jtbi.2000.2202
Holland, N., & Feigenbaum, L. (1998). Using peer evaluations to assign grades on group projects. Journal of Construction Education, 3(3), 182–188. Retrieved from
http://www.ascjournal.ascweb.org/journal/1998/no3/Fall%201998,%20Vol. %203,%20No.%203,%20pp.%20182-188.pdf
Jassawalla, A., Sashittal, H., & Malshe, A. (2009). Students' perceptions of social loafing: Its antecedents and consequences in undergraduate business classroom teams. Academy of Management Learning & Education, 8(1), 42–54. doi:10.5465/AMLE.2009.37012178
Johnson, D. W., Johnson, R. T., & Smith, K. A. (1998). Cooperative learning returns to college: What evidence is there that it works? Change: The Magazine of Higher Learning, 30(4), 26–35.
doi:10.1080/00091389809602629
Kao, G. Y.-M. (2013). Enhancing the quality of peer review by reducing student “free riding”: Peer assessment with positive interdependence. British Journal of Educational Technology, 44(1), 112–124. doi:10.1111/j.1467-8535.2011.01278.x
Kaufman, D. B., Felder, R. M., & Fuller, H. (2000). Accounting for individual effort in cooperative learning teams. Journal of Engineering Education,
89(2), 133–140. doi:10.1002/j.2168-9830.2000.tb00507.x
Kench, P. L., Field, N., Agudera, M., & Gill, M. (2009). Peer assessment of individual contributions to a group project: student perceptions.
Radiography, 15(2), 158–165. doi:10.1016/j.radi.2008.04.004
Kennedy, G. J. (2005). Peer-assessment in group projects: Is it worth it? In A. Young & D. Tolhurst (Eds.), Proceedings of the 7th Australasian conference on computing education (Vol. 42, pp. 59–65). Darlinghurst, Australia: Australian Computer Society.
-80-
Levesque-Bristol, C., Knapp, T. D., & Fisher, B. J. (2010). The effectiveness of service-learning: It's not always what you think. Journal of Experiential Education, 33(3), 208–224. doi:10.1177/105382590113300302
Loughry, M. L., Ohland, M. W., & Moore, D. D. (2007). Development of a theory-based assessment of team member effectiveness. Educational and Psychological Measurement, 67(3), 505–524.
doi:10.1177/0013164406292085
Loughry, M. L., Ohland, M. W., & Woehr, D. J. (2014). Assessing teamwork skills for assurance of learning using CATME team tools. Jornal of Marketing Education, 36(1), 5–19. doi:10.1177/0273475313499023 Maiden, B., & Perry, B. (2011). Dealing with free‐riders in assessed group
work: Results from a study at a UK university. Assessment & Evaluation in Higher Education, 36(4), 451–464. doi:10.1080/02602930903429302 Mentzer, N. (2014). Holding students accountable in team design projects.
Technology and Engineering Teacher, 74(3), 14–20.
Millis, B. J. (2010). Why faculty should adopt cooperative learning approaches. In B. Millis (Ed.), Cooperative learning in higher education: Across the disciplines, across the academy (pp. 1–9). Sterling, VA: Stylus.
National Research Council. (2011). Assessing 21st century skills: Summary of a workshop. Washington, DC: National Academies Press.
doi:10.17226/13215
Oakley, B. (2002). It takes two to tango: How “good” students enable
problematic behavior in teams. Journal of Student Centered Learning, 1(1), 19–27.
Ohland, M. W., Bullard, L., Felder, R., Finelli, C., Layton, R., Loughery, M., . . Woehr, D. (2005). CATME. West Lafayette, IN: Purdue University. Ohland, M. W., Loughry, M. L., Woehr, D. J., Bullard, L. G., Felder, R. M.,
Finelli, C. J., . . . Schmucker, D. G. (2012). The comprehensive assessment of team member effectiveness: Development of a behaviorally anchored rating scale for self and peer evaluation. Academy of Management Learning & Education, 11(4), 609–630. doi:10.5465/amle.2010.0177
Prince, M. (2004). Does active learning work? A review of the research. Journal of Engineering Education, 93(3), 223–231.
doi:10.1002/j.2168-9830.2004.tb00809.x
Reese-Durham, N. (2005). Peer evaluation as an active learning technique.
Journal of Instructional Psychology, 32(4), 338–345.
Slavin, R. E. (1991). Synthesis of research on cooperative learning. Educational Leadership, 48(5), 71–82. Retrieved from
http://www.ascd.org/ASCD/pdf/journals/ed_lead/el_199102_slavin.pdf Smith, K. A., Sheppard, S. D., Johnson, D. W., & Johnson, R. T. (2005).
-81-
Tabachnick, B. G., & Fidell, L. S. (2007). Using multivariate statistics (5th ed.). Boston, MA: Pearson/Allyn & Bacon.
Tessier, J. T. (2012). Effect of peer evaluation format on student engagement in a group project. The Journal of Effective Teaching, 12(2), 15–22. Retrieved from http://www.uncw.edu/jet/articles/Vol12_2/Tessier.pdf
Topping, K. (1998). Peer assessment between students in colleges and universities. Review of Educational Research, 68(3), 249–276. doi:10.3102/00346543068003249
Topping, K. J. (2009). Peer assessment. Theory Into Practice, 48(1), 20–27. doi:10.1080/00405840802577569
Vickerman, P. (2009). Student perspectives on formative peer assessment: An attempt to deepen learning? Assessment & Evaluation in Higher Education,
34(2), 221–230. doi:10.1080/02602930801955986
Warner, R. M. (2013). Applied statistics: From bivariate through multivariate techniques (2nd ed.). Thousand Oaks, CA: Sage.
Williams, G. C., & Deci, E. L. (1996). Internalization of biopsychosocial values by medical students: A test of self-determination theory. Journal of Personality and Social Psychology, 70(4), 767–779. doi:10.1037/0022-3514.70.4.767
About the Authors
Nathan Mentzer ([email protected]) is Associate Professor in the Engineering/Technology Teacher Education Program at Purdue University, jointly appointed in Technology Leadership and Innovation and Curriculum and Instruction.
Dawn Laux ([email protected]) is a Clinical Assistant Professor in the Department of Computer and Information Technology (CIT) at Purdue University.
Angelika Zissimopoulos ([email protected]) is Associate Director for STEM education at the University of Chicago's Chicago Center for
Teaching.
-82-
Appendix: Questions Included on the Student Perceptions Survey Learning Climate, Competence, and Doubt Scale Items
All items measured on a 7-point, Likert-type scale ranging from strongly agree to strongly disagree.
Learning Climate Questionnaire
1. My instructor provided me with choices and options on how to complete the work.
2. My instructor understood my perspective. 3. My instructor encouraged me to ask questions.
4. My instructor listened to how I would like to do things.
5. My instructor tried to understand how I saw things before suggesting a new way to do things.
6. My instructor stimulated my interest in the subject.
7. My instructor made sure I really understood the goals of the course and what I needed to do.
Competence and Doubt 1. Competence
a. People in this course told me I was good at what I was doing. b. I was able to learn interesting new skills in this course. c. Most days, I felt a sense of accomplishment from being in this
course. 2. Doubt
a. I did not feel very competent in this course.
b. In this course, I did not get much of a chance to show how capable I was.