Ionospheric effects on differential GPS applications during
auroral substorm activity
S. Skone
), M.E. Cannon
Department of Geomatics Engineering, The UniÕersity of Calgary, 2500 UniÕersity Dr. NW, Calgary, AB, Canada T2N 1N4
Accepted 29 April 1999
Abstract
Ž .
The use of the Global Positioning System GPS technology has become increasingly incorporated into airborne remote sensing applications over the past decade. While GPS positioning results may prove adequate for several applications at present, users should expect to experience degraded positioning accuracies over the next few years due to auroral substorm activity. Such degraded accuracies will arise from increased spatial decorrelation of ionosphere range delay errors in differential GPS applications, as the ionospheric activity increases during solar maximum. In this paper, the spatial decorrelation of ionospheric range delay is estimated during a substorm event and compared with ‘‘quiet’’ time values.
Ž .
Positional errors in both vertical and horizontal measurements in the range 60–80 cm RMSE were observed during a 1997 substorm event that is representative of the activity anticipated at solar maximum around the year 2000.q1999 Elsevier Science B.V. All rights reserved.
Keywords: differential GPS; ionospheric effects; airborne remote sensing; auroral region; substorm activity
1. Introduction
Ž .
Global Positioning System GPS is a satellite navigation system which allows the position of a receiver on the earth to be computed using range information contained in the satellites’ RF signals. Twenty-four satellites currently provide worldwide coverage and GPS positioning capability. Errors in the satellite range estimates can degrade positioning accuracies. These errors may be mitigated through
Ž .
the use of differential GPS DGPS positioning algo-rithms, where range errors are calculated at reference stations and transmitted to remote users.
)Corresponding author. Tel.:q1-403-220-4984; Fax: q1-403-284-1980; E-mail: [email protected]
Differential GPS has been used in support of georeferencing airborne remote sensing applications
Ž
for a number of years Anderson, 1989; Baustert et
.
al., 1989; Schwarz et al., 1993 . Positioning accuracy requirements vary according to the application, and
Ž
some typical cases are listed in Table 1 Schwarz et
.
al., 1994 . Required accuracy, ranging from less than 10 cm for engineering and cadastral applications to 2–5 m for resource applications, can be achieved through proper GPS receiver selection, limitations on the reference-user receiver distance and the use of
Ž
proper data processing algorithms i.e., carrier vs.
.
code phase approaches . Under normal operating conditions, the errors remaining after differential
Ž
processing are due to atmospheric effects both
tro-.
pospheric and ionospheric errors , multipath and, to
0924-2716r99r$ - see front matterq1999 Elsevier Science B.V. All rights reserved. Ž .
flection of signals off nearby objects, can be miti-gated through proper antenna selection and place-ment. Atmospheric errors, on the other hand, can be
Ž
rather large depending on the weather conditions in
.
the case of the troposphere and the activity of the ionosphere.
Ionospheric error and its contribution to the over-all aircraft positioning error budget is a particularly important topic given that the next solar maximum is in the year f2000. At that time, the ionospheric error will increase in magnitude and the occurrence of geomagnetic storms will be more frequent, partic-ularly for users in northern and equatorial latitudes. This may result in poor GPS tracking capabilities due to scintillation effects, as well as poorer differen-tial positioning accuracies due to decreased spadifferen-tial correlation of the ionospheric effect. This paper fo-cuses on describing the ionospheric effects on GPS measurements and provides an estimate of the errors that can be expected at solar maximum, through analysis of a geomagnetic substorm event which occurred in April 1997. This analysis also includes a discussion of the spatial decorrelation of ionosphere range delays and the propagation of these errors into expected DGPS position accuracies.
2. Ionospheric effects on GPS
A GPS receiver measures two types of observ-ables: carrier phase in number of cycles, and code group delay in seconds. These measurements are converted to carrier phase range and pseudorange measurements, respectively, through multiplication by the speed of light in a vacuum. Implicit in GPS range measurements, therefore, are the assumptions that the GPS signal travels at the speed of light and the wavelength of the signal is equal to its
wave-s
H
d tŽ .
1whereÕ is the group velocity, c is the speed of light
g
in a vacuum, l is the true wavelength, l is the
0
wavelength in a vacuum, d N denotes the differential number of cycles and d t denotes the differential element of time. F and PR are both measured in
Ž .
units of length nominally meters .
The assumption ngsnps1 is incorrect in re-gions such as the troposphere and ionosphere, where the index of refraction may differ significantly from one. In the dispersive ionosphere, the phase index of refraction depends on several factors:
Ne2
where Nselectron density; eselectron charges
1.602=10y1 9 C; mselectron masss9.1095=
10y3 1 kg; ´ spermittivity of free spaces8.854= 0
10y1 2 C2rNm2; fsfrequency of the carrier signal.
The phase index of refraction therefore depends only on the electron density N. A corresponding expression for the group index of refraction can be derived as follows:
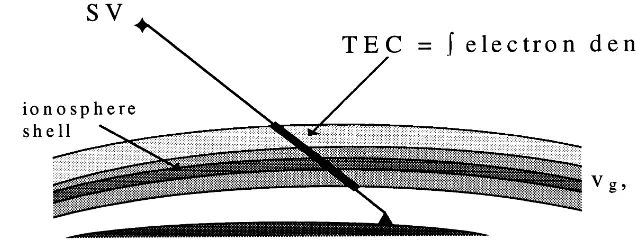
abso-Fig. 1. The slant TEC, as measured along the satellite–receiver line-of-sight. The majority of TEC is concentrated in the ionosphere shell, near altitudes of 350 km.
lute range errors associated with GPS signal
propa-Ž
gation through the ionosphere as integrated along
.
the path length :
40.3 40.3
Nd ss TEC
Ž .
5H
2 2
f path f
where TEC represents the total electron content along a 1 m2 column along the signal path. The majority of
TEC is concentrated near altitudes of 350 km, where
Ž .
the largest electron densities are found Fig. 1 . The
Ž .
dispersive nature of the ionosphere d nrd f/0 al-lows direct calculation of the absolute TEC, if range measurements are available on two separate frequen-cies:
1 1 1
TECs
ž
2y 2/
Ž
PR1yPR2.
Ž .
6 40.3 f1 f2for the case of a dual-frequency GPS receiver, where
Ž .
f1s1575.42 MHz herein referred to as L1 and
Ž .
f2s1227.60 MHz herein referred to as L2 . The corresponding absolute ionosphere range delay can
Ž .
be derived from Eq. 5 . Such range delays, along the slant line-of-sight through the ionosphere shell, are referred to as slant range delays. For differential GPS applications, the decorrelation of slant iono-sphere range delay depends directly on the distribu-tion of spatial irregularities in electron density. Such irregularities can be significant in the auroral region.
3. Auroral region and substorm effects
The auroral oval is located at northern latitudes and is characterized by enhanced conductivity and
Ž
energetic electron precipitation Fig. 2; Feldstein and
.
Starkov, 1967 . This region is limited in latitudinal extent, located between approximately 558and 658N
Ž
geographic latitude nightside — North American
. Ž
sector , with an average width of 5–78 Rostoker and
.
Skone, 1993 . Dayside oval boundaries are f108
higher; the oval being partially fixed with respect to
Ž
both the Sun and the geomagnetic pole Akasofu,
.
1968 .
Auroral regions include much of Canada and Alaska, in addition to parts of Russia and Northern Europe. Under active conditions, energy from the solar wind is released into the auroral ionosphere via large-scale electric currents carried primarily by elec-trons along terrestrial magnetic field lines. The pre-cipitating electrons collide with neutral atmospheric constituents, resulting in emissions of visible and ultraviolet radiation. Localised intensifications of
Ž
electrons result in the visible aurora Northern
.
Lights and variable TEC. Structured irregularities in
TEC can be extremely localised, with horizontal
Ž
scale sizes ranging from 20 to 400 km Coker et al.,
.
1995 . Significant decorrelation of TEC, and equiva-lently, ionosphere range delay, can occur over short distances.
Such irregularities are characteristic of
magneto-spheric substorms, which generally occur in the local
Ž .
time sector 1900–2400 magnetic local time MLT . The most volatile phase of substorm development is the expansiÕe phase, which can last 30–60 min
ŽHargreaves, 1992 . During the substorm, auroral.
oval boundaries may expand 5–108 southwards.
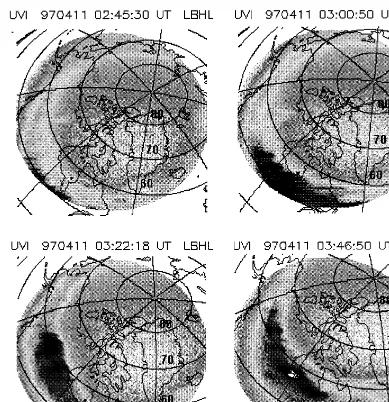
Ž
Fig. 2. Series of ultraviolet images from the POLAR satellite, depicting auroral intensifications during the April 11, 1997 substorm courtesy
.
of G. Parks, The University of Washington .
the southern United States during intense substorm events.
Sunspot activity is directly correlated with the emission of solar electromagnetic radiation and the creation of solar flares, two phenomena that control the level of auroral activity. The solar activity under-goes periodic variations over several time scales, the principal cycle having an 11-year period. A solar
maximum was last observed in 1989, with the next
solar maximum being predicted for the year 2000
ŽKunches, 1997 . At this time, an increase in the.
frequency and magnitude of magnetospheric sub-storms will accompany the enhanced solar flare ac-tivity.
4. Sample substorm event — April 11, 1997
intensifi-cations during the substorm expansive phase was observed in a series of ultraviolet images from the POLAR satellite. This satellite was located at ap-proximately 6 RE altitude, over the North American sector. The POLAR imager was developed so as to be sensitive to vacuum UV wavelengths exclusively, such that the ultraviolet images essentially depict intensities of electron precipitation. In Fig. 2, the darker regions correspond to the most intense elec-tron precipitation and variable TEC.
The image at 0245 UT in Fig. 2 shows a
continu-Ž .
ous auroral oval the lighter region at geographic
Ž
latitudes of 508, and possibly less image resolution
.
is limited by field of view , over Canada. These latitudes are approximately 58 south of typical oval
boundaries, which is consistent with southward ex-pansion of the oval during initial phases of substorm development. At 0301 UT, a bright intensification is observed near the equatorward oval boundary, initiat-ing the substorm onset and expansive phase. Intensi-fications are later observed at higher latitudes,
pro-Ž
gressively moving westward and poleward 0322 UT
.
image . These intensifications gradually dissipate un-til 0347 UT, when a second intensification occurs. During this expansive phase, aurora were reported as far south as New Hampshire and Boston. It is evi-dent, from the series of images, that auroral intensifi-cations are present in a region covering approxi-mately 608 of longitude and 108 of latitude. For
airborne remote sensing operations in such regions,
Ž
significant decorrelation of TEC ionosphere range
.
delay would be observed. Spatial characteristics of TEC are discussed in Section 5.
5. Characteristics of ionosphere range delay
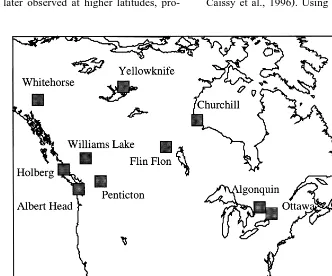
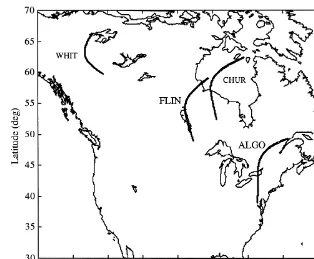
During the period of substorm development, dual frequency GPS observations were available from 10 reference stations in the Natural Resources Canada
ŽNRCan wide area network at 30 s intervals Fig. 3;. Ž .
Caissy et al., 1996 . Using these observations,
shows corresponding tracks of the satellite–receiver lines-of-sight, in the ionosphere shell where the ma-jority of TEC contributing to the range delay is concentrated. The rotational period of the GPS satel-lites is approximately 12 h, such that the satellite–re-ceiver line-of-sight moves through various regions of
gradient.
As an example, the abscissa in Fig. 4 has been labeled to reflect relative changes in space for SV tracks observed from Fort Churchill. Note that dis-tances depend on the line-of-sight velocity in the ionosphere shell, which is a function of satellite
Ž .
Fig. 5. Line-of-sight ionospheric pierce points in the ionosphere shell, corresponding to Fig. 4.
elevation angle and depends on the location of the reference station. Line-of-sight velocities range from
f20 mrs at elevation angles greater than 808, to
150 mrs at 208elevation.
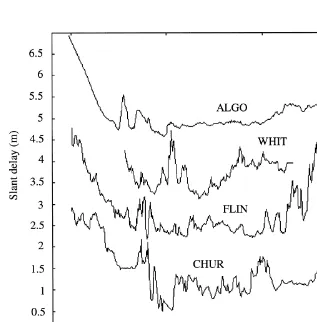
5.1. Variations in ionosphere range delay during substorm actiÕity
From Figs. 4 and 5, information can be derived concerning the amplitude and regional dependence of variations in ionosphere range delay associated with auroral disturbances. In Fig. 4, prior to 0300
Ž .
UT substorm onset , small variations in range delay are observed from Flin Flon and Fort Churchill. These variations are associated with smaller intensi-fications in the auroral oval, which are often ob-served as precursors to the more intense expansive
Ž .
phase activity Murphree et al., 1991 . Prior to 0300 UT, observations from Algonquin are smoothly vary-ing, as the satellite–receiver line-of-sight travels though a region south of the auroral oval, where no disturbances are present.
At 0300 UT, significant variations in TEC are observed at Algonquin, which arise from the equa-torward intensification observed at 0301 UT in Fig.
Ž .
2. As this intensification moves poleward Fig. 2 , increasingly large variations are observed at Flin Flon and Fort Churchill. When the second intensifi-cation occurs further westward, at 0345 UT, larger variations are observed at Whitehorse. It is evident that the larger TEC variations are correlated with auroral disturbances, resulting in temporal and spa-tial features with amplitudes in the range 30 to 75 cm. These features cause significant spatial decorre-lations in GPS ionosphere range delay errors, degrad-ing DGPS positiondegrad-ing accuracies. An estimate of the spatial decorrelation associated with these features is presented in Section 5.2.
5.2. Spectral analysis of ionosphere range delay
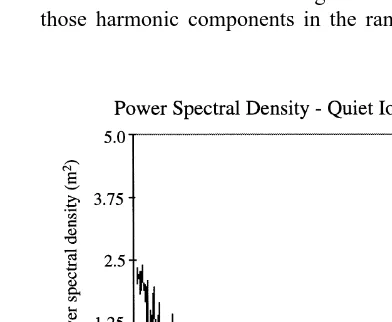
Ž .
ir-Fig. 6. Power spectral density for the substorm data set.
regularities in electron density. While it is difficult to separate these effects, it is useful to determine
ap-proximate estimates of the scale sizes and amplitudes
associated with auroral disturbances from such dis-crete time series through spectral analysis. This is done by deriving power spectral density profiles in the wave number domain for individual time series of range delay values.
5.2.1. Method
The spectral properties were computed for all
Ž
available series of ionosphere range delay i.e., Fig.
.
4 , as defined in the spatial domain. A typical tech-nique for computing these properties is the Fast Fourier Transform. The sampling interval as defined in the spatial domain, however, is uneven. This results from the varying satellite–receiver line-of-sight velocities in the plane of the ionospheric shell, which depend on the changing satellite elevation angle. For such unevenly sampled data, alternative techniques to the Fast Fourier Transform must be used to map data into the wave number domain. An algorithm for spectral analysis of unevenly sampled
Ž
data, herein referred to as the Lomb method Press et
.
al., 1997 , is implemented here. This algorithm es-sentially computes least squares ‘‘best fits’’ to a linear combination of sines and cosines at each resolved wave number.
In this analysis, a discrete series of 128 sampled data points were analysed successively. In order to calculate statistics for entire data sets, the power spectral densities were binned in wave number incre-ments of 0.001 kmy1 and averaged. Spectral
charac-teristics were derived for both the substorm event on April 11, 1997, and a series of ‘‘quiet’’ periods from
data sets. It is clear that the majority of power for the ionosphere range delays during storm conditions is concentrated in wave numbers ranging from 0.02 to 0.04 kmy1. In contrast, the majority of power for the
quiet ionosphere range delays is concentrated at lower wave numbers and higher wavelengths. This implies that the variations in Fig. 4 have wavelengths on the order of 25–50 km. Such fine-scale irregularities are a concern for differential GPS systems operating over short baselines.
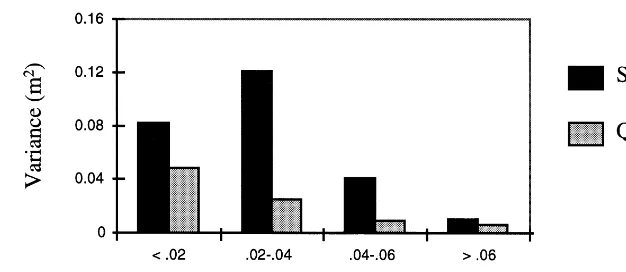
It is useful to calculate variances of harmonic components within a limited wave number range, in order to estimate amplitudes associated with fine-scale auroral disturbances. This may be done by isolating spectral components in the desired wave number range, transforming them back into the spa-tial domain and calculating the variance of the trans-formed series. Fig. 8 summarizes the variance values calculated for both the substorm and quiet data sets, in various wave number ranges. The variance of those harmonic components in the range 0.02–0.04
Fig. 8. Variances of ionosphere range delay, in various wave number ranges, for the substorm and quiet data sets.
kmy1 is on the order of 0.12 m2. This corresponds to
Ž .
an ionospheric delay of 35 cm L1 , with scale sizes in the range 25–50 km. These results suggest that fine-scale ionospheric features with amplitudes on the order of 30–40 cm may exist in regions of auroral disturbances during substorm events.
6. Discussion and conclusions
It has been demonstrated that significant varia-tions in TEC and, equivalently, ionospheric range delay, are observed during auroral substorm events. The spatial characteristics of such disturbances sug-gest scale sizes less than 50 km, with amplitudes approximately three times larger than typical quiet times values. The presence of these features will result in degraded differential positioning accuracies over short baselines.
Uncorrelated ionospheric range errors from each satellite will propagate into position accuracies via a ‘‘dilution of precision’’ factor, based on satellite geometry. These factors are of similar magnitude in both the vertical direction and the horizontal plane. For a typical dilution of precision factor of 2.0, differential ionosphere range residuals may translate
Ž .
into vertical and horizontal position errors of 60–80 cm or more during periods of substorm activity. This calculation is based on the estimated amplitudes of auroral disturbances, as derived in Section 5.2.2. These degraded accuracies are of concern for air-borne remote sensing applications operating in, or near, auroral regions. In particular, precise
engineer-ing and cadastral applications may be affected by active ionospheric conditions. During the next solar maximum predicted around the year 2000, moder-ate–major substorm events similar to the one studied in this paper are expected to occur up to 10% of the time.
Acknowledgements
The authors thank Natural Resources Canada and The University of Washington for providing data. S. Skone acknowledges financial support from the Amelia Earhart International Fellowships and the Killam Memorial Fund.
References
Akasofu, S.I., 1968. Polar and Magnetospheric Substorms. Dor-drecht Reidel Pub., DorDor-drecht, Holland.
Anderson, O., 1989. Experience with kinematic GPS during aerial photography in Norway. Proceedings of the 42nd Photogram-metric Week. Stuttgart Univ., Stuttgart, Germany, pp. 299– 312.
Baustert, G., Cannon, M.E., Dorrer, E., Hein, G., Krauss, H., Landau, H., Schwarz, K.P., Schwiertz, C., 1989. German– Canadian experiment in airborne INS–GPS integration for photogrammetric applications. Proceedings of the IAG Geodesy Symposia 102. Springer, Verlag, New York, pp. 328–333.
Ž .
T.A., Kokubun, S., Iijima, T. Eds. , Magnetospheric Sub-storms, Geophysical Monograph 64, AGU, Washington, DC.
support of airborne remote sensing. Proceedings of ISPRS
Ž .