Full Terms & Conditions of access and use can be found at
http://www.tandfonline.com/action/journalInformation?journalCode=vjeb20
Download by: [Universitas Maritim Raja Ali Haji] Date: 11 January 2016, At: 22:00
Journal of Education for Business
ISSN: 0883-2323 (Print) 1940-3356 (Online) Journal homepage: http://www.tandfonline.com/loi/vjeb20
Capstone Teaching Models: Combining Simulation,
Analytical Intuitive Learning Processes, History
and Effectiveness
Maurice Reid , Steve Brown & Kambiz Tabibzadeh
To cite this article: Maurice Reid , Steve Brown & Kambiz Tabibzadeh (2012) Capstone Teaching Models: Combining Simulation, Analytical Intuitive Learning Processes, History and Effectiveness, Journal of Education for Business, 87:3, 178-184, DOI: 10.1080/08832323.2011.586006
To link to this article: http://dx.doi.org/10.1080/08832323.2011.586006
Published online: 01 Feb 2012.
Submit your article to this journal
Article views: 225
ISSN: 0883-2323 print / 1940-3356 online DOI: 10.1080/08832323.2011.586006
Capstone Teaching Models: Combining Simulation,
Analytical Intuitive Learning Processes, History
and Effectiveness
Maurice Reid, Steve Brown, and Kambiz Tabibzadeh
Eastern Kentucky University, Richmond, Kentucky, USAFor the past decade teaching models have been changing, reflecting the dynamics, complexities, and uncertainties of today’s organizations. The traditional and the more current active models of learning have disadvantages. Simulation provides a platform to combine the best aspects of both types of teaching practices. This research explores the history of including simulation into a teaching plan and outlines an empirical method to test the effect that including a simulation can have in the classroom.
Keywords: business simulation, capstone course methodology, simulation effectiveness
Academic disciplines across the board are becoming increas-ingly aware that mastery of technical content is insufficient preparation for today’s professional careers (Chung, Baker, Harmon, & Burks, 2003; O’Reilly, 1994; Wheeler, 1998). In-creasingly, capstone courses are being used to aid the student in linking theory and the real world. Banios (1991) identified five important attributes of capstone courses to meet chang-ing needs: students should a) use significant and insightful teamwork, b) focus and use much of the knowledge acquired in the curriculum, c) solve problems representing real life, d) acquire an understanding of professionalism, and e) learn and practice planning, implementing, and controlling disci-pline related projects. This article adds to the discussion on effective components of a capstone course by documenting our experience with incorporating simulation into a capstone course as a way to make the class more meaningful for the student.
This article is organized into six parts; first we begin with an explanation of the different types of learning processes that are used to convey knowledge to students. Second, we discuss what findings have been documented in the literature about the value of using simulation as a teaching method, followed by a description of the simulation model used in this experiment. This section is followed by a description of the
Correspondence should be addressed to Maurice Reid, Eastern Ken-tucky University, Department of Marketing, Management and Adminis-trative Communication, 521 Lancaster Avenue, BTC 011, Richmond, KY 40475-3102, USA. E-mail: [email protected]
sample used in the present experiment and the findings. The fifth section presents a discussion of the key findings followed by our conclusions and suggestions for future research.
Types of Learning
Traditional learning models typically include in-depth study of a particular discipline paying little attention to other ar-eas of knowledge. Traditional models that include textbook based lecture, rote memorization, static cases, role-playing, and field study methods have been practiced for many gen-erations and can be described as gaining knowledge at the feet of the master within the silo of a discipline, such as an apprenticeship. In complex problems, traditional models can lead to quick problem identification but, with a higher in-cidence of misdiagnosis resulting in the implementation of suboptimal solutions (Lohman, 2002; Raelin, 2000). Lohman described an alternative method (double loop or action learn-ing) of learning that includes reflection and problem refor-mulation and analysis of open-ended, ill-structured problems that is proposed to be a more effective process of learning. In double-loop learning the student must go through multiple it-erations of problem framing, identification, analysis and solu-tion development to achieve an acceptable problem solusolu-tion, using theory and personal experience to assist solution devel-opment. In other words, the emphasis is on experiential learn-ing or learnlearn-ing by dolearn-ing that is through the transformation of experience (Farrell, 2005). Jonassen (1988) and Grabowski (2004) supported the method as an effective way to im-prove student learning. Sharp, Knowlton, and Weiss (2005)
CAPSTONE TEACHING MODELS 179
demonstrated the applicability of generative (double loop) learning in business settings and Zantow, Knowlton, and Sharp (2005) used the method to demonstrate that business simulation provided opportunities for generative learning. Consistent with the suggestion of Herremans and Murch (2003), business schools should use an array of methods including the professional model or traditional model and generative learning to comprehensively prepare students for their early career as well as lifelong learning. In the present research we explore if the inclusion of simulation facilitates generative learning for the student enhancing their course experience.
Value of Simulation
The value of simulation has been extensively discussed in the literature with the majority of the literature (Chapman & Sorge, 1999; Farrell, 2005; Wolf & Luethge, 2003) sup-portive of the enhancement in learning that can occur. There is a contrarian view as reported by Neuhauser (1976) and others who did not identify benefits in the primary student learning objectives of the class but did find other benefits in using simulation. Examples of positive outcomes include student teamwork and exam performance (Vaidyanathan & Rochford, 1998). Washbush and Gosen (1998) attempted to determine and evaluate the relationship between learning and simulation performance. While simulation-related learning did occur, there appeared to be no direct relationship be-tween simulation performance and learning. Thavikulwat (1999) indicated that simulations may be more effective for assessment of business education. Stephen, Parente, and Brown (2002) found large-scale simulations to be effective in balancing functional and integrative knowledge and Far-rell (2005) found that compared with various instructional tools such as static case studies and textbook use, higher student involvement and interest in simulation resulted in greater perceived learning. Keys and Wolfe (1990) indicated that simulation provides students with opportunities to ex-perience hands-on decision making. Gopinath and Sawyer (1999) claimed that the learning benefits from simulation have not been fully understood and showed that simula-tion encourages strategic decision making and group behav-ior consistent with long-term strategy. Curland and Fawcett (2001) examined the problems with numerical skills applied in operations management and finance. They indicated that business simulations can be of value in overcoming fear of the use of numbers. Burke and Moore (2003) showed that be-cause simulations go beyond lecture and other ordinary class activities, they are likely to stimulate a better understanding of the relevance of course content. Puto (2004) concluded that the case method, when truly integrated with advanced business simulations, can greatly enhance the effectiveness of business education. Faria and Wellington (2004) surveyed 149,497 business faculty members to determine simulation game usage and thoughts about these games. Of 1,085
re-spondents, 30.6% were business game users, 17.1% were former users, and 52.3% had never used such games. The assumption here is that such widespread use implies benefits gained by the student. This seems to support the claim of Zan-tow et al. (2005) that the real value of simulation continues to be underestimated.
Simulation provides an ideal platform for merging pro-fessional and active learning. Chapman and Sorge (1999) compared various instructional tools and found simulation to be a valuable tool for developing greater student apprecia-tion of real life business decision making. It can narrow the gap between a complex reality and the classroom (Doyle & Brown, 2000; Mizukami, 2002). When students make good, well-planned decisions, they can clearly see the results and rewards reflected in the simulation (Wolf & Luethge, 2003). Simulation has also been found to be effective in the in-tegration of the functional areas of business (Stephen et al., 2002) as well as the integration of theory and practice (Wolf & Luethge). Dynamic cases provide a structured en-vironment for learning complex problems and empower stu-dents to act in a rational way and solve real world problems (Brookfield, 1995; Senge & Fulmer, 1993; Shubik, 1975). Gilgeous and D’Cruz (1996) offered the following advan-tages of using simulations: a) simulations support lecture and theory validation through real life application, b) sim-ulations add dynamics to cases where students can learn about the quality of their decisions, c) simulations provide much more personal interaction and team building, and d) even the poorest simulation performers may be the most sig-nificant learners. Moratis, Hoff, and Reul (2006) indicated that business schools face the dual challenges of relevance, and development and implementation of innovative learning methods. They reviewed the roles and functions of simula-tion and show that since simulasimula-tions enable comprehensive learning they contribute to creating effective business learn-ing environments. Lynch and Tunstall (2008) indicated that evidence suggests that relevant, well-designed simulations can make a valuable contribution to students’ experience.
To understand factors that promote the effective use of simulation in management education Adobor and Danesh-far (2006) were the first to separate learning and perfor-mance as outcomes and used data from 49 teams perform-ing simulation. Their study showed a) simulation as reflec-tive of real-life situations, and task conflict and ease of use were positively associated with learning; b) emotional con-flict in the team was negatively associated with learning; c) ease of use and task conflict positively affected team perfor-mance; and (d) emotional conflict had a negative relationship to team performance. User-friendliness, realism of simula-tion, and team dynamics were demonstrated to be the im-portant criteria of effectiveness. Lainema and Nurmi (2006) described and applied a dynamic computer-based business learning environment and argued that to be effective, learn-ing tools must be realistic, complex, authentic, facilitate continuous problem solving, and embed learning in social
experience. They concluded that dynamicity and interactiv-ity are valuable characteristics of a business learning tool. Robbins-Bell (2008) argued for the need for instructors in higher education to improve student involvement in and out-side of the classroom and break down the false separation be-tween classroom learning and life learning. A virtual world is offered as a means to turn passive, knowledge-receiving students into active, knowledge-making students. Williams (2008) noted that new economic realities dictate market responsiveness in higher education and highly valued and demanded skills include information analysis, collaborative working, and just-in-time learning and realistic simulations can facilitate collaborative exchange.
There is a substantial record of simulation methodology applied to business school instructional practices, the 32 arti-cles noted in this section attest to the attention that the simula-tion process has generated over the past 20 years. Simulasimula-tion applications can be targeted to specific learning objectives or be very generic with ambiguous ill-defined problems re-quiring multiple solution identification and implementation iterations. Researchers recognize that the complexity of sim-ulations are more realistic approaches to convey practical theoretical knowledge, but the majority of the literature sur-veyed did not provide statistically significant evidence that a student’s learning was more effective using simulation ver-sus alternative learning methods. The history of simulation is rich and robust; the evidence of its effectiveness presented to date in business settings is more circumstantial.
THE CAPSTONE SIMULATION
The Capstone Simulation was originally developed for man-agement training seminars in large corporations, and has been adopted for use by over 500 colleges and universities to help teach business strategy.1 For a simulated eight-year span, competing management teams run $100 million electronic sensor manufacturing companies. A series of decisions are made each year of the simulation in the functional areas of research and development, marketing, production, human resources, finance, process management, and total quality.
Furthermore, there are five market segments, each having different customer requirements and the teams are provided with periodic financial reports. Once the decisions are up-loaded for each team, they are processed. The results are automatically entered into the matrices for the beginning of the next period’s decisions. The results are also made avail-able to each team through the Capstone Courier detailing each team’s decisions and performance. The teams take the data from the updated spreadsheets and the Capstone Courier reports and use the data to develop the next period’s decisions.
Sample
One objective of the present research was to identify the dif-ferences in student performance resulting from a simulation
exercise in the classroom from a traditional group paper as has been the practice in our school for more than a decade. To accomplish this objective an experiment was designed in which two sections of the same course, taught by one in-structor, comprised the control and treatment groups of the experiment. Each class was divided into teams of four or five members: six teams in the larger class (the control group) and five teams in the smaller class (the treatment group). The five teams from the treatment group competed against each other in the Capstone Simulation (Management Simulations, 2008).
Each class was taught in the traditional lecture– paper–exam manner and during the last two weeks of the course the control group was assigned a project where each team was assigned to analyze the strategy, performance, and potential of a competitor in the golf equipment industry. The analysis and recommendations were documented in a short paper and presented in class. The competitor teams questioned the work of the presenters and were asked how their company or client would or should respond to their competitor’s plans. The treatment class had the same lec-tures and assignments up until the golf equipment company assignment, which was replaced with the simulation. Each section was given identical exams throughout the course, including the final exam, which was administered in the week following the last presentation by the teams in each class.
The simulation grades were based on market share, stock price, and return on assets over the life of the simulation, and the explanations given by the management team of what processes they would use to improve their company’s perfor-mance in these measures. The grading for the strategic review case was based on the team’s ability to identify problems and recommend solutions that were available to their assigned client company. In the design of the experiment the grade for the simulation component and the industry strategic review were not considered as part of the experiment. The hypoth-esis was that the treatment section would perform better on the final exam than the control group.
Null Hypothesis: There would be a difference in student performance on the final exam in the capstone busi-ness strategy course between the treatment and control groups.
The final exam consisted of a case analysis; the case was given to the students one week prior to the final exam period in which a series of questions about the strategy used in the case were administered.
The quantitative data collected consists of the exam scores, which included the grade received from respond-ing to questions about the case analyzed for the final, which was identical for both class sections. In addition to the quan-titative data, qualitative data were collected in the form of course evaluations and comments solicited from the students regarding how they felt about their experience.
CAPSTONE TEACHING MODELS 181
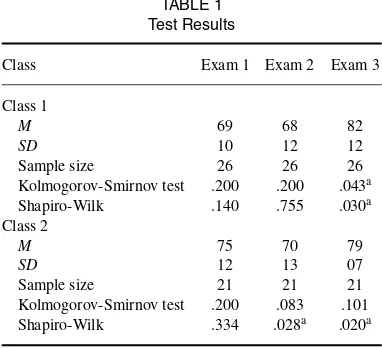
TABLE 1 Test Results
Class Exam 1 Exam 2 Exam 3 Class 1
M 69 68 82
SD 10 12 12
Sample size 26 26 26 Kolmogorov-Smirnov test .200 .200 .043a Shapiro-Wilk .140 .755 .030a Class 2
M 75 70 79
SD 12 13 07
Sample size 21 21 21 Kolmogorov-Smirnov test .200 .083 .101 Shapiro-Wilk .334 .028a .020a
aSignificant departure from normal distribution.
RESULTS
The data generated in this experiment consisted of the means of the exam scores given at three times during the course. The scores are summarized in Table 1. The Kolmogorov-Smirnov (K-S) test was used to validate the assumption of a normally distributed data set, which allowed the use of parametric statistical tests of the means.
The K-S test indicates that Exam 3 should not be assumed to have a normal distribution based on the data obtained, and in fact is a skewed distribution with six scores of 95% or better. In Class 2 both the second and third exams had clus-ters of scores that appeared to make the distribution bimodal. Although these deviations are worth noting, it was not per-ceived as significant enough to alter the conclusions of the test. As explained by Hays (1994), “so long as the sample size is even moderate for each group, quite severe departures from normality seem to make little practical difference in the conclusions reached” (p. 327).
Following this check of the data,t tests were conducted to determine if there was a significant difference in the mean exam scores obtained and this calculation is summarized in Table 2.
These results do not detect a difference in the mean exam scores at any point during the semester between the control group and the treatment group. Although not shown here, similar results are obtained if the assumption of equal vari-ances between the two classes is relaxed.
TABLE 2 Results oftTest
Exam t df Significance Mdifference Confidence interval 1 −1.646 45 .107 −.0511 [−.1136, .0014]
2 −0.614 45 .543 −.02315 [−.0991, .0528]
3 0.933 45 .356 .02767 [−.0320, .0874]
In the test results table, the Shapiro-Wilk test result was given in addition to the K-S test result, which indicates that the exam results for Class 2 Exams 1 and 2 also fail the assumption of normality, even though they pass the K-S test. According to Field (2000, 2009), the Shapiro-Wilk test is more accurate.2 Because of this result, two nonparametric tests of the data were conducted to identify differences in the mean scores of the final exam, the Mann-Whitney test and the two-sample K-S test, which both resulted in rejecting the hypothesis that there would be a significant difference between the means of the final exam scores.
This segment of the results section is on statistical power, as our sample size was limited to the number of students registered in the class, and confined to two sections; it is im-portant to determine the ability of our experiment to reject the null hypothesis when it is false. The observed power of this analysis is .150—a dismally low number. To raise the power to .8, the value typically accepted as a minimum; a sample size of approximately 122 (61 per treatment group) would be required to detect a 10% grade shift with a 95% confidence level (Hays, 1994). This target is not possible at this insti-tution as a one-time experiment, as at peak enrollment there were only 100 students registered for the course. An admin-istrative constraint is that present faculty teaching load does not typically exceed three classes equivalent to a maximum of 75 students. The result is that the design of the experiment would have to be significantly modified, affecting variables in the environment that are of no interest in the analysis.
To supplement the statistical analysis, each group was given the opportunity to evaluate the course, and the treat-ment groups were asked specifically to comtreat-ment on their experience with the simulation. A summary of the comments appears in Appendix A, and the comments and observations of the instructor suggest that the students treated to the simu-lation were significantly more engaged with their assignment. They were much more emotional about the periodic feedback and protective of their strategic plans. They had complete dis-cretion of when their team met and how they made decisions, with the only requirements being to have their decisions input by the announced deadline and to respond to any correspon-dence received from the instructor (in the form of a major stockholder, government regulator or other stakeholder). The most common complaint was there was insufficient time to meet (as a group) to review and analyze the available infor-mation before the next set of decisions was due. This was not an issue in the class with the case assignment.
DISCUSSION
The net result of this research is that we are unable to ob-jectively identify a difference between using a simulation method versus the traditional term paper or written assign-ment in a controlled experiassign-ment. Using the subjective evi-dence, there is heightened sense of engagement among the
students that seems to be fueled by the competitive atmo-sphere created in the simulated environment. This is consis-tent with other findings in the literature (Anderson & Law-ton, 1992; Chapman & Sorge, 1999; Faria, 2001; Gopinath & Sawyer, 1999; Hornaday & Curran, 1996; Knotts & Keys, 1997; Washbush & Gosen, 2001) in which objective sta-tistical evidence of the effect of including simulation in a management strategy course was inconsistent.
Our approach in which the variation in all the environ-mental variables, textbook, instructor, and lectures were min-imized is a rigorous attempt to isolate the effect of the simu-lation, but still requires more students, more sections of the course, and more instructors than our student and faculty pop-ulation on campus have to generate results sufficient to gener-alize the findings to a larger population. To achieve this level of statistical accuracy it is necessary to introduce more vari-ation in the number of instructors, lecture style, and course content emphasis. An alternative way to achieve a larger sample would be to replicate the experiment over multiple terms with one instructor, which could introduce variation in lecture content and emphasis plus introduce bias in student selection of the course, where students select the style of course in which they feel more comfortable or successful.
Another aspect of this research that bears inspection is the type of assessment used to gauge student comprehension of the model taught in class. The posttreatment exam consisted of a short case analysis designed to demonstrate the students’ understanding of the application of the strategy model taught in the class. The questions included critiquing the external environment, the internal environment and making recom-mendations that would support their understanding of the mission of the organization in the case.
The application of the knowledge gained during the simu-lation is different than the way knowledge is gained in a case study, which could bias the control group to perform better at recognizing the issues in the case environment, whereas the treatment group (those in the simulation) had more em-phasis on implementing strategy. Students are taught that implementation is at least as important as devising a good strategy and the thought that a mediocre strategy well ex-ecuted can beat an excellent strategy poorly exex-ecuted was mentioned in lecture. Given this bias, is the posttreatment exam of a case analysis the best way to assess a student’s understanding of the material? More emphasis on the imple-mentation of strategy could have been included in the final exam, although having feedback loops that are important in implementation, are impractical for a simple written exam. Although the identification and implementation of strategic issues and initiatives are taught, testing and lecture topics are biased toward identification.
A second concern in this experiment is that this research used teams of students to prepare all the papers written in the course yet tested students on their individual knowledge of the theoretical concepts. In the posttreatment exam the students were individually tested on their ability to identify problems and suggest recommendations. The group versus
individual dynamic has been identified and recognized as a factor (Thorelli, 2001) in the performance difference be-tween groups and the individuals that comprise the group. The method chosen for this research was to base the per-formance metric on individual perper-formance and the group performance was not examined.
The subjective comments about the simulation were gen-erally very positive and during the sessions that were ob-served by the instructor the involvement of the entire team was a positive experience (in terms of course objectives, listed in the Appendix B). Some teams organized function-ally (with each member assigned a discipline) for the deci-sions to be made and others used a more democratic process (each member contributed to all the decisions to be made). The organization of the team required the use of manage-ment techniques learned in other classes, as did understand-ing the periodic reports generated as a result of the decisions they input; using these skills were additional benefits of the simulation. In reviewing the strategies the student teams em-ployed it was interesting to see that some teams consciously chose strategies that were discussed in class as being nonop-timal choices: for example, choosing to compete in the most sophisticated product market with minimal research and de-velopment spending. This presented a learning opportunity when they lost market share, revenue, and shareholder value until they realized their error. This experience was signifi-cantly more meaningful to the team than missing a question on a test. This type of experience also emphasized to the instructor the value in more extensive debriefing of the simu-lation to insure that the teams recognize the errors they made and how to correct their errors.
CONCLUSION
This experiment had a positive impact on the student par-ticipants and on the instructor. The theory that was assumed to be understood by the instructor clearly was not under-stood by the class, and the simulation highlighted many of these areas. The design of the assessment measures used in the course has limitations that do not sufficiently incorporate strategic implementation and the use of feedback systems to insure a strategy is moving toward the desired objectives. Communication within the teams works differently when there is additional stress put on the organization, and the stress created on the term paper group was a different type of stress than the stress created in the simulation. The stress was different because of the multiple deadline periods, the unstructured and variable problems that the teams had to identify and resolve that appeared erratically within the sim-ulation, and the required response to competitive teams that were out to satisfy the same universe of customers. These characteristics make the two approaches very different, and the simulation has value just because it is a different way of creating a learning environment that incorporates the same learning goals through a different delivery method.
CAPSTONE TEACHING MODELS 183
The initial objective of this study was to review the use of simulation in a business classroom setting and compare the method to the case and lecture method. Although our findings are consistent with the majority of the existing literature, we note that there is a lack of research that explores the student performance effect of simulation use in a statistically reliable and valid way. In the preface to the 17th edition ofCrafting and Executing Strategy, Thompson, Strickland, and Gam-ble (2010) stated that “a three-pronged text-case-simulation course model has significantly more teaching/learning power than the traditional text-case model” (p. xvii) and the way this power is reflected in student performance needs to be more effectively documented.
NOTES
1. Capsim Management Simulations Inc., http://www. capsim.com
2. “The Shapiro-Wilk Statistic yields exact significance values where as the K-S Test sometimes gives an ap-proximation of .2 for the significance because SPSS cannot calculate exact significances. This finding high-lights an important difference between the K-S Test and the Shapiro-Wilk Test: in general the Shapiro-Wilk Test is more accurate” (Field, 2009, p. 546).
REFERENCES
Adobor, H., & Daneshfar, A. (2006). Management simulations: Determining their effectiveness.Journal of Management Development,25, 151–168. Anderson, P. H., & Lawton, L. (1992). The relationship between financial
performance and other measures of learning on a simulation.Simulation & Gaming,23, 326–341.
Banios, E. W. (1991, September), Teaching engineering practices. In L. P. Grayson (Ed.),Proceedings of the annual frontiers in engineering education conference(pp. 161–168). West Lafayette, IN: IEEE. Brookfield, S. D. (1995).Developing critical thinkers. San Francisco, CA:
Jossey-Bass.
Burke, L. A., & Moore, J. E. (2003). A perennial dilemma in OB education: Engaging the traditional student.Academy of Management Learning & Education,10(1), 37–52.
Chapman, K. J., & Sorge, C. L. (1999). Can simulation help achieve course objectives? An exploratory study investigating differences among instruc-tional tools.Journal of Education for Business,74, 225–230.
Chung, G. K. W. K., Baker, E., Harmon, T. C., & Burks, G. A. (2003).
The impact of simulation and problem based learning designer project on student learning and teamwork skills. CSE technical report. Piscataway, NJ: IEEE.
Curland, S. R., & Fawcett, S. L. (2001). Using simulation and gaming to develop financial skills in undergraduates.International Journal of Contemporary Hospitality Management,13, 116–119.
Doyle, D., & Brown, W. F. (2000). Using a business simulation to teach applied skills—the benefits and challenges of using student teams from multiple counties.Journal of European Industrial Training,24, 330–336. Faria, A. J. (2001). The changing nature of business simulation/gaming
research: A brief history.Simulation & Gaming,32(1), 97–110. Faria, A. J., & Wellington, W. J. (2004). A survey of simulation game users,
former-users and never-users.Simulation & Gaming,35, 178–207.
Farrell, C. (2005). Perceived effectiveness of simulations in international business pedagogy: An exploratory analysis.Journal of Teaching in In-ternational Business,16(3), 71–88.
Field, A. (2000).Discovering statistics using SPSS for Windows. Thousand Oaks, CA: Sage.
Field, A. (2009).Discovering statistics using SPSS. Thousand Oaks, CA: Sage.
Gilgeous, V., & D’Cruz, M. (1996). A study of business and management games.Management Development Review,9(1), 32–39.
Gopinath, C., & Sawyer, J. E. (1999). Exploring the learning from an enter-prise simulation.Journal of Management Development,18, 477–489. Grabowski, B. L. (2004). Generative learning contributions to the design of
instruction and learning. In D. H. Jonassen (Ed.),Handbook of research for educational communications and technology(2nd ed., pp. 719–743). New York, NY: Simon & Schuster/Macmillan.
Hays, W. (1994).Statistics(5th ed.). Orlando, FL: Harcourt Brace. Herremans, I. E., & Murch, R. (2003). Multidisciplinary decision making
through experiential learning perspectives from practical trials.Innovative Higher Education,28(1), 63–83.
Hornaday, R. W., & Curran, K. E. (1996). Formal planning and the per-formance of business simulation teams.Simulation & Gaming,27, 206– 223.
Jonassen, D. H. (1988). Learning strategies in courseware. In D. H. Jonassen (Ed.),Instructional designs for microcomputer courseware(pp. 151–181). Hillsdale, NJ: Erlbaum.
Keys, B., & Wolfe, J. (1990). The role of managerial games and simulation in education and research.Journal of Management,19, 307–36. Knotts, U. S. Jr., & Keys, J. B. (1997). Teaching strategic management with
a business game.Simulation & Gaming,28, 377–394.
Lainema, T., & Nurmi, S. (2006). Applying an authentic, dynamic learn-ing environment in real world business.Computers & Education,47(1), 94–115.
Lohman, M. C. (2002). Cultivating solving skills through problem-based approaches to professional development.Human Resource Devel-opment Quarterly,13, 243–261.
Lynch, M. A., & Tunstall, R. J. (2008). When worlds collide: Develop-ing game-design partnerships in universities.Simulation & Gaming,39, 379–398.
Management Simulations. (2008).Professor guide: Capstone business sim-ulation. Northfield, IL: Author.
Mizukami, M. (2002, July).Learning from cases and bridging some ‘theory-practice’ gaps. Paper presented at the 47th World Assembly of the Interna-tional Council on Education for Teaching, Amsterdam, the Netherlands. Moratis, L., Hoff, J., & Reul, B. (2006). A dual challenge facing management
education: Simulation-based learning and learning about CSR.Journal of Management Development,25, 213–231.
Neuhauser, J. (1976). Business games have failed.The Academy of Man-agement Review,1(4), 124–129.
O’Reilly, B. (1994). Reengineering the MBA.Fortune,129(2), 38–44. Puto, C. (2004, May/June). The next best thing.BizEd, 44–49.
Raelin, J. A. (2000).Work-based learning: The new frontier of management development. Upper Saddle River, NJ: Prentice-Hall.
Robbins-Bell, S. (2008). Higher education as virtual conversation.Educause Review,43(5), 24–34.
Senge, P. M., & Fulmer, R. H. (1993). Simulations systems thinking and anticipatory learning.Journal of Managerial Development,12(5), 21–33. Sharp, D. C., Knowlton, D. S., & Weiss, R. E. (2005). Applications of generative learning for the survey of international economics.Journal of Economic Education,36, 345–357.
Shubik, M. (1975).The uses and methods of games. New York, NY: Elsevier. Stephen, J., Parente, D. H., & Brown, R. C. (2002). Seeing the forest and the trees: Balancing functional and integrative knowledge using large scale simulation in capstone business strategy classes.Journal of Management Education,26, 164–193.
Thavikulwat, P. (1999). Developing computerized business gaming simula-tions.Simulation & Gaming,30, 361–366.
Thompson, A., Strickland, A. J., & Gamble, J. E. (2010). Crafting and executing strategy, text and readings(17th ed.). New York, NY: McGraw-Hill Irwin.
Thorelli, H. B. (2001). Ecology of international business simulation games.
Simulation & Gaming,32, 492–513.
Vaidyanathan, R., & Rochford, L. (1998). An exploratory investigation of computer simulations, student preferences, and performance.Journal of Education for Business,73, 144–149.
Washbush, J. A., & Gosen, J. (1998). Total enterprise simulation perfor-mance and participant learning. Journal of Workplace Learning, 10, 314–319.
Washbush, J. A., & Gosen, J. (2001). An exploration of game-derived learn-ing in total enterprise simulations.Simulation Gaming,32, 281–296. Wheeler, B. C. (1998, Winter), The state of business education: Preparation
for the past?Selections,14(2), 19–21.
Williams, P. (2008). Assessing context-based learning: Not only rigorous but also relevant, Assessment & Evaluation in Higher Education,33, 395–408.
Wolf, J., & Luethge, D. J. (2003). The impact of involvement on performance in business simulations: An examination of Goosen’s know little decision-making thesis.Journal of Education for Business,79, 69–74.
Zantow, K., Knowlton, D. S., & Sharp, D. C. (2005). More than fun and games: Reconsidering the virtues of strategic management simulations.
Academy of Management Learning & Education,4, 451–458.
APPENDIX A—SUMMARY COMMENTS MADE BY THE STUDENT TEAMS AT THE END OF
THE SIMULATION
Team A
• We tried to focus on two markets with insufficient sources to satisfy market demand and other customer re-quirements
• We consistently priced our product too high relative to the competition
• We had poor communication processes among the man-agement team
• There wasn’t enough time to fully analyze the environment prior to making decisions
Team B
• Focused on one market
• Extremely satisfied with company performance; ROS of 14.9% over the life of the simulation, ROA of 24.5% and shareholder value quadrupled.
• Developed highly automated production and a low tech product for cost leadership in the market sector
• Emphasized use of research and development (high spend-ing level each period)
• Did not use price as a competitive weapon • Committed to human resource development
• Issued stock to fund R&D and manufacturing plant ca-pacity growth
• Invested in Total Quality Management to keep production costs low
Team C
• Identified strategic choice as maintaining competitiveness without dominating any one market segment
• Communication problems at the start of the simulation resulted in a more autocratic/hierarchical management structure
• Choose to participate in two markets
• Made poor forecasts one half way through the simulation that put the team behind the competition (firm perfor-mance)
• Enjoyed the financial modeling aspect of the simulation.
Team D
• Strategy: Low research and development investment, while competing in the high tech segment
• Use competitive intelligence to maintain competitiveness ◦ Note: This team had strategies for R&D, Marketing, Production and Finance that were not complementary • Group decisions had better outcomes than individual
de-cisions; but the time constraints detracted from the expe-rience
Team E
• Identified the mission as market leader in price and sales • Focus investment in production, and marketing
• Inflexibility of automated production became a problem as market technology improved making the manufacturing facilities obsolete
• Used a democratic management style, team vote on all decisions
• Kept team member participation high
• First five periods reinvested all earnings then declared a dividend in the remaining periods.
APPENDIX B—CAPSTONE COURSE OBJECTIVES
• To develop your capacity to think strategically about a company, its environment, objectives and direction. • To integrate the skills you have acquired in
vari-ous business disciplines to solve real world complex problems. To demonstrate the advantages of managing the different parts of a business with complimentary strategies.
• To sensitize you to the importance of ethics and values in management practices.
• Provide students with an ability to:
◦ Approach and analyze problems in a systematic manner ◦ Communicate with analysts in other disciplines ◦ Understand the solutions obtained