in Indonesian decentralization. his research ills the research gap in the studies of regional development in Indonesia that presently neglected the role of spatial di-mension. To do so, this paper follows previous studies that explore this efect using the statistics data and spa-tial econometrics analysis methods. here are two con-tribution of this paper. First, this paper analyses spatial autocorrelation at districts level to capture the dynamic of regional convergence in the decentralization period. Second, the paper examines the impact spatial sensitiv-ity of Indonesia districts using a spatial shock.
his paper is arranged as follows; Section 2 discuss-es theoridiscuss-es on decentralization and spatial economet-rics. Section 3 presents an explanatory spatial analysis over the period 1994-2004. Section 4 elaborates spatial econometrics analysis. Section 5 concludes research indings.
2. he Methods
Despite this complex mathematical equation, the neoclassical theory is considered as a non-spatial con-vergence concept that has neglected that each region as a dependent entity and ignored the potential for in-teraction across space [Rey and Mountori, 1999]. he traditional concept views that the unit of analysis is individual regions observed as part of a cross section or time series. his stylized convergence analysis is con-trast with the current development on economic geog-raphy. In the last decade, the economic geographic liter-ature has recognized the relational concepts of regional developer. For instance, Krugman [1991] identiied technology spillovers as the key mechanism that lead to convergence, has yet to be explored in the conver-gence stylized analysis. Similarly, other theories such as industrial districts and innovative milieu within the ter-ritorial innovation models also acknowledged the role of regional economic relationship and institutional ar-rangements. However, the emergence of spatial analysis provides a signiicant improvement in the regional con-vergence analysis that emphasis to understand the role of geographical proximity on regional economic growth. he idea of spatial autocorrelation initiated from the geo-referenced map analysis that are not indepen-dent between each other. Despite the various concepts, such as distance-decay, spatial interaction, and spatial randomness, it cannot be associated with the concept of spatial autocorrelation. his is because spatial au-tocorrelation is linked with statistical theory than to spatial theory [Getis, 2007]. hus, spatial autocorre-lation theory evolved from the analysis of pattern of variables on maps. It was Luc Anselin [1988] that ini-tiated spatial scientist including geographers, urban planner and economist to consider spatial efects in a geo-referenced models and data. Explanatory analysis of plausible and spatial-like clustering could explain a variety of situations such as revealing social interac-tion that are not seen in common display [Ward and Gleditsch, 2008]. hus, these potentially unobserved
data, new spatial mathematical formulation, and new and powerful computers and sotware) [Anselin, 2007]. For example, various studies on the social science by Goodchild et al. [2000] and in political science by Fran-zese et al. [2009]. Another property of spatial analysis is the spatial weight matrix. Spatial weight matrix is a square matrix of dimension equal to the number of ob-servations. he element wij refers to the weight matrix W is non-zero is locations i and j are neighbors, and zero otherwise (with the diagonal elements wij equals to zero). here are a wide range of criteria to deine neighbors such as binary contiguity (common bound-ary), distance bands (locations within a given distance of each other) and “social” distance [Syabri, 2003]. he spatial weight matrix is used to represent the lo-cational similarity and it is derived from the bound-ary iles or coordinate data in a geo-referenced maps.
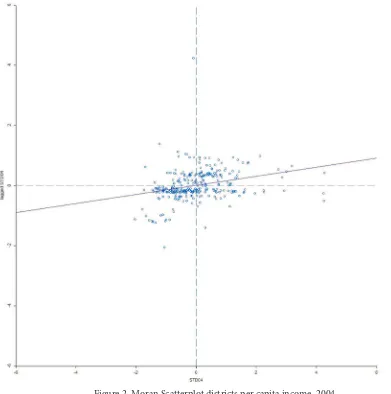
he Moran scatter plot is a speciic scatter plot that visualized the degree of spatial autocorrelation, initiat-ed by Anselin [1995]. he Moran scatter plot iscenterinitiat-ed on the mean and shows the value of a variable (z) on the horizontal axis and its spatial lag on the y axis (Wz or ∑ jwijzj) [Syabri, 2003]. he slope of the linear regression line through the scatter plot is the Moran’s I coeicient (Wz on Z). In addition, a Moran scatter plot map that shows the locations that corresponds to the four quad-rants. hus, the sotware shows the degree of spatial auto-correlation in both cross-section and over time settings. he heil index indicates that overall disparities among regions in Indonesia has decline (Table 3). How-ever, if we decomposed to three types of regional divi-sion, which are the within province, between province, and within province, the disparity level are diverse. he disparity among districts has decline sharply between the years, while the disparity between provinces has de-cline at a lower rate. An interesting inding is that dis-parities between three parts of Indonesia, the western, central and eastern region, increase signiicantly during the pre-decentralization period in the 1990s
a
nd peaked during the early 2000s before it reached its current posi-tion. his inding conirms that East region of Indonesia are severely let behind in economic and welfare terms. Following Anselin [2003], the Moran scatter plot plots the standardized income per capita with its spa-tial lag in 1993 (Figure 1) and in 2006 (Figure 2). he four spatial quadrants represents four diferent types of spatial dependence between a district and its neigh-bors: he HH indicates districts with high income with high income neighbors (quadrant I-top let), a low income district with high income neighbors (quad-rant II-top right), a low income district surround by low income neighbors (quadrant III-bottom right), and a high income district surround by low income neighbors (quadrant IV-bottom let). he quadrant I and III indicates positive forms of spatial dependence and the other two quadrants shows negative form. A diferent presentation of the spatial dependence is seen in the maps the local Moran statistics for eachdistrict at both years (Figure 3 and 4). Districts in Java Island and Papua are dominated with low income dis-tricts with higher income disdis-tricts, which show negative spatial dependence among these regions. While dis-tricts in North and East Kalimantan have high income per capita districts, similar with their high income neighbors. While changes between 1993-2006 can be seen the most at Papua Island where it used to be almost negative spatial dependence with low income districts surrounded with higher income neighbors, in 2006 it become positive spatial dependence with a mix of high income districts surround by lower income districts.
heory of SAL and SEM. he second non-spatial analysis is the ß Convergence and it is calculated to over-view absolute convergence (less developed regions grow faster than rich regions) exists [Barro, 1991]. he regres-sion equation for Absolute ß Convergence is as follow:
Where the dependent variable is the logarithm of per capita income or product, y, and ß are constants, with 0< ß <1 and uit, is the random disturbance term. At ß >0 implies that –convergence since the annual rate of growth is negatively related with ln (yi, t), with higher value of ß shows convergence. Conditional convergence occurs (poorer regions grow faster than rich regions if other variables takes into accounts beside initial income level). For β convergence conditional the empirical model is as suggested by Resosudarmo and Vidyattama [2006]:
he regression in equation (3) is for the conditional convergence analysis with i is the administration level, provincial or district, this the index of time, yit is GDP per capita, the X’it are the vector of local revenue and Z’it is the intergovernmental transfer fund variable. he model needs the individual efect, ŋi, to endogenous growth theory demonstrates that policy measures can have an impact on the long-run growth rate of an economy [Aghion and Howitt, 1998]. To performed spatial regression analysis, we con-struct spatial weight based on the distance based spatial matrix, rather than the adjacency matrix because the former model allow islands (contiguity), considering Indonesia’s natural geographic islands. Considering In-donesia geographical character, the choice of the weight matrix type depends on the research location. For ex-ample, if the study focuses on one island, the appropriate weight matrix is the contiguity matrix, as it considers
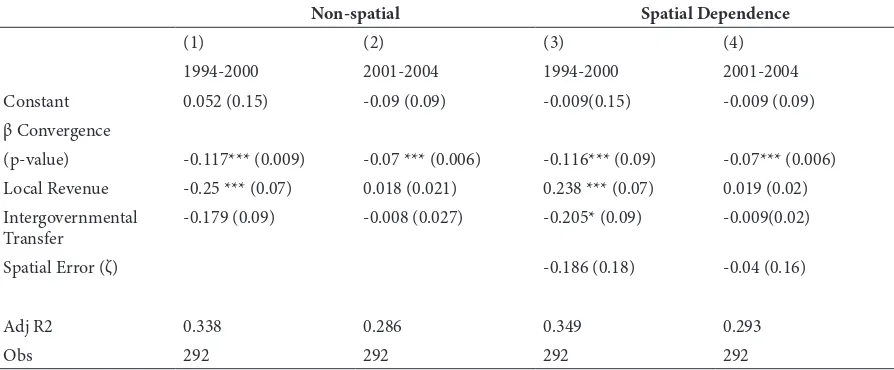
gence with the higher coeicient in the pre-decentral-ization period with at -0.117 (column 1 and 2). How-ever, the analysis in the decentralization period lack of sig niicant determinant factors, as local revenue and intergovernmental transfer variables are insigniicant. hus, the analysis only explains 28.6 per cent of re-gional economic growth in the decentralization period. he following analysis conirms convergence regional growth when spatial dependence is included (column 3 and 4). Similar with the non-spatial OLS, the spatial dependence analysis shows that convergence rate is higher in the pre-decentralization than in the decen-tralization period, -0.116 and -0.07, respectively. he analysis also suggested that both local revenue and intergovernmental transfer are spatially signiicant in the pre decentralization period. However, the analy-sis did not provide evidence of spatial autocorrelation as the spatial error is insigniicant for both period. he analysis is interested with the change of eco-nomic growth due to shock through the spatial error model. Following Rey and Montouri [1999], this article introduce a shock to the capital city, Jakarta, error term and substitute the maximum likelihood estimations of the spatial error model coeicients into equation (5) to estimate the degree of spatial spill-over . he shock is in-troduced to Jakarta as it is the largest and most economic-connected city in Indonesia, thus a shock is expected to
signiicantly luctuate the country’s economy condition. his is illustrated with the following map that shows the further a region from Jakarta it does not necessar-ily to have lower change of economic growth (Figure 5). he shock efect on Jakarta is 37% lower relative to the estimate without the shock and it had the largest impact to the bordering South Kalimantan regency of Barito Kuala. his case of Indonesia does not con-irm the indings of Rey and Montouri [1999] that found clear spatial pattern due to the shock for the case in USA. In detail, in Java itself, the shock does provide a spatial pattern with districts bordering with Jakarta had signiicant efect of economic growth. 4.Conclusion
In this paper, I have provided new insights to the regional economic convergence patterns in Indone-sia between pre and post decentralization. his pa-per improves previous research by acknowledging the role of spatial efects in the formal analysis of re-gional convergence in general and speciies the spa-tial efects uniqueness of Indonesian main islands. he exploratory methods conducted in this paper proofs strong evidence of spatial autocorrelation among Indonesia districts. While districts are converging in relative GRDP, there is evidence that this movement is similar to their neighbors. hus, this study gives
evi-Table 1. Local Expenditure Proportion to Central Government Budget in Indonesia, 2002-2005 (%)
2002 2003 2004 2005
Local Expenditure/ Central Expenditure 47.19 37.73 42.34 41.93
Local Expenditure/GDP 7.07 4.93 7.82 8.6
Local Development Budget / Central Development Budget 19.36 10.02 14.25 5.22
Source: BPS, Author’s calculation
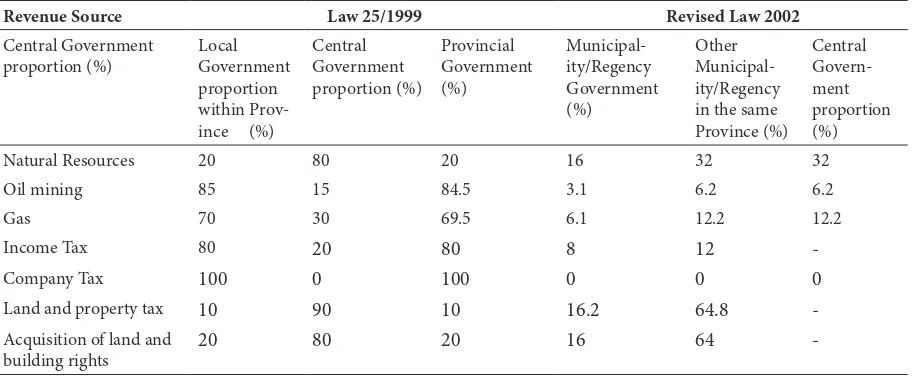
Table 2. Comparison Balance Fund: Level of transfer of fund between Central and Regional Governments under Law 25/1999 and its revised in 2004
Revenue Source Law 25/1999 Revised Law 2002
Central Government
Natural Resources 20 80 20 16 32 32
Oil mining 85 15 84.5 3.1 6.2 6.2
Gas 70 30 69.5 6.1 12.2 12.2
Income Tax 80 20 80 8 12
-Company Tax 100 0 100 0 0 0
Land and property tax 10 90 10 16.2 64.8
-Acquisition of land and building rights
20 80 20 16 64
Figure 2. Moran Scatterplot districts per capita income, 2004
dence that spatial efect contribute to regional dispari-ties, thus it will be a misleading to ignore. he local Mo-ran map shows lack of spatial efect in Indonesia main islands with slightly than 50 per cent districts has sig-niicant spatial autocorrelation with its neighbors. Sec-ond, there is evidence that convergence rate is higher in the decentralization period. his conirmatory analysis reveals that the a-spatial regression is mispeciied as the evidence of spatial dependence is presence. he spatial error model also suggested that through random shocks individual districts are not only move from its current steady state, but also throughout the system of dis-tricts that inluence dynamic of regional convergence. he insigniicant spatial shock suggested that a geographically-centered shock is not appropriate for an island country such as Indonesia. A shock should be introduced to individual islands and longer years of observation in the post decentralization period will provide more accurate analysis to examine the possi-ble spatial dependence. However, this study should be considered as frontier for spatial dependence analysis on Indonesia regions. here are two policy implica-tions from this research inding. First, decentraliza-tion law should be revised to reduce district dispari-velopment within the islands. Regional economic con-cepts could be applied to achieve this such as classical (regional growth centers such as agglomeration in in-dustry clusters) and contemporary concepts (learning regions with improving local institutional capacities and local knowledge-based industries such as technol-ogy innovation and creative industry). Recent studies highlights regional development should acknowledge local variation and thus development strategies should be adjusted [Barca et al, 2011; Puspitasari, et al, 2010]. Acknowledgement
his may give an appreciation to institution or re-sponse that helps in research and report writing. his part may also describe the source of research fund use in the research. Parts of the paper was written during the author’s PhD study at the University College Lon-don, which was funded by the Ministry of Communica-tion and InformaCommunica-tion Technology, Republic Indonesia. Table 6. OLS Conditional Regressions
Non-spatial Spatial Dependence
(1) (2) (3) (4)
1994-2000 2001-2004 1994-2000 2001-2004 Constant 0.052 (0.15) -0.09 (0.09) -0.009(0.15) -0.009 (0.09) β Convergence
(p-value) -0.117*** (0.009) -0.07 *** (0.006) -0.116*** (0.09) -0.07*** (0.006) Local Revenue -0.25 *** (0.07) 0.018 (0.021) 0.238 *** (0.07) 0.019 (0.02) Intergovernmental
Transfer
-0.179 (0.09) -0.008 (0.027) -0.205* (0.09) -0.009(0.02)
Spatial Error (ζ) -0.186 (0.18) -0.04 (0.16)
Adj R2 0.338 0.286 0.349 0.293
Obs 292 292 292 292
*, **, and *** are 10 per cent, 5 per cent, and 1 per cent signiicance, respectively. Standard errors are in brackets Table 5. Spatial Dependence models
No AIC β (p-value) ρ, ζ (p-value) Convergence
Rate (θ)
1994-2004
1 Spatial error (LM) -1115 -0.06 (0.000) 0.443 (0.0001) 0.006
2 Spatial Lag (LM) -1092.1 -0.06 (0.000) 0.01 (0.67) 0.006
1994-2000