Summary This paper reviews the development of the sto-chastic interception model from the original, single-layer, drop-size-dependent model to the two-layer model that recog-nizes that vegetation canopies are wetted through both the primary impact of raindrops to the top layer of the canopy and secondary impacts from drops falling from the vegetation to lower layers of the canopy.
It is shown that drop volumes of primary raindrops can be calculated from the Marshall-Palmer distribution and drop volumes of secondary drops can be estimated from disdrome-ter measurements of the characdisdrome-teristic volume appropriate to the particular vegetation species. It is recognized that, in addi-tion to the volume-dependent stochastic wetting effect, there is also another drop-size-dependent wetting effect that is related to the kinetic energy of the raindrops, which reduces the maximum storage that can be achieved on the canopy.
The predicted wetting functions for canopies of different density are described and compared with observations made with the use of a rainfall simulator. It is also shown that the species-dependent model parameters can be determined from measurements made with the rainfall simulator. The improved performance of the model compared with conventional inter-ception models is demonstrated for a tropical forest in Sri Lanka. Application of the two-layer model may explain why interception losses from coniferous, fine-leaved forests in the temperate, low-intensity rainfall climate of the uplands of the U.K. are among the highest in the world, whereas interception losses from tropical broad leaved forest in high-intensity rain-fall climates of the tropics are among the lowest.
Keywords: canopy wetting, drop volume, kinetic energy, Mar-shall-Palmer distribution, rainfall simulator.
Introduction
Arguably, the processes controlling the retention and sub-sequent evaporation of water droplets on vegetation, com-monly known as interception, are among the most extensively studied, but most poorly understood, in hydrology. An under-standing of the processes controlling interception is of consid-erable interest to hydrologists because, in wet climates, this
component of the total evaporation can be the dominant term and can explain why evaporative losses from forests can greatly exceed those from grassland (Calder 1990). An under-standing of the processes that determine interception is also relevant to studies of splash-induced erosion (Morgan 1985).
The single-layer stochastic interception model
The importance of drop size in determining interception losses from canopies was first established through experimental stud-ies of the rainfall interception process in the tropical climates of Indonesia and India (Calder et al. 1986, Hall et al. 1992) and by theoretical development of the stochastic interception model (Calder 1986). This model used Poisson probability statistics to describe the manner in which elemental areas of vegetation are wetted by raindrop strikes of different drop size. The model predicts that for storms with the same total rainfall, interception losses will be greater for those with smaller drop sizes (Calder 1986, Calder 1990, Hall et al. 1992). A brief description of this model is given below.
It was proposed that the manner in which vegetation sur-faces are wetted by raindrops is a random process governed by Poisson statistics. If the surface of vegetation is considered to be composed of elemental areas, each of which has the same probability of being struck by raindrops it can be shown that the mean number of drops retained per elemental area of the canopy, n, can be calculated from the mean number of drop strikes per element, m, and a parameter q, defined as the maximum number of drops that could be retained per elemen-tal area of the canopy.
The basic equation of the model gives the mean number of drops retained per element as:
where r is the truncated value of q.
The depth of canopy storage per unit ground area, C (mm), and the depth of rainfall striking the canopy per unit ground area (excluding the free throughfall component), P (mm), are
Rainfall interception and drop size----development and calibration of
the two-layer stochastic interception model
IAN R. CALDER
Institute of Hydrology, Crowmarsh Gifford, Wallingford, Oxfordshire OX10 8BB, U.K.
Received March 2, 1995
related to the model parameters (Table 1) through the relation-ships:
C = nvL, (2)
and
P = mvL, (3)
where v (mm3) is the volume of the raindrops and L is the
number of elemental surfaces per unit ground area (mm−2). The maximum storage capacity can then be defined as:
Cmax = qvL. (4)
If Cmax is invariant and independent of v, which is not a
prerequisite of the stochastic hypothesis, then the drop reten-tion number, q, has a simple inverse relareten-tionship with v, i.e.:
q = Cmax/vL. (5)
Thus, for small drops the drop retention number, q, becomes large and, in the limit, as drop size decreases, q approaches infinity; for this special case the wetting function predicted by
the stochastic model is identical with that implicit in the Rutter interception model (Rutter et al. 1971).
The normalized wetting functions, expressed in terms of the normalized canopy storage, C/Cmax, and normalized rainfall,
P/Cmax, for different values of drop retention number q,
pre-dicted by the stochastic model, are shown in Figure 1.
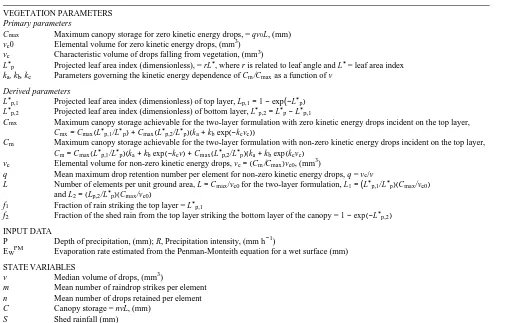
Table 1. Summary of stochastic model parameters, input data and state variables. For the two-layer model the same names apply but a subscript 1 or 2 is used to denote the top or bottom layers for the parameters and state variables Cmax, Cm , C, q, L, L∗p, m, n, v and P.
VEGETATION PARAMETERS Primary parameters
Cmax Maximum canopy storage for zero kinetic energy drops, = qv0L, (mm)
ve0 Elemental volume for zero kinetic energy drops, (mm3)
vc Characteristic volume of drops falling from vegetation, (mm3)
L∗p Projected leaf area index (dimensionless), = rL∗, where r is related to leaf angle and L∗ = leaf area index
ka, kb, kc Parameters governing the kinetic energy dependence of Cm/Cmax as a function of v
Derived parameters
L∗p,1 Projected leaf area index (dimensionless) of top layer, Lp,1= 1 −exp(−L∗p)
L∗p,2 Projected leaf area index (dimensionless) of bottom layer, L∗p,2= L∗p− L∗p,1
Cmx Maximum canopy storage achievable for the two-layer formulation with zero kinetic energy drops incident on the top layer,
Cmx= Cmax(L∗p,1/L∗p)+ Cmax(L∗p,2/L∗p)(ka+ kbexp(−kcvc))
Cm Maximum canopy storage achievable for the two-layer formulation with non-zero kinetic energy drops incident on the top layer,
Cm= Cmax(L∗p,1/L∗p)(ka+ kb exp(−kcv)+ Cmax(L∗p,2/L∗p)(ka+ kb exp(kcvc)
ve Elemental volume for non-zero kinetic energy drops, ve=(Cm/Cmax)ve0, (mm3)
q Mean maximum drop retention number per element for non-zero kinetic energy drops, q = ve/v
L Number of elements per unit ground area, L = Cmax/ve0 for the two-layer formulation, L1=(L∗p,1/L∗p)(Cmax/ve0)
and L2=(Lp,2/L∗p)(Cmax/ve0)
f1 Fraction of rain striking the top layer = L∗p,1
f2 Fraction of the shed rain from the top layer striking the bottom layer of the canopy = 1 − exp(−L∗p,2)
INPUT DATA
P Depth of precipitation, (mm); R, Precipitation intensity, (mm h−1)
EWPM Evaporation rate estimated from the Penman-Monteith equation for a wet surface (mm)
STATE VARIABLES
v Median volume of drops, (mm3)
m Mean number of raindrop strikes per element n Mean number of drops retained per element C Canopy storage = nvL, (mm)
S Shed rainfall (mm)
Figure 1. Normalized wetting functions showing C/Cmax against
nor-malized rainfall P/Cmax, for different values of drop retention number
Evaporation can be incorporated explicitly into the model by redefining m as the effective mean number of raindrop strikes per element. Thus, m has the same effect on canopy storage as the combined effect of the actual number, due to rainfall, and evaporation. The evaporation increment is normally calculated from the Penman-Monteith equation with the surface resis-tance term equated to zero to represent wet canopy surface conditions.
Development of the two-layer stochastic interception model
The two-layer stochastic model (Calder 1995) considers the canopy to be composed of two layers, the top layer receiving primary raindrops and the bottom layer receiving secondary drops falling from the top layer. A brief description of this model is given below.
Dependence of q on drop volume and kinetic energy
Previous applications of the single-layer stochastic model con-sidered q to be fixed for a particular vegetation type and rainfall regime. The two-layer model (Calder 1995) takes into account the dependence of q on three factors: (1) the variation of raindrop volume with rainfall intensity; (2) the dependence of the drop retention number q not only on drop volume but also on drop kinetic energy; and (3) the volumes of drops falling off higher levels of the canopy.
To incorporate the dependence of q on both drop volume and drop kinetic energy within the stochastic interception model, a new model parameter was introduced, specific to the particular vegetation type, termed the maximum elemental volume, ve.
For drops impacting the surface with zero kinetic energy, the maximum elemental volume was defined as:
ve0= qv0, (6)
where subscript 0 denotes zero kinetic energy.
The term Cmax can then be redefined as the maximum
stor-age capacity that is obtained when the canopy is wetted with drops of zero kinetic energy, i.e.:
Cmax= ve0L = qv0L. (7)
Further, a new model parameter, Cm, can be defined as the
maximum storage capacity obtained with non-zero kinetic energy drops:
Cm= veL. (8)
For drops of non-zero kinetic energy, the maximum elemental volume is given by:
ve=(Cm/Cmax)Ve0. (9)
The maximum drop retention number for drops of non-zero kinetic energy, q, can be calculated from
q = ve/v, (10)
that is
q =(Cm/Cmax)ve0/v. (11)
To operate the model for a particular vegetation type requires values for two vegetation specific parameters Cmax (which
defines L), and ve0. Also required is the functional relationship
between Cm /Cmax and v. Preliminary measurements with a
rainfall simulator (Calder et al. 1995), suggest the empirical exponential relationship:
Cm/Cmax= 1 for v < 0.065
Cm/Cmax= 0.5 + 0.73 exp(−5.5v) for v ≥ 0.065. (12)
Estimation of drop volume
Primary drops Marshall-Palmer (1948) established an em-pirical relationship between the volume of raindrops and rain-fall intensity. Following on from this work, Torres and colleagues (Torres et al. 1994) have provided a general formula for raindrop size distribution. With this general formula, and from field observations, they have shown that the median-vol-ume diameter, D0 (cm), of raindrops is related to rainfall
intensity, R (mm h−1), by the equation:
D0=0.087 R0.0228. (13)
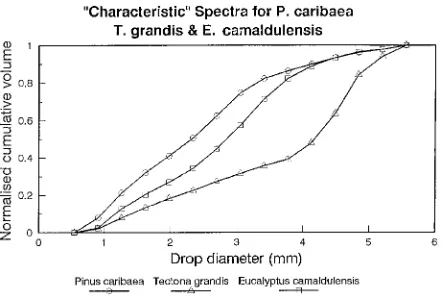
Secondary drops Hall and Calder (1993), from measure-ments made with an optical disdrometer, showed that that the size spectrum of drops falling from tree canopies is charac-teristic of the particular tree species (Figure 2). Secondary drops, falling from the top layer, are therefore considered to be of the characteristic volume vc.
Layer partition
Partitioning of the number of elemental areas between layers can be achieved from a knowledge of the projected leaf area index of the canopy, L∗p. Assuming that leaves are distributed
randomly within the canopy space, the projected leaf area index of the top layer of the canopy, L∗p,1, which receives
incident, vertically falling, primary raindrops is given by Beer’s Law as:
L∗p,1= 1 − exp(−L∗p), (14)
The projected leaf area index of the bottom layer of the canopy, L∗p,2, which receives secondary drops, is given by:
L∗p,2= L∗p− L∗p,1. (15)
Note that, with the above definitions, as the projected leaf area of the canopy increases, the projected leaf area index of the top layer approaches unity, implying that no primary drops fall through the canopy without a strike; the projected leaf area of the bottom layer then approaches that of the total projected leaf area index of the canopy less one. Partitioning of the number of elemental areas per unit ground is assumed to be proportional to these projected leaf area index values.
Rain and shed-rain strike fractions Partitioning of rainfall between the top layer of the canopy and the ground, and partitioning of shed-rain from the top layer, between the bottom layer and the ground, can also be achieved from a knowledge of the projected leaf area index of the two canopy layers, i.e., rainfall striking the top layer of the canopy, P1, is expressed as
a proportion of total rainfall, P:
P1= f1P = L∗p,1P. (16)
The input to the bottom layer of the canopy, P2, resulting from
a depth of water, S, shed from the top layer is given by:
P2= f2S =(1− exp(−L∗p,2))S. (17)
Operation of the two-layer stochastic model
The steps in the operation of the model are essentially the same as those described for the original stochastic model (Calder 1986) except that raindrop volume, v, is now calculated from rainfall intensity, and q for the top layer is calculated from the elemental volume, ve, divided by v. For the bottom layer, q is
calculated from ve divided by vc. In the two-layer model,
evaporation is considered to occur only from the top layer while it retains water. When the top layer is completely dry, evaporation is considered to deplete the bottom layer. Further details of the operation of the model are given in Calder 1996.
Predicted wetting functions
The manner in which the incorporation of the two-layer formu-lation alters the predicted wetting functions can best be under-stood by comparing wetting functions obtained with varying
values of projected leaf area index, L∗p, while holding the other
canopy parameters constant.
The wetting functions obtained with the two layer stochastic model with a projected leaf area index, L∗p = 0.45, an elemental
volume, ve, of 4 mm3, a characteristic volume, vc, of 11.5 mm3
and incorporating the q dependence on kinetic energy speci-fied by ka = 0.5, kb = 0.73, kc = 5.5, are shown in Figure 3 for
different values of rainfall intensity, (based on the Torres rela-tionship between drop size and rainfall intensity).
The wetting functions obtained with similar canopy parame-ter values but with drop volumes appropriate to those used with a rainfall simulator on studies of Eucalyptus camaldulensis are shown in Figure 4. The matching of predicted wetting
func-Figure 4. Normalized wetting functions, determined on September 27 and October 30, 1993, for Eucalyptus camaldulensis, showing C/Cmx against normalized depth of water applied P1/Cmx, for different sizes
of drops obtained with a fine spray (Fs), coarse spray (Cs), and the dripper system (D) with median volumes of 0.065, 0.27 and 73 mm3, respectively. Also shown, as solid lines, are the wetting functions predicted by the stochastic model for these drop sizes with elemental volume, ve = 4 mm3, vc = 11.5 mm3, and L∗p = 0.598.
Figure 3. Normalized wetting functions showing C/Cmx against
nor-malized rainfall P1/Cmx, predicted by the two-layer stochastic model
for different rainfall intensities with L∗p = 0.45, depicting a sparse
tions with those observed with the rainfall simulator provides a means of determining the elemental volume appropriate to a particular species.
For forests with even greater L∗p, the dependence of the
wetting function on the size of raindrops will be further re-duced. The wetting response will be determined principally by the volume and kinetic energy of the ‘‘characteristic’’ drops. Figure 5 shows the type of wetting response that might be expected for a forest with a dense canopy, such as a humid tropical rainforest with an L∗p = 2.7. For dense canopies, the
wetting response converges to that expected with a single-layer formulation with a drop retention number equal to the ratio of the elemental to the characteristic volume, i.e., q = ve/vc. It is
interesting to note that the q value obtained for tropical rain-forest in Indonesia (Calder et al. 1986) by means of the single-layer formulation of the stochastic model indicated a ve/vc ratio
that was less than unity.
Implementation and assessment of the two-layer model The two-layer stochastic model has been implemented and run with climate and interception data collected in Sri Lanka for tropical forest (Hall and Calder 1995). Comparison of the performance of the two-layer stochastic model with that of the Rutter model is demonstrated by Figure 6. Although both models relied on parameter optimization, the Rutter model is clearly unable to reproduce the onset of net rainfall at the beginning of the storm.
Discussion and conclusions
The two-layer stochastic model allows predictions, based on Poisson probability statistics, of the rate at which vegetation canopies are wetted in relation to drop size. Studies carried out with the rainfall simulator have verified the predictions made
by the stochastic wetting hypothesis with respect to the rate at which canopies wet in relation to drop size. These studies have also established that the maximum storage value is not a constant, as has been assumed in previous interception studies, but that it is strongly dependent on drop size through an assumed kinetic energy dependence.
Application of the model to a real situation, using intercep-tion data collected from a site in Sri Lanka, has shown that the model is better able to describe the initial wetting-up phase of the storm than conventional interception models that do not incorporate a drop size dependence. The two-layer stochastic model may provide insights into some of the reasons why forest interception varies so much worldwide, and may help to explain why interception losses from coniferous temperate forests are so much higher than those from tropical forests.
The model shows that canopy wetting will be achieved most rapidly and maximum canopy storage will be highest, leading to high interception losses overall, when both raindrop volume is small and the characteristic volume of drops draining from the canopy is also small. These conditions apply for coniferous forests in the low-intensity, small rain drop size climate of the uplands of the U.K. By contrast, when both rain drop volumes and characteristic volumes are large, canopy wetting will be achieved much more slowly and interception losses are likely Figure 5. Normalized wetting functions showing C/Cmx against
nor-malized rainfall P1/Cmx, predicted by the two-layer stochastic model
for different rainfall intensities with L∗p = 2.7, depicting a dense
canopy, vc = 11.5 mm3, ve = 4 mm3, ka = 0.5, kb = 0.73, and kc= 5.5.
to be much reduced. This situation is typified by tropical rainforest experiencing high intensity convective storms of large drop size.
References
Calder, I.R. 1986. A stochastic model of rainfall interception. J. Hy-drol. 89:65--71.
Calder, I.R. 1990. Evaporation in the uplands. John Wiley Publishers, New York, 148 p.
Calder, I.R. 1996. Dependence of rainfall interception on drop size: 1. Development of the Two-Layer Stochastic Model. J. Hydrol. In press.
Calder, I.R., I.R. Wright and D. Murdiyarso. 1986. A study of evapo-ration from tropical rainforest----West Java, J. Hydrol. 89:13--33. Calder, I.R., R.L. Hall, P.T.W. Rosier, H.G. Bastable and K.T.
Pras-sana. 1996. Dependence of rainfall interception on drop size 2. Experimental determination of the wetting functions and stochastic model parameters for five tropical tree species. J. Hydrol. In press. Hall, R.L., I.R. Calder, P.T.W. Rosier, M.H. Swaminath and J. Mumtaz. 1992. Measurements and modelling of interception loss in eucalypt plantations in southern India. In Growth and Water Use of Forest Plantations, Bangalore. Eds. I.R. Calder, R.L. Hall and P.G. Adlard. John Wiley Publishers, Chichester, England, pp 167--179.
Hall, R.L. and I.R. Calder. 1993. Drop size modification by forest canopies----measurements using a disdrometer, J. Geophys. Res. 90:465--470.
Hall, R.L. and I.R. Calder. 1995. Modelling interception from Kan-dyan forest garden; dependence on rainfall intensity and drop size. In Proc. Phase I Review Seminar Workshop of the ODA Forestry Programme. Eds. J. Burley, H.P.M. Gunasena and J. Vincent. UP-OFI Link Project, University of Peradeniya, Sri Lanka. In press. Marshall, J.S. and W.M. Palmer. 1948. The distribution of raindrops
with size. J. Meteorol. 5:165--166.
Morgan, R.P.C. 1985. Establishment of plant cover parameters for modelling splash detachment. In Soil Erosion and Conservation. Eds. S.A. El-Swaify, W.C. Moldenhauer and A. Lo. Soil Conserva-tion Society of America, pp 377--383.
Rutter, A.J., K.A. Kershaw, P.C. Robins and A.J. Morton. 1971. A predictive model of rainfall interception in forests. I. Derivation of the model from observations in a plantation of Corsican pine. Agric. Meteorol. 9:367--384.