NATIONAL MEDICAL CARE STATISTICS 2010 NATIONAL MEDICAL CARE STATISTICS 2010
National Medical Care Statistics 2010
October 2012
© Ministry of Health Malaysia
Published by:
The National Healthcare Statistics Initiative (NHSI) Clinical Research Centre,
Ministry of Health 3rd Floor, MMA House
124, Jalan Pahang 53000 Kuala Lumpur Malaysia
Tel. : (603) 40439300 / 400 Fax : (603) 40439500 e-mail : [email protected]
Website : http://www.crc.gov.my/nhsi
This report is copyrighted. Reproduction and dissemination of this report in part or in whole for research, educational or other non-commercial purposes are authorised without any prior written permission from the copyright holders provided the source is fully acknowledged. Suggested citation is Clinical Research Centre. National Medical Care Statistics 2010. Kuala Lumpur 2012.
Funding:
The National Healthcare Statistics Initiative is funded by a grant from the Ministry of Health Malaysia (MRG Grant No. NMRR-09-842-4718)
Please note that there is the potential for minor corrections of data in this report. Please check the online version at www.crc.gov.my for any amendments
ISSN 2289-1811
PREFACE
With over 800 Klinik Kesihatan (public health clinics) and 5,000 private primary care clinics in Malaysia, primary care serves as the first point of contact for many of the health needs of Malaysia’s estimated 28 million population. Despite its importance in community healthcare, there has been little information available on the primary care setting. This vacuum poses a great challenge to the coordination of health services, collaboration between public and private sector, policy planning and implementation.
It is only with the successful launch of the National Healthcare Establishment and Workforce Survey (NHEWS) Primary Care report in 2009, that we now have some credible demographic data of primary care facilities available in the country. Two reports (Year 2009 and 2010) derived from the annual survey have also been published. The next step forward would be to look at the data on disease burden and treatment modalities used in the primary care setting. It is with this objective that the National Medical Care Survey (NMCS) was carried out to fill the information gap as it explores the morbidity pattern and treatment being given in the primary care setting.
Thus, I am convinced that this maiden report will be a very useful reference for many stakeholders of the healthcare sector, including the general public, practitioners, policy makers as well as the industry. In addition, I hope that this report will create more awareness on the importance of primary care in safeguarding the health of the population and that this would later translate into more support for the development of primary care in Malaysia.
Last but not least, it is my pleasure to convey my appreciation to all the participants of the survey and the staff from Healthcare Statistics Unit, Clinical Research Centre who have contributed towards the successful completion of the first National Medical Care Statistics (NMCS) 2010. I sincerely hope that the primary care practitioners, particularly those from the private sector, would continue to render us your support in the coming NMCS survey.
Thank you.
………
Dato’ Sri Dr. Hasan Abdul Rahman
Table 1.1 : Healthcare surveys under the NHSI . . . . Table 3.1 : Number of respondent public and private clinics . . . . Table 4.1 : Characteristic of encounters by age group in NMCS 2010 . . . . Table 4.2 : Characteristic of encounters by sector, sex, nationality and ethnicity in NMCS 2010 . . . . Table 4.3 : Characteristic of encounters by source of payment in NMCS 2010 . . . . Table 5.1 : Number of patients’ reasons for encounter in NMCS 2010 . . . . Table 5.2 : Reasons for encounter by ICPC-2 chapter in NMCS 2010, in descending order . . . . Table 5.3 : Top 50 reasons for encounter in NMCS 2010, in descending order . . . . Table 6.1 : Distribution of prescribed medications by ATC level 1 in NMCS 2010, in descending order . . . . Table 6.2 : Distribution of prescribed medications by ATC level 2 in NMCS 2010, in descending order . . . . Table 6.3 : Top 100 most prescribed medications in NMCS 2010, in descending order . . . . Table 6.4 : Follow up proposed by primary care practitioners in NMCS 2010 . . . .
1 7 10 11 11 13 14 15 18 19 22 26
iv NATIONAL MEDICAL CARE STATISTICS 2010
ACKNOWLEDGEMENTS
The National Healthcare Statistics Initiative team would like to thank the Director General of Health Malaysia for his continuous support towards this survey and for permission to publish this report.
Also, our sincere appreciation to the following for their participation, assistance, support and contribution:
• Deputy Director General of Health (Research and Technical Support), Ministry of Health (MOH)
• Deputy Director General of Health (Medical), MOH
• Deputy Director General of Health (Public Health), MOH
• Director, Planning and Development Division, MOH
• Director, Family Health Development Division, MOH
• Director, Medical Practice Division, MOH
• Director, Clinical Research Centre, National Institutes of Health, MOH
• Director, Health Informatics Centre, MOH
• State level Private Medical Practice Control Unit (Unit Kawalan Amalan Perubatan Swasta or UKAPS)
• All participating public and private clinics and other institutions that provided data to the National Medical Care Survey (NMCS)
• Malaysian Medical Council, Malaysian Medical Association, Family Medicine Specialists Association of Malaysia, National Specialist Register, Academy of Medicine Malaysia
• All who have supported or contributed to the success of the NMCS and this report
Thank you.
National Healthcare Statistics Initiative (NHSI)
NATIONAL MEDICAL CARE SURVEY 2010 PROJECT TEAM
PRINCIPAL INVESTIGATOR DATUK DR NOOR HISHAM ABDULLAH
PRINCIPAL CO-INVESTIGATORS DR. SHEAMINI SIVASAMPU
DR. GOH PIK PIN
CO-INVESTIGATORS DR. NOORAINI BABA
DR. MD KHADZIR SHEIKH AHMAD
PROJECT LIAISON OFFICERS DR AFIDAH ALI
DR. ZAKIAH MOHD SAID
PROJECT MANAGERS
DR. NADIA FAREEDA GOWDH (JULY 2009 – JANUARY 2011) DR. SHARON CHONG (JANUARY 2011 – AUGUST 2011) MR. LIM KA KEAT (SEPTEMBER 2011 – SEPTEMBER 2012)
SURVEY COORDINATOR LEON HO LIP MAN
RESEARCH OFFICERS MR. SHANTHA KUMAR CHANDRASEKARAN
MR. POOVANESVA RAO YANG KETTER RAHMAN
DATA ANALYSTS
MR. LIM KA KEAT
MR. SHANTHA KUMAR CHANDRASEKARAN MS. NORAZIDA BT AB RAHMAN
vi NATIONAL MEDICAL CARE STATISTICS 2010
ABBREVIATIONS
ATC WHO Anatomical Therapeutic Chemical Classification system
CRC Clinical Research Centre
CKAPS Cawangan Kawalan Amalan Perubatan Swasta
DG Director General of Health, Ministry of Health, Malaysia
FMS Family Medicine Specialist
GP General practice or practitioner
ICPC International Classification of Primary Care
KK Klinik Kesihatan
MOH Ministry of Health, Malaysia
MREC Medical Research and Ethics Committee, Ministry of Health Malaysia
NHEWS National Healthcare Establishment & Workforce Survey (Primary Care)
NHSI National Healthcare Statistics Initiative
NIH National Institutes of Health
NMUS National Medicine Use Survey
CHAPTER 1
|
INTRODUCTION
1.1 ABOUT NATIONAL HEALTHCARE STATISTICS INITIATIVE (NHSI)
The National Healthcare Statistics Initiative (NHSI) is a family of surveys which were conducted with the aim to support evidence-based health policy making and research in Malaysia. Owing to the support of various stakeholders and recognition of the usefulness of data in bridging the gap between research and policy, the NHSI has grown in credibility and gained greater participation over the past 4 years. Annual reports are being published for most of the surveys under the NHSI project based on the respective findings. The NHSI family of healthcare surveys, existing data sources and survey design are summarised below.
NO. NHSI SURVEYS DESCRIPTION OF SURVEYS COMPLEMENT DATA SOURCES
1. (a) NHEWS Hospital National Healthcare Establishments and Workforce Survey for hospitals
• Captures data on healthcare services provision, facilities available and workforce (doctors and allied health professionals) within hospitals;
• Includes both public and private hospitals in the country.
Healthcare facility administrative and registration database
Health professional registers
(b) NHEWS Primary Care National Healthcare Establishments and Workforce Survey for primary care clinics
• Captures data on healthcare services provision, facilities available and workforce (doctors and allied health professionals) within clinics;
• Includes both public and private primary care clinics in the country.
Healthcare facility administrative and registration database
Health professional registers
2. NMUS National Medicine Use Survey
• Captures data on drug utilisation pattern from hospitals (procurement records), primary care
• Captures data on available medical technology among registered healthcare establishments in the country
• Used to be a standalone survey. Now incorporated within the National Healthcare Establishment & Workforce Survey.
4. NMCS National Medical Care Survey
• Captures data on morbidity pattern seen in primary care setting and the process of care being provided.
• The prescription data contributes to the NMUS survey
Routine health service statistics from Health Informatics Centre MOH, Department of Statistics and various patient registers
Population mortality data from Department of Statistics.
2 NATIONAL MEDICAL CARE STATISTICS 2010
1.2 ABOUT NATIONAL MEDICAL CARE SURVEY (NMCS)
According to the American Association of Family Physicians1, primary care is defined as the care provided by physicians specifically trained for and
skilled in comprehensive first contact and continuing care for patients irrespective of the problem origin (biological, behavioral or social) and diagnosis. In short, primary care is the front line of a healthcare system, making healthcare services accessible to general public.
Malaysia has more than 800 government primary care clinics (termed “Klinik Kesihatan”, the vernacular for Health Clinic) and 5,000 private primary care clinics (commonly known as GP clinics) nationwide. Yet, little is known about the structure of the primary care setting, the morbidity pattern seen by primary care practitioners and the process of care being provided. Such information is crucial for the planning and development of the primary care sector in view of the increasing prevalence of non-communicable diseases.
Therefore, to provide a clearer picture of the primary care system in the country the National Medical Care Survey (NMCS) with a focus on processes and delivery of care was launched in 2010 to complement the National Healthcare Establishments and Workforce Survey (NHEWS) Primary Care that focussed on the structure (establishment and workforce) of primary care.
1.3 OBJECTIVES
General Objectives
The NMCS 2010 aimed:
1. To collect reliable and valid data on the Malaysian (public and private) primary care setting
2. To assess patient characteristics and morbidity patterns in health service activities
3. To provide accurate and timely data on Malaysian primary care setting to various stakeholders including government bodies, primary care practitioners, consumers, researchers and the pharmaceutical industry; and
4. To establish a database of doctor/patient encounters in Malaysian primary care setting
Specific Objectives
The NMCS 2010 specifically collected information on clinical activities in the Malaysian primary care setting, including:
• The characteristics of patients
• Reasons for encounter and additional information such as:
- Pharmacological treatment prescribed, including the dose and frequency - Follow ups in primary care and referrals to secondary or tertiary care
Reference
1. American Association of Family Physicians (AAFP). Primary Care. http://www.aafp.org/online/en/home/policy/policies/p/primarycare.html#Parsys0001
CHAPTER 2
|
METHODOLOGY
2.1 SURVEY TOOL
A standard questionnaire specifically designed for the survey (Appendix 2) was used. The survey form was self-administered by the participating doctors. Variables studied were as follows:
CATEGORIES OF VARIABLES VARIABLES CAPTURED IN SURVEY
Patient Demography Age, gender, ethnicity, nationality
Major reason(s) for visit/Diagnosis Acute, chronic illnesses, preventive care
Source of payment Out-of-pocket, private insurance, Ministry of Health subsidy, private managed care organisations
Drugs prescribed Name, strength, dosage, route, frequency, duration
Visit disposition No follow-up planned, return at specified time, referral
2.2 SAMPLING FRAME & RECRUITMENT STRATEGY
Based on responses from private doctors for the prescription survey in previous National Medicine Use Survey (NMUS)1, the total number of
patients seen per day by a general practitioner was estimated to be 30, with an average of 3 drugs per patient. The prescription survey under the NMUS was a 7-day survey. In contrast, the NMCS strategy was to shorten data collection to 1 day per clinic and to recruit a higher number of clinics. This approach was taken in order to reduce workload in clinics and to increase the response rate.
For administrative convenience, the clinics were grouped according to sectors, with each group being approached and briefed separately.
Private Primary Care Clinics
All private medical clinics registered with the Private Medical Practice Division of the Ministry of Health Malaysia (often referred to as the Cawangan
Kawalan Amalan Perubatan Swasta [CKAPS]) were eligible to be included in the sampling frame of the survey. This sampling frame included both
private primary care clinics as well as private specialist clinics because the registration with Ministry of Health did not differentiate between the two. Briefings were organised at state-level for the convenience of clinics located in each state. Clinics that were represented during the National Healthcare Statistics Initiative study briefing were also recruited. Participating clinics were given survey dates and forms. Below is the list of briefing dates for private primary care clinics in all states.
Methodolog
y
4 NATIONAL MEDICAL CARE STATISTICS 2010
NO DATE LOCATION TARGETED PARTICIPATION
1 5 October 2009 Sungai Buloh, Selangor Clinics from Selangor 2 6 October 2009 Sungai Buloh, Selangor Clinics from WP Kuala Lumpur
3 7 October 2009 Serdang, Selangor Clinics from Selangor
4 9 October 2009 Kuala Terengganu Clinics from Terengganu
5 11 October 2009 Kuantan, Pahang Clinics from Pahang
6 11 October 2009 Johor Bharu, Johor Clinics from Johor
7 20 October 2009 Georgetown, Pulau Pinang Clinics from Pulau Pinang 8 24 October 2009 Alor Setar, Kedah Clinics from Kedah & Perlis
9 25 October 2009 Ipoh, Perak Clinics from Perak
10 30 October 2009 Kota Bharu. Kelantan Clinics from Kelantan
11 31 October 2009 Kota Kinabalu, Sabah Clinics from Sabah
12 31 October 2009 Kuching, Sarawak Clinics from Sarawak
13 1 November 2009 Kuching, Sarawak Clinics from Sarawak
14 8 November 2009 Georgetown, Pulau Pinang Clinics from Pulau Pinang
15 14 November 2009 Melaka Clinics from Melaka
16 21 November 2009 Seremban, Negeri Sembilan Clinics from Negeri Sembilan
17 22 November 2009 Ipoh, Perak Clinics from Perak
Public Primary Care Clinics
The full list of 808 Klinik Kesihatans (KKs) was obtained from the Family Health Development Division and out of this, 150 KKs were selected through stratified sampling to ensure representation of each state. These 150 clinics were notified and provided the relevant documents. Below is the list of briefing dates for public primary care clinics in all states.
NO DATE LOCATION TARGETED PARTICIPATION
1 25 January 2010 Ipoh, Perak KKs in Perak
2 3 February 2010 Alor Setar, Kedah KKs in Kedah and Perlis
3 4 February 2010 Kota Bharu, Kelantan KKs in Kelantan
4 5 February 2010 Kuantan, Pahang KKs in Pahang
5 8 February 2010 Johor Bharu, Johor KKs in Johor
6 10 February 2010 Georgetown, Pulau Pinang KKs in Pulau Pinang
7 10 February 2010 Kuching, Sarawak KKs in Sarawak
8 12 February 2010 Kota Kinabalu, Sabah KKs in Terengganu
9 12 February 2010 Seremban, Negeri Sembilan KKs in Negeri Sembilan
10 1 March 2010 Kuala Terengganu KKs KKs in Terengganu
2.3 STUDY PERIOD
The study period was from 1/12/09 – 30/4/10 inclusive of 1st Dec and 30th April. Every day within this period was included plus weekends and
public holidays. A total of 151 dates were available.
Survey Date
Each recruited clinic was given a specific date on a first-come-first-serve basis from a list of 1,000 randomly arranged dates within the study period. The dates were assigned during the study briefings. For clinics that were unrepresented during the briefings, the forms were sent by post and the next available dates were assigned from the same list of 1,000 dates.
Clinics that were unable to conduct the survey on the given date were advised to do so on the following available date when the clinic was operational. However, the clinics were advised to inform the research team prior to the change of date.
2.4 DATA COLLECTION
General
Reminders were given by telephone to all clinics approximately 1 week prior to the survey date. All clinics were given the option to respond to the survey either by paper submission or online through a specially designed web-based application. For the latter, a unique username and password to access this system was given to each clinic. For clinics choosing to respond on paper, they were given 2 weeks to return the forms after the survey date. For all clinics (public and private) involved in this study, a public notice was provided that was to be displayed in an area where it can be viewed by all patients. This notice served to inform patients of the clinic’s participation in the ongoing survey and that any patient had the right to opt-out if they did not wish to be part of the survey.
Private Primary Care Clinics
Private clinics were asked to record all patient encounters seen in the clinic on the survey day.
Public Primary Care Clinic
As the KKs varied widely in patient load, a patient sampling strategy based on the Malaysian Identity Card (MyKad) numbers was devised to select patient encounters for recording in order not to overburden the clinics. MyKad is the compulsory identity document for Malaysian citizens aged 12 and above. For large clinics with more than 100 expected attendances per day, visits by patients with MyKad numbers ending with the digits ‘1’ and ‘6’ were recruited. For clinics with an expected number of attendances ranging between 50 to 100, visits by patients with MyKad numbers ending in ’0’, ’2’, ’4’, ’5’, ’7’and ’9’ were recruited. For clinics expecting 50 or less attendances per day, all patient visits on that day were included.
2.5 DATA ENTRY & DATA CLEANING
Data entry for all paper forms received was done inhouse with random checks performed to ensure data entry quality. Improperly conducted surveys (wrong dates, not according to protocol) were excluded.
Data cleaning was conducted during the data entry process and continued during data analysis. Data range checks and consistency checks were built into the data entry module and the age variable was auto-calculated based on the date of birth to reduce error in manual calculation.
2.6 IDENTIFICATION OF PRIVATE PRIMARY CARE CLINICS
At the outset of the study, both private primary care and specialist clinics were included in the survey due to limitations of the sampling frame. It should be pointed out that, in a concurrent survey under NHSI, namely the NHEWS Primary Care, all participating clinics were required to self-report whether they were primary care providers or specialists. However, based on the details in this pooled data, the respondents were later divided into primary care clinics and specialist clinics. Only data from private primary care clinics were analysed and presented in this report. The issue of separating data did not arise for public clinics as all KKs provided only primary care services. Methodolog
y
6 NATIONAL MEDICAL CARE STATISTICS 2010
2.7 DATA CODING
The reasons for encounter were coded according to the International Classification of Primary Care Second Edition (ICPC-2) codes2 whereas the
prescription drugs were coded according to WHO Anatomical Therapeutic Chemical (ATC) Classification system.3 The Clinical Research Centre
obtained a 2-year free license for the usage of ICPC-2 codes in the Malaysian NHSI project starting 22 February 2011 from the World Organization of Family Doctors (WONCA). WONCA is made up of national colleges, academies or organisations concerned with the academic aspects of general family practice.4 The Anatomical Therapeutic Chemical (ATC) license was purchased from the WHO Collaborating Centre for Drug Statistics Methodology.3
2.8 DATA ANALYSIS
This report is primarily descriptive. Therefore, no test of significance has been presented. Analysis was done using STATA version 11.1 and the confidence intervals for rate were calculated using Open Epi Calculator Version 7.5.115. The encounter was the primary unit of inference. Encounters with no reasons for encounter and no drugs recorded were not analysed.
Proportions with 95% confidence intervals were used to describe the distribution of an event that can occur only once at a consultation (e.g. patient’s age and mode of payment). The proportions may not always add to exactly 100% due to rounding off. Meanwhile, for an event that can happen more than once in a consultation (e.g. reasons for encounter or medications), data was reported as rates per 100 encounters.
Data was reported as per collected. No weightage was applied to extrapolate the data to national level.
2.9 LIMITATIONS OF THE STUDY
1. The survey is a cross sectional study. Therefore, no conclusion can be derived, neither in terms of long term management of chronic diseases nor in terms of disease episodes in primary care setting.
2. The survey is self-administered by participating doctors and therefore accuracy of data depends largely on the accuracy of recording and interpretation. This might not necessarily reflect the actual practice.
3. The survey is encounter-based. If the same patient visits one clinic and then goes to another clinic for an unrelated reason during the same survey day, it will be considered as two encounters.
4. Morbidity patterns observed in the survey collectively only reflected those cases managed in a primary care setting but not that of the incidence or prevalence of diseases in the community.
5. The morbidity patterns reflected only those managed during the recorded encounters. Incidence of co-morbidity in the same patient that was not treated at the encounter would not have been recorded.
6. Prescription data in the survey included only those provided at the recorded encounter. The presence of a drug in a prescription did not necessarily mean that the patient was not already given the drug in a previous encounter. Similarly, the absence of a drug did not necessarily indicate that the patient will not be given it in a future encounter.
Reference
1. Pharmaceutical Services Division and Clinical Research Centre, Ministry of Health Malaysia. Malaysian Statistics on Medicine 2007. Kuala Lumpur 2010
2. Wonca International Classification Committee (WICC). International Classification of Primary Care – 2nd Edition (ICPC-2 English). Available at http://archive.
globalfamilydoctor.com/wicc/pagers/english.pdf. Accessed January 2012.
3. WHO Collaborating Centre for Drug Statistics Methodology. Guidelines for ATC classification and DDD assignment 2011. Oslo, 2010.
4. Global Health Workforce Alliance. WONCA – World Organization of Family Doctors. Available at http://www.who.int/workforcealliance/members_partners/member_list/
wonca/en/index.html. Accessed October 2012.
5. Emory Rollins School of Public Health. 95% Confidence Interval for a Rate version 7.5.11. Available at http://www.sph.emory.edu/~cdckms/exact-rate.html
CHAPTER 3
|
THE RESPONSE RATE
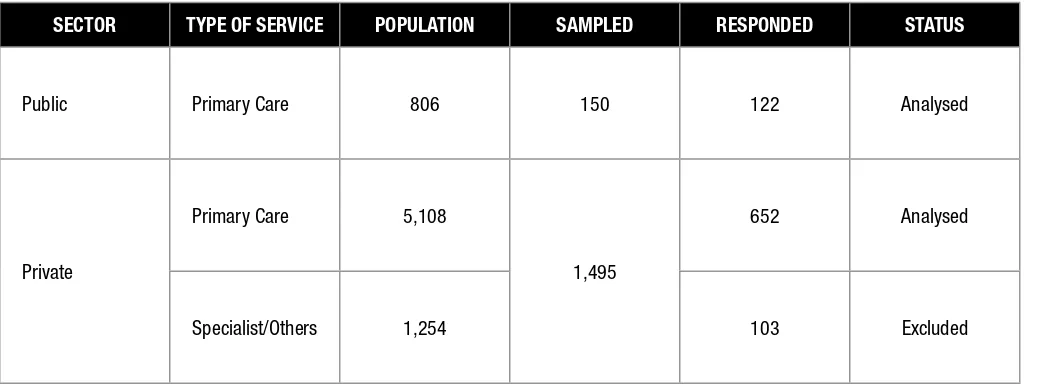
This chapter examines the survey samples and response rates. As described in Chapter 2, public clinics were selected through stratified sampling to ensure representation of each state. Out of 150 public clinics sampled, 122 responded (response rate 81.3%). Meanwhile, 755 out of 1,495 private clinics responded (response rate 50.5%). However, some of these clinics were subsequently found to be specialist or other types such as aesthetic clinics (Table 3.1) Data from such clinics were removed from analysis.
The full list of the public and private primary care clinics which responded to the survey is available in Appendix 1.
Table 3.1: Number of respondent public and private clinics
SECTOR TYPE OF SERVICE POPULATION SAMPLED RESPONDED STATUS
Public Primary Care 806 150 122 Analysed
Private
Primary Care 5,108
1,495
652 Analysed
Specialist/Others 1,254 103 Excluded
A total of 21,914 encounters were collected from 122 public and 652 private primary care clinics. However, 46 encounters were excluded as these neither contained data on reasons for encounter nor the medications prescribed. Total analysable encounters were 21,868; 4,173 from public (average 34.2 encounters per clinic) and 17,695 from private (average 27.2 encounters per clinic). The demographic characteristics of these encounters are shown in Chapter 4.
The Response Ra
te
CHAPTER 4
|
THE ENCOUNTERS
This chapter describes the demographic pattern of patient encounters recorded in NMCS 2010.
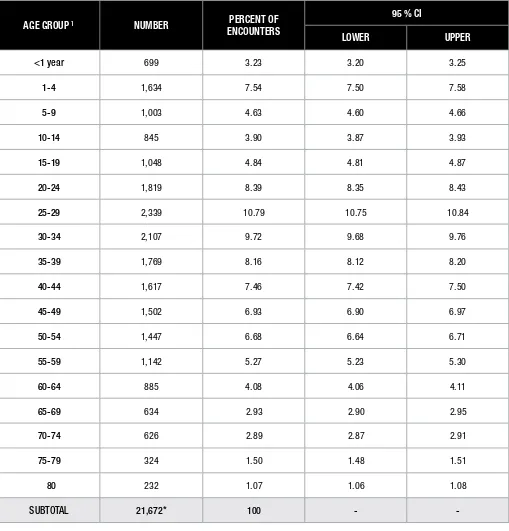
Table 4.1 shows distribution of encounters in NMCS 2010 by age groups. The age range was reported in accordance with the Department of Statistics population data1 and National Health and Morbidity Survey III.2 In general, young adults made up the bulk of encounters. The age group
25-29 (10.8%) had the highest proportion of encounters, followed by age groups 30-34 (9.7%) and 20-24 (8.2%). Among children and youth aged 19 years and below, the encounters were highest for children aged 1 – 4 years (7.5% of total encounters) and tended to decrease with increasing age. On the other hand, the geriatric population (60 years old and above) only contributed 12.5% of the total encounters.
On average, for the purpose of this study, each clinic provided data for about 30 encounters. As there were 652 private clinics versus 122 public clinics responding to the survey (Chapter 2), the majority of encounters (80.9%) appeared to be from private clinics. Nevertheless, this cannot be interpreted to mean that private clinics were seeing more patients than the public clinics. Also, only slight differences were observed between the sexes, with female patients accounting for 51.3% encounters as compared to male patients which were about 48.7%. (Table 4.2)
The majority of patients presenting to primary care clinics were Malaysians with only 6.8% of patients being foreigners. This finding is in proportion to the estimated number of foreigners in the country (8.2%)1. When the ethnicity for Malaysians were analysed (Table 4.2), the distribution were
also found to be similar to that reported by the Department of Statistics.1 (Malay and Indigenous (Bumiputera) 67.4%; Chinese 24.6%; Indians
7.3%; and others 0.7%)
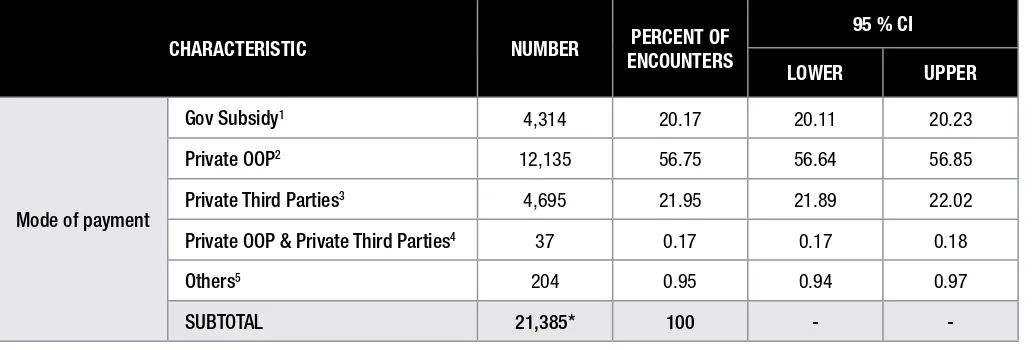
The most common mode of payment for private primary care services in NMCS 2010 was out-of-pocket payment (56.8%), followed by payment through private third parties (22.0%). Private third parties refer to employers, panel companies (companies which appoint private clinics to look after their workers who fall sick), managed care organizations (MCOs) and private insurance companies. Meanwhile, all encounters presented to public clinics were considered under government subsidy. Some visits to private clinics were reported to be subsidised by government. (Table 4.3)
Reference
1. Department of Statistics. Population And Housing Census, Malaysia 2010 (2010 Census). http://www.statistics.gov.my/portal/index.php?option=com_content&view
=article&id=1215&lang=en Accessed June 2012. Last update 05 June 2012.
2. Institute of Public Health. National Health and Morbidity Survey III 2006.
The Encounters
10 NATIONAL MEDICAL CARE STATISTICS 2010
Table 4.1: Characteristic of encounters by age group in NMCS 2010
AGE GROUP 1 NUMBER PERCENT OF
ENCOUNTERS
95 % CI
LOWER UPPER
<1 year 699 3.23 3.20 3.25
1-4 1,634 7.54 7.50 7.58
5-9 1,003 4.63 4.60 4.66
10-14 845 3.90 3.87 3.93
15-19 1,048 4.84 4.81 4.87
20-24 1,819 8.39 8.35 8.43
25-29 2,339 10.79 10.75 10.84
30-34 2,107 9.72 9.68 9.76
35-39 1,769 8.16 8.12 8.20
40-44 1,617 7.46 7.42 7.50
45-49 1,502 6.93 6.90 6.97
50-54 1,447 6.68 6.64 6.71
55-59 1,142 5.27 5.23 5.30
60-64 885 4.08 4.06 4.11
65-69 634 2.93 2.90 2.95
70-74 626 2.89 2.87 2.91
75-79 324 1.50 1.48 1.51
80 232 1.07 1.06 1.08
SUBTOTAL 21,672* 100 -
-* indicates presence of missing data
Table 4.2: Characteristic of encounters by sector, sex, nationality and ethnicity in NMCS 2010
1. Only data for Malaysians (n = 20,381) are included in the analysis for ethnicity. 2. Includes Sikhs/Punjabis
3. Includes Eurasian, mixed parentage, others but not specified, etc.
Table 4.3: Characteristic of encounters by source of payment in NMCS 2010
CHARACTERISTIC NUMBER PERCENT OF ENCOUNTERS
95 % CI
LOWER UPPER
Mode of payment
Gov Subsidy1 4,314 20.17 20.11 20.23
Private OOP2 12,135 56.75 56.64 56.85
Private Third Parties3 4,695 21.95 21.89 22.02
Private OOP & Private Third Parties4 37 0.17 0.17 0.18
Others5 204 0.95 0.94 0.97
SUBTOTAL 21,385* 100 -
-* indicates presence of missing data
1. Includes all encounters presented to government clinics and other government subsidy for visits to private clinics 2. Out of pocket (OOP) payment
3. Includes payment under insurance, managed-care organisations and employer (panel) 4. Refers to mixed mode of payment through OOP and private third parties
5. Includes free and others but not specified.
The Encounters
CHAPTER 5
|
THE REASONS FOR ENCOUNTER
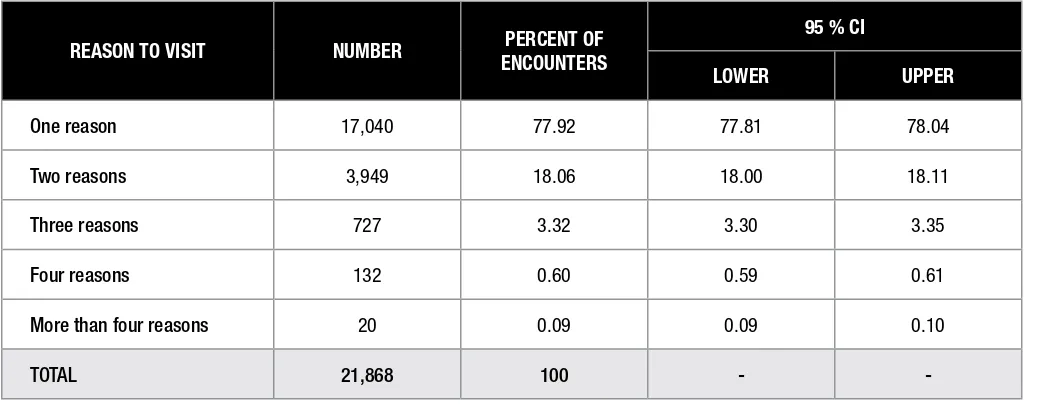
The reasons for encounter (RFE) reflect the motivation for the patient to seek medical care and this was reported in the questionnaire by the examining doctor as a symptom, a diagnosis or a procedure. All RFEs were coded according to the ICPC-2 code. A total of 27, 748 RFEs were captured in NMCS 2010, resulting in an average of 1.27 RFEs per encounter. As shown in Table 5.1, the majority of encounters (77.9%) visited primary care for only one RFE. About 18% of the encounters were for two RFEs whereas the remainder had at least 3 RFEs.
Table 5.2 illustrates the reasons for encounter by ICPC-2 chapters based on body systems. General and unspecified problems refer to symptoms such as chills, fever, general weakness or diseases which affect multiple body systems such as tuberculosis and malaria.1 Most patients visited
primary care for respiratory problems (35.1 per 100 encounters), followed by musculoskeletal (16.5 per 100 encounters), general and unspecified (15.3 per 100 encounters), digestive (14.3 per 100 encounters), skin problems (11.4 per 100 encounters), cardiovascular (9.2 per 100 encounters), endocrine (7.6 per 100 encounters), while 4.3 per 100 encounters were for pregnancy, child bearing and family planning. Collectively, these problems made up nearly 90% of total RFEs.
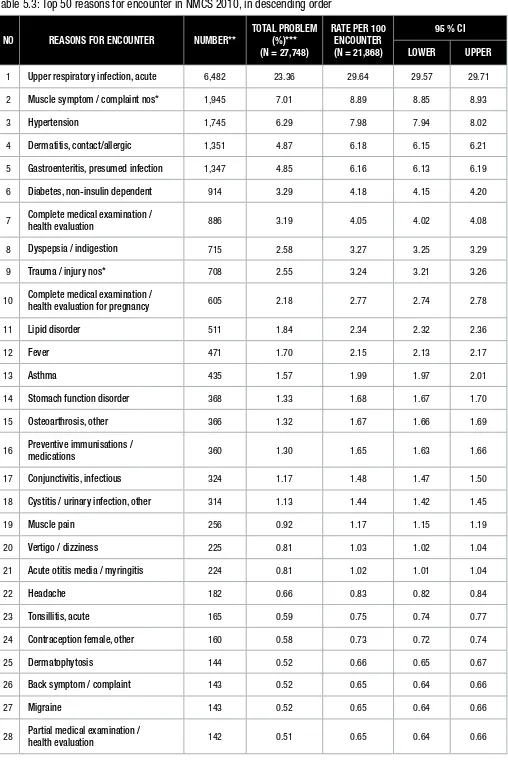
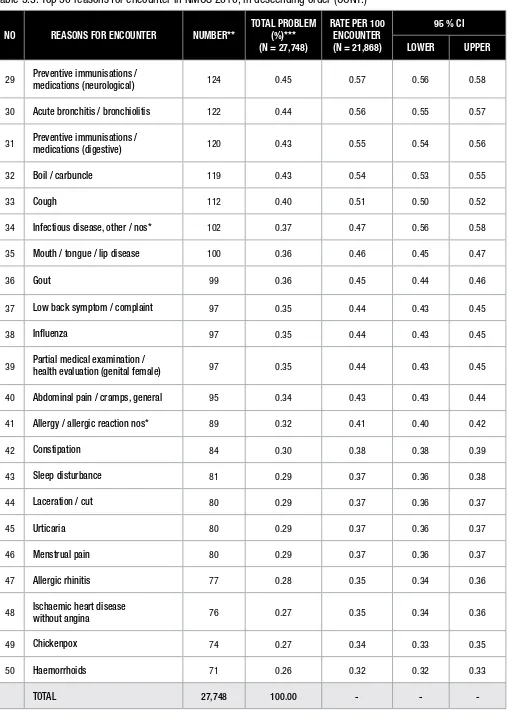
Table 5.3 shows the top 50 most frequent RFEs in NMCS 2010. Of these, the highest RFE was upper respiratory tract symptoms (URTI), constituting about a quarter of all RFEs. Second most frequent RFE was unspecified muscle complaints (7.0%), followed by hypertension (6.3%), dermatitis (4.9%), gastroenteritis (4.9%), non-insulin dependent diabetes (3.3%), complete medical examination (3.2%), dyspepsia/indigestion (2.6%), unspecified trauma/injury (2.6%) and antenatal check-up (2.2%). Among the top 10 most frequent RFEs in NMCS 2010, majority were of acute curative in nature, except hypertension, diabetes and medical examinations.
Table 5.1: Number of patients’ reasons for encounter in NMCS 2010
REASON TO VISIT NUMBER PERCENT OF ENCOUNTERS
95 % CI
LOWER UPPER
One reason 17,040 77.92 77.81 78.04
Two reasons 3,949 18.06 18.00 18.11
Three reasons 727 3.32 3.30 3.35
Four reasons 132 0.60 0.59 0.61
More than four reasons 20 0.09 0.09 0.10
TOTAL 21,868 100 -
-Reference
1. Wonca International Classification Committee (WICC). International Classification of Primary Care - 2ndEdition (ICPC-2 English). Available at http://archive. globalfamilydoctor.com/
wicc/pagers/english.pdf. Accessed January 2012.
The Reasons f
or Encounter
14 NATIONAL MEDICAL CARE STATISTICS 2010
Table 5.2: Reasons for encounter by ICPC-2 chapters in NMCS 2010, in descending order
ICPC-2 CHAPTER NUMBER* TOTAL RFE (%)** (N = 27,748)
RATE PER 100 ENCOUNTER (N = 21,868)
95 % CI
LOWER UPPER
Respiratory 7,672 27.65 35.08 35.00 35.16
Musculoskeletal 3,608 13.00 16.50 16.45 16.55
General and unspecified 3,335 12.02 15.25 15.20 15.30
Digestive 3,133 11.29 14.33 14.28 14.38
Skin 2,502 9.02 11.44 11.40 11.49
Cardiovascular 2,015 7.26 9.21 9.17 9.25
Endocrine 1,671 6.02 7.64 7.60 7.68
Pregnancy, child bearing,
family planning 946 3.41 4.33 4.30 4.35
Neurological 787 2.84 3.60 3.57 3.62
Eye 474 1.71 2.17 2.15 2.19
Urology 375 1.35 1.71 1.70 1.73
Female genital 371 1.34 1.70 1.68 1.71
Ear 370 1.33 1.69 1.67 1.71
Psychological 355 1.28 1.62 1.60 1.64
Blood 68 0.25 0.31 0.30 0.32
Male genital 62 0.22 0.28 0.28 0.29
Social problems 4 0.01 0.02 0.02 0.02
TOTAL 27,748 100 - -
-* frequency of total reasons for encounter
Table 5.3: Top 50 reasons for encounter in NMCS 2010, in descending order
1 Upper respiratory infection, acute 6,482 23.36 29.64 29.57 29.71
2 Muscle symptom / complaint nos* 1,945 7.01 8.89 8.85 8.93
3 Hypertension 1,745 6.29 7.98 7.94 8.02
4 Dermatitis, contact/allergic 1,351 4.87 6.18 6.15 6.21
5 Gastroenteritis, presumed infection 1,347 4.85 6.16 6.13 6.19
6 Diabetes, non-insulin dependent 914 3.29 4.18 4.15 4.20
7 Complete medical examination /
health evaluation 886 3.19 4.05 4.02 4.08
8 Dyspepsia / indigestion 715 2.58 3.27 3.25 3.29
9 Trauma / injury nos* 708 2.55 3.24 3.21 3.26
10 Complete medical examination /
health evaluation for pregnancy 605 2.18 2.77 2.74 2.78
11 Lipid disorder 511 1.84 2.34 2.32 2.36
12 Fever 471 1.70 2.15 2.13 2.17
13 Asthma 435 1.57 1.99 1.97 2.01
14 Stomach function disorder 368 1.33 1.68 1.67 1.70
15 Osteoarthrosis, other 366 1.32 1.67 1.66 1.69
16 Preventive immunisations /
medications 360 1.30 1.65 1.63 1.66
17 Conjunctivitis, infectious 324 1.17 1.48 1.47 1.50
18 Cystitis / urinary infection, other 314 1.13 1.44 1.42 1.45
19 Muscle pain 256 0.92 1.17 1.15 1.19
20 Vertigo / dizziness 225 0.81 1.03 1.02 1.04
21 Acute otitis media / myringitis 224 0.81 1.02 1.01 1.04
22 Headache 182 0.66 0.83 0.82 0.84
23 Tonsillitis, acute 165 0.59 0.75 0.74 0.77
24 Contraception female, other 160 0.58 0.73 0.72 0.74
25 Dermatophytosis 144 0.52 0.66 0.65 0.67
26 Back symptom / complaint 143 0.52 0.65 0.64 0.66
27 Migraine 143 0.52 0.65 0.64 0.66
28 Partial medical examination /
health evaluation 142 0.51 0.65 0.64 0.66 The Reasons f
or Encounter
16 NATIONAL MEDICAL CARE STATISTICS 2010
Table 5.3: Top 50 reasons for encounter in NMCS 2010, in descending order (CONT.)
NO REASONS FOR ENCOUNTER NUMBER**
medications (neurological) 124 0.45 0.57 0.56 0.58
30 Acute bronchitis / bronchiolitis 122 0.44 0.56 0.55 0.57
31 Preventive immunisations /
medications (digestive) 120 0.43 0.55 0.54 0.56
32 Boil / carbuncle 119 0.43 0.54 0.53 0.55
33 Cough 112 0.40 0.51 0.50 0.52
34 Infectious disease, other / nos* 102 0.37 0.47 0.56 0.58
35 Mouth / tongue / lip disease 100 0.36 0.46 0.45 0.47
36 Gout 99 0.36 0.45 0.44 0.46
37 Low back symptom / complaint 97 0.35 0.44 0.43 0.45
38 Influenza 97 0.35 0.44 0.43 0.45
39 Partial medical examination /
health evaluation (genital female) 97 0.35 0.44 0.43 0.45
40 Abdominal pain / cramps, general 95 0.34 0.43 0.43 0.44
41 Allergy / allergic reaction nos* 89 0.32 0.41 0.40 0.42
42 Constipation 84 0.30 0.38 0.38 0.39
43 Sleep disturbance 81 0.29 0.37 0.36 0.38
44 Laceration / cut 80 0.29 0.37 0.36 0.37
45 Urticaria 80 0.29 0.37 0.36 0.37
46 Menstrual pain 80 0.29 0.37 0.36 0.37
47 Allergic rhinitis 77 0.28 0.35 0.34 0.36
48 Ischaemic heart disease
without angina 76 0.27 0.35 0.34 0.36
49 Chickenpox 74 0.27 0.34 0.33 0.35
50 Haemorrhoids 71 0.26 0.32 0.32 0.33
TOTAL 27,748 100.00 - -
-*nos = not otherwise specified
** frequency of total reasons for encounter
CHAPTER 6
|
MANAGEMENT OF MORBIDITY
6.1 PRESCRIBED MEDICATION
Anatomical Therapeutic Chemical (ATC) Classification System
The drugs prescribed in a primary care setting were coded according to the ATC classification, which categorises the active ingredients into different groups according to the body system or organ on which they exert their effects as well as their chemical, pharmacological and therapeutic properties.
According to the code, each drug is classified at five different levels. first Level is the main group, which consists of mostly organs or body systems. Each of the 14 main groups in Level 1 are divided at 2nd Level according to their pharmacological and therapeutic effects, which are
further subdivided at 3rd and 4th levels based on their chemical, pharmacological and therapeutic properties. The 5th Level of the code indicates
the chemical substance1.
An example of ATC classification for amlodipine is shown below. The full ATC code for plain amlodipine products is thus C08CA01.
LEVELS ATC CODE ATC DESCRIPTION
1 C Cardiovascular system
2 C08 Calcium channel blockers
3 C08C Selective calcium channel blockers with mainly vascular effects
4 C08C A Dihydropyridine derivatives
5 C08C A01 Amlodipine
Types of Drugs Prescribed
A total of 54,532 drugs were prescribed in NMCS 2010, out of which 54,204 drugs (99.4%) were coded according to the ATC classification. The remaining 328 drugs could not be coded due to illegible writing or spelling errors.
In this report, data is being presented according to the main groups (ATC Level 1 – Table 6.1) and main therapeutic groups (ATC Level 2 – Table 6.2) followed by a list of Top 100 most prescribed medications, in descending order (Table 6.3).
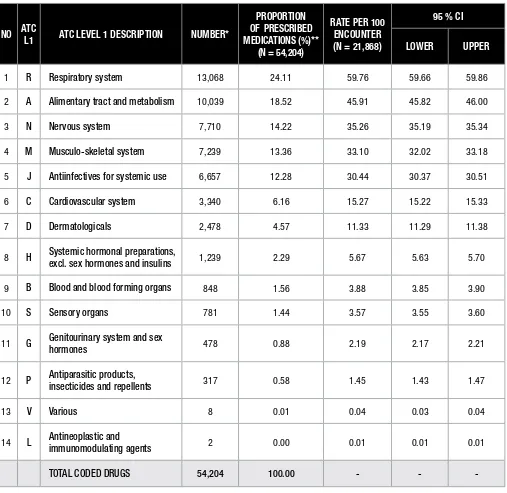
Overall, respiratory system drugs were the highest prescribed (R – 24.1%), with an average of 59.8 encounters (95%CI 59.7 – 59.9) being given a drug from this group in every 100 encounters. This is followed by drugs for alimentary tract and metabolism (A – 18.5%) and drugs for nervous system (N – 14.2%) (Table 6.1).
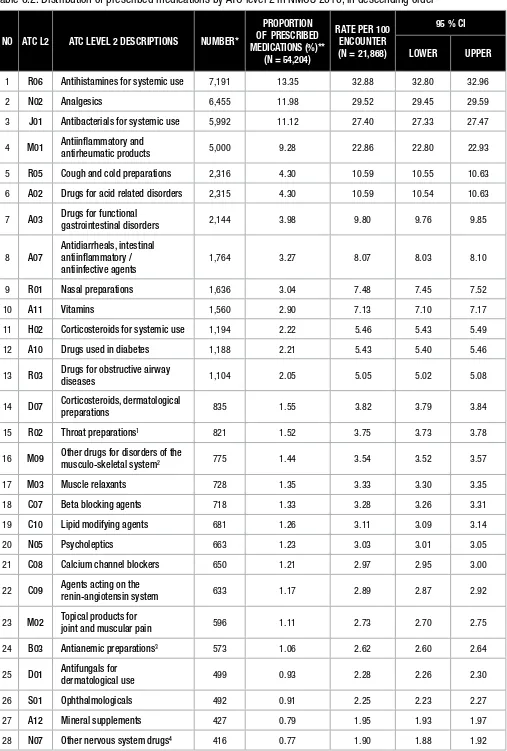
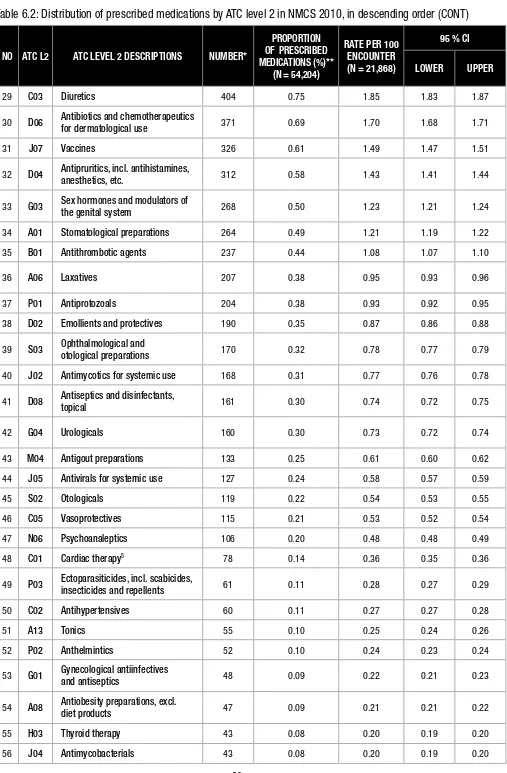
Antihistamines for systemic use (R06 – 13.4%) were the most frequently prescribed main therapeutic group (ATC Level 2), followed by analgesics (N02 – 12.0%), antibacterials for systemic use (J01 – 11.1%), anti-inflammatory and antirheumatic products (M01 – 9.3%) and cough and cold preparations (R05 – 4.3%). All 78 ATC Level 2 Codes identified in NMCS 2010 are listed in Table 6.2.
Among all the 54,204 coded drugs, paracetamol (11.1%) was the most prescribed drug, far outnumbering diphenhydramine combination products (4.3%), chlorphenamine (or chlorpheniramine – 3.8%), mefenamic acid (3.4%) and amoxicillin (3.3%) (Table 6.3).
Reference
1. WHO Collaborating Centre for Drug Statistics Methodology, Guidelines for ATC classification and DDD assignment 2011. Oslo, 2010. Mana
gement of Morbidity
18 NATIONAL MEDICAL CARE STATISTICS 2010
Table 6.1 Distribution of prescribed medications by ATC Level 1 in NMCS 2010, in descending order
NO ATC
L1 ATC LEVEL 1 DESCRIPTION NUMBER*
PROPORTION OF PRESCRIBED MEDICATIONS (%)**
(N = 54,204)
RATE PER 100 ENCOUNTER (N = 21,868)
95 % CI
LOWER UPPER
1 R Respiratory system 13,068 24.11 59.76 59.66 59.86
2 A Alimentary tract and metabolism 10,039 18.52 45.91 45.82 46.00
3 N Nervous system 7,710 14.22 35.26 35.19 35.34
4 M Musculo-skeletal system 7,239 13.36 33.10 32.02 33.18
5 J Antiinfectives for systemic use 6,657 12.28 30.44 30.37 30.51
6 C Cardiovascular system 3,340 6.16 15.27 15.22 15.33
7 D Dermatologicals 2,478 4.57 11.33 11.29 11.38
8 H Systemic hormonal preparations,
excl. sex hormones and insulins 1,239 2.29 5.67 5.63 5.70
9 B Blood and blood forming organs 848 1.56 3.88 3.85 3.90
10 S Sensory organs 781 1.44 3.57 3.55 3.60
11 G Genitourinary system and sex
hormones 478 0.88 2.19 2.17 2.21
12 P Antiparasitic products,
insecticides and repellents 317 0.58 1.45 1.43 1.47
13 V Various 8 0.01 0.04 0.03 0.04
14 L Antineoplastic and
immunomodulating agents 2 0.00 0.01 0.01 0.01
TOTAL CODED DRUGS 54,204 100.00 - -
-* frequency of total coded drugs
Table 6.2: Distribution of prescribed medications by ATC level 2 in NMCS 2010, in descending order
NO ATC L2 ATC LEVEL 2 DESCRIPTIONS NUMBER*
PROPORTION
1 R06 Antihistamines for systemic use 7,191 13.35 32.88 32.80 32.96
2 N02 Analgesics 6,455 11.98 29.52 29.45 29.59
3 J01 Antibacterials for systemic use 5,992 11.12 27.40 27.33 27.47
4 M01 Antiinflammatory and
antirheumatic products 5,000 9.28 22.86 22.80 22.93
5 R05 Cough and cold preparations 2,316 4.30 10.59 10.55 10.63
6 A02 Drugs for acid related disorders 2,315 4.30 10.59 10.54 10.63
7 A03 Drugs for functional
gastrointestinal disorders 2,144 3.98 9.80 9.76 9.85
8 A07
Antidiarrheals, intestinal antiinflammatory / antiinfective agents
1,764 3.27 8.07 8.03 8.10
9 R01 Nasal preparations 1,636 3.04 7.48 7.45 7.52
10 A11 Vitamins 1,560 2.90 7.13 7.10 7.17
11 H02 Corticosteroids for systemic use 1,194 2.22 5.46 5.43 5.49
12 A10 Drugs used in diabetes 1,188 2.21 5.43 5.40 5.46
13 R03 Drugs for obstructive airway
diseases 1,104 2.05 5.05 5.02 5.08
14 D07 Corticosteroids, dermatological
preparations 835 1.55 3.82 3.79 3.84
15 R02 Throat preparations1 821 1.52 3.75 3.73 3.78
16 M09 Other drugs for disorders of the
musculo-skeletal system2 775 1.44 3.54 3.52 3.57
17 M03 Muscle relaxants 728 1.35 3.33 3.30 3.35
18 C07 Beta blocking agents 718 1.33 3.28 3.26 3.31
19 C10 Lipid modifying agents 681 1.26 3.11 3.09 3.14
20 N05 Psycholeptics 663 1.23 3.03 3.01 3.05
21 C08 Calcium channel blockers 650 1.21 2.97 2.95 3.00
22 C09 Agents acting on the
renin-angiotensin system 633 1.17 2.89 2.87 2.92
23 M02 Topical products for
joint and muscular pain 596 1.11 2.73 2.70 2.75
24 B03 Antianemic preparations3 573 1.06 2.62 2.60 2.64
25 D01 Antifungals for
dermatological use 499 0.93 2.28 2.26 2.30
26 S01 Ophthalmologicals 492 0.91 2.25 2.23 2.27
27 A12 Mineral supplements 427 0.79 1.95 1.93 1.97
28 N07 Other nervous system drugs4 416 0.77 1.90 1.88 1.92
Mana
gement of Morbidity
20 NATIONAL MEDICAL CARE STATISTICS 2010
Table 6.2: Distribution of prescribed medications by ATC level 2 in NMCS 2010, in descending order (CONT)
NO ATC L2 ATC LEVEL 2 DESCRIPTIONS NUMBER*
PROPORTION
29 C03 Diuretics 404 0.75 1.85 1.83 1.87
30 D06 Antibiotics and chemotherapeutics
for dermatological use 371 0.69 1.70 1.68 1.71
31 J07 Vaccines 326 0.61 1.49 1.47 1.51
32 D04 Antipruritics, incl. antihistamines,
anesthetics, etc. 312 0.58 1.43 1.41 1.44
33 G03 Sex hormones and modulators of
the genital system 268 0.50 1.23 1.21 1.24
34 A01 Stomatological preparations 264 0.49 1.21 1.19 1.22
35 B01 Antithrombotic agents 237 0.44 1.08 1.07 1.10
36 A06 Laxatives 207 0.38 0.95 0.93 0.96
37 P01 Antiprotozoals 204 0.38 0.93 0.92 0.95
38 D02 Emollients and protectives 190 0.35 0.87 0.86 0.88
39 S03 Ophthalmological and
otological preparations 170 0.32 0.78 0.77 0.79
40 J02 Antimycotics for systemic use 168 0.31 0.77 0.76 0.78
41 D08 Antiseptics and disinfectants,
topical 161 0.30 0.74 0.72 0.75
42 G04 Urologicals 160 0.30 0.73 0.72 0.74
43 M04 Antigout preparations 133 0.25 0.61 0.60 0.62
44 J05 Antivirals for systemic use 127 0.24 0.58 0.57 0.59
45 S02 Otologicals 119 0.22 0.54 0.53 0.55
46 C05 Vasoprotectives 115 0.21 0.53 0.52 0.54
47 N06 Psychoanaleptics 106 0.20 0.48 0.48 0.49
48 C01 Cardiac therapy5 78 0.14 0.36 0.35 0.36
49 P03 Ectoparasiticides, incl. scabicides,
insecticides and repellents 61 0.11 0.28 0.27 0.29
50 C02 Antihypertensives 60 0.11 0.27 0.27 0.28
51 A13 Tonics 55 0.10 0.25 0.24 0.26
52 P02 Anthelmintics 52 0.10 0.24 0.23 0.24
53 G01 Gynecological antiinfectives
and antiseptics 48 0.09 0.22 0.21 0.23
54 A08 Antiobesity preparations, excl.
diet products 47 0.09 0.21 0.21 0.22
55 H03 Thyroid therapy 43 0.08 0.20 0.19 0.20
Table 6.2: Distribution of prescribed medications by ATC level 2 in NMCS 2010, in descending order (CONT)
NO ATC L2 ATC LEVEL 2 DESCRIPTIONS NUMBER*
PROPORTION
57 N03 Antiepileptics 43 0.08 0.20 0.19 0.20
58 D10 Anti-acne preparations 42 0.08 0.19 0.19 0.20
59 A16 Other alimentary tract and
metabolism products 36 0.07 0.16 0.16 0.17
60 D11 Other dermatological preparations 27 0.05 0.12 0.12 0.13
61 B02 Antihemorrhagics 22 0.04 0.10 0.10 0.10
62 D05 Antipsoriatics 22 0.04 0.10 0.10 0.10
63 A09 Digestives, incl. enzymes 19 0.04 0.09 0.08 0.09
64 B05 Blood substitutes and
perfusion solutions 16 0.03 0.07 0.07 0.08
65 N04 Anti-parkinson drugs 16 0.03 0.07 0.07 0.08
66 A05 Bile and liver therapy 11 0.02 0.05 0.05 0.05
67 D03 Preparations for treatment of
wounds and ulcers 11 0.02 0.05 0.05 0.05
68 N01 Anesthetics 11 0.02 0.05 0.05 0.05
69 D09 Medicated dressings 8 0.01 0.04 0.03 0.04
70 V06 General nutrients 8 0.01 0.04 0.03 0.04
71 M05 Drugs for treatment of
bone diseases 7 0.01 0.03 0.03 0.03
72 A04 Antiemetics and antinauseants 2 0.00 0.01 0.01 0.01
73 G02 Other gynecologicals6 2 0.00 0.01 0.01 0.01
74 H05 Calcium homeostasis7 2 0.00 0.01 0.01 0.01
75 C04 Peripheral vasodilators 1 0.00 0.00 0.00 0.01
76 J06 Immune sera and immunoglobulins 1 0.00 0.00 0.00 0.01
77 L02 Endocrine therapy 1 0.00 0.00 0.00 0.01
78 L04 Immunosuppressants 1 0.00 0.00 0.00 0.01
* frequency of total coded drugs
** calculated based on total coded drugs (n = 54,204)
1. Refers to preparations for common minor infections of mouth and throat, consisting of mainly lozenges
2. Refers to drugs for musculoskeletal system other than anti-inflammatory and antirheumatic products, topical products for joint and muscle pain, antigout preparations and drugs for bone diseases. For example, enzymes preparations and hyaluronic acid injections
3. Includes iron preparations, vitamin B12 and folic acid, and other antianemic preparations
4. Refers to drugs for nervous system other than anaesthetics, analgesic, anti-parkinson drugs, anti-epileptics, psycholeptics and psychoanaleptics, e.g. antivertigo preparations 5. Includes cardiac glycosides, antiarrhythmics, cardiac stimulants and vasodilators for cardiac diseases
6. Includes intrauterine devices
7. Includes calcitonin preparations
Mana
gement of Morbidity
22 NATIONAL MEDICAL CARE STATISTICS 2010
Table 6.3: Top 100 most prescribed medications in NMCS 2010, in descending order
NO ATC CODE ATC DESCRIPTION NUMBER*
1 N02BE01 Paracetamol (plain) 6,000 11.07 27.44 27.37 27.51
2 R06AA52 Diphenhydramine, combinations 2,312 4.27 10.57 10.53 10.62
3 R06AB04 Chlorphenamine 2,078 3.83 9.50 9.46 9.54
4 M01AG01 Mefenamic acid 1,827 3.37 8.35 8.32 8.39
5 J01CA04 Amoxicillin 1,769 3.26 8.09 8.05 8.13
6 M01AB05 Diclofenac 1,720 3.17 7.87 7.83 7.90
7 R01BA52 Pseudoephedrine, combinations 1,498 2.76 6.85 6.82 6.88
8 A03BB01 Butylscopolamine (hyoscine) 1,077 1.99 4.93 4.90 4.95
9 J01DB01 Cefalexin 861 1.59 3.94 3.91 3.96
10 H02AB06 Prednisolone 839 1.55 3.84 3.81 3.86
11 M09AB Enzymes 775 1.43 3.54 3.52 3.57
12 R06AB02 Dexchlorpheniramine 712 1.31 3.26 3.23 3.28
13 A02AA10 Magnesium compounds,
combinations; antacid 656 1.21 3.00 2.98 3.02
14 R06AE07 Cetirizine 636 1.17 2.91 2.89 2.93
15 A07CA Oral rehydration salt
formulations 624 1.15 2.85 2.83 2.88
16 M03BC51 Orphenadrine, combinations1 585 1.08 2.68 2.65 2.70
17 A10BA02 Metformin 575 1.06 2.63 2.61 2.65
18 J01FA01 Erythromycin 572 1.06 2.62 2.59 2.64
19 A02AF02 Ordinary salt combinations
and antiflatulents 569 1.05 2.60 2.58 2.62
20 R05CB02 Bromhexine 565 1.04 2.58 2.56 2.60
21 R06AX13 Loratadine 543 1.00 2.48 2.46 2.50
22 R05DA20
Opium alkaloids and derivatives, combinations; cough suppressants
542 1.00 2.48 2.46 2.50
23 R03CC02 Salbutamol; for systemic use 498 0.92 2.28 2.26 2.30
24 M02AC
Preparations with salicylic acid derivatives; topical products for joint and muscular pain
491 0.91 2.25 2.23 2.27
25 A11GA01 Ascorbic acid (vit C) 468 0.86 2.14 2.12 2.16
26 M01AE01 Ibuprofen 452 0.83 2.07 2.05 2.09
Table 6.3: Top 100 most prescribed medications in NMCS 2010, in descending order (CONT)
28 J01CF02 Cloxacillin 430 0.79 1.97 1.95 1.99
29 A11DB Vitamin B1 in combination with
vitamin B6 and/or vitamin B12 427 0.79 1.95 1.93 1.97
30 R06AA02 Diphenhydramine 390 0.72 1.78 1.77 1.80
31 A07DA03 Loperamide 376 0.69 1.72 1.70 1.74
32 R05DA09 Dextromethorphan 369 0.68 1.69 1.67 1.71
33 J01CR02 Amoxicillin and enzyme inhibitor 364 0.67 1.66 1.65 1.68
34 A03AX13 Silicones; for functional bowel
disorder 355 0.65 1.62 1.61 1.64
35 A07DA01 Diphenoxylate2 354 0.65 1.62 1.60 1.64
36 A02BA01 Cimetidine 345 0.64 1.58 1.56 1.59
37 D07AC01 Betamethasone; topical 343 0.63 1.57 1.55 1.59
38 C08CA01 Amlodipine 340 0.63 1.55 1.54 1.57
39 A03FA01 Metoclopramide 326 0.60 1.49 1.47 1.51
40 N05AB04 Prochlorperazine 318 0.59 1.45 1.44 1.47
41 D04AX Other antipruritics; topical3 310 0.57 1.42 1.40 1.43
42 S01AA01 Chloramphenicol;
ophthalmologicals 299 0.55 1.37 1.35 1.38
43 C10AA02 Lovastatin 297 0.55 1.36 1.34 1.37
44 J01EE01 Sulfamethoxazole and
trimethoprim 280 0.52 1.28 1.27 1.30
45 M01AC06 Meloxicam 275 0.51 1.26 1.24 1.27
46 C08CA05 Nifedipine 274 0.51 1.25 1.24 1.27
47 R06AD02 Promethazine 274 0.51 1.25 1.24 1.27
48 N07CA02 Cinnarizine 237 0.44 1.08 1.07 1.10
49 B03BB01 Folic acid 230 0.42 1.05 1.04 1.07
50 A03FA03 Domperidone 224 0.41 1.02 1.01 1.04
51 R02A Throat preparations4 224 0.41 1.02 1.01 1.04
52 A07BA01 Medicinal charcoal 223 0.41 1.02 1.00 1.03
53 A11EA Vitamin B-complex, plain 218 0.40 1.00 0.98 1.01
54 A10BB09 Gliclazide 214 0.39 0.98 0.97 0.99
Mana
gement of Morbidity
24 NATIONAL MEDICAL CARE STATISTICS 2010
Table 6.3: Top 100 most prescribed medications in NMCS 2010, in descending order (CONT)
NO ATC CODE ATC DESCRIPTION NUMBER*
55 A10BB01 Glibenclamide 213 0.39 0.97 0.96 0.99
56 C03AA03 Hydrochlorothiazide 212 0.39 0.97 0.96 0.98
57 D01AC20
Imidazole and triazole derivatives, combinations with corticosteroids
206 0.38 0.94 0.93 0.96
58 C09AA04 Perindopril 204 0.38 0.93 0.92 0.95
59 C10AA01 Simvastatin 204 0.38 0.93 0.92 0.95
60 N02BE51 Paracetamol, combinations
excluding psycholeptics 203 0.37 0.93 0.92 0.94
61 B01AC06 Acetylsalicylic acid 202 0.37 0.92 0.91 0.94
62 J01AA02 Doxycycline 202 0.37 0.92 0.91 0.94
63 P01AB01 Metronidazole 199 0.37 0.91 0.90 0.92
64 A02BA02 Ranitidine 198 0.37 0.91 0.89 0.92
65 A11BA Multivitamins, plain 188 0.35 0.86 0.85 0.87
66 A02BC01 Omeprazole 180 0.33 0.82 0.81 0.84
67 R03DA04 Theophylline 179 0.33 0.82 0.81 0.83
68 A02BA03 Famotidine 177 0.33 0.81 0.80 0.82
69 A12AA05 Calcium lactate 174 0.32 0.80 0.78 0.81
70 M01AE02 Naproxen 174 0.32 0.80 0.78 0.81
71 J01MA02 Ciprofloxacin 172 0.32 0.79 0.77 0.80
72 A12BA02 Potassium citrate 171 0.32 0.78 0.77 0.79
73 M01AC01 Piroxicam 170 0.31 0.78 0.77 0.79
74 J01DB05 Cefadroxil 162 0.30 0.74 0.73 0.75
75 H02AB02 Dexamethasone;
for systemic use 154 0.28 0.70 0.69 0.72
76 C07AB02 Metoprolol 152 0.28 0.70 0.68 0.71
77 R05CB06 Ambroxol 147 0.27 0.67 0.66 0.68
78 S03CA01
preparations5 145 0.27 0.66 0.65 0.67
80 D07AA02 Hydrocortisone; topical 144 0.27 0.66 0.65 0.67
Table 6.3: Top 100 most prescribed medications in NMCS 2010, in descending order (CONT)
preparations6 143 0.26 0.65 0.64 0.66
83 R05DB21 Cloperastine 141 0.26 0.64 0.63 0.66
84 J01FA09 Clarithromycin 140 0.26 0.64 0.63 0.65
85 D02AX Other emollients and
protectives7 131 0.24 0.60 0.59 0.61
86 J07AM01 Tetanus toxoid 131 0.24 0.60 0.59 0.61
87 R03CC03 Terbutaline; for systemic use 131 0.24 0.60 0.59 0.61
88 B03AA02 Ferrous fumarate 130 0.24 0.59 0.58 0.60
89 D07CC01 Betamethasone and antibiotics
combinations; topical 124 0.23 0.57 0.56 0.58
90 D06AX01 Fusidic acid; topical 123 0.23 0.56 0.55 0.57
91 H02AB01 Betamethasone;
for systemic use 116 0.21 0.53 0.52 0.54
92 A01AC01 Triamcinolone;
for local oral treatment 113 0.21 0.52 0.51 0.53
93 R05CA10 Expectorant, combinations 112 0.21 0.51 0.50 0.52
94 R02AA20 Other antiseptics;
throat preparations8 109 0.20 0.50 0.49 0.51
95 C09AA02 Enalapril 108 0.20 0.49 0.48 0.50
96 G04BX Other urologicals 106 0.20 0.48 0.48 0.49
97 M01AH05 Etoricoxib 106 0.20 0.48 0.48 0.49
98 R02AX Other throat preparations9 106 0.20 0.48 0.48 0.49
99 R05CB03 Carbocisteine 106 0.20 0.48 0.48 0.48
100 J02AB02 Ketoconazole; for systemic use 104 0.19 0.48 0.47 0.48
TOTAL CODED DRUGS 54,204 100.00
* frequency of total coded drugs
** calculated based on total coded drugs (n = 54,204)
1. Including combinations with paracetamol
2. Including combinations with atropine
3. Excluding topical anthistamines and anaesthetics
4. Unspecified lozenges
5. Refers to dequalinium lozenges
6. Including cough and cold preparations which were neither expectorants nor cough suppressants, such as methol inhalations, traditional remedies
7. Including soft paraffin and fat products with high water content (creams) such as aqueous creams, emulsifying ointment
8. Refers to antiseptic gargle
9. Refers to herbal lozenges
Mana
gement of Morbidity
26 NATIONAL MEDICAL CARE STATISTICS 2010
6.2 CONTINUITY OF CARE
The majority of encounters were not followed up (74.7%) only 22.9% had follow ups while a small number (0.9%) of encounters were referred to other doctors/specialists, to hospitals (0.7%) and to others (0.8%). This survey did not capture which health indications were sent for referral.
Table 6.4: Follow up proposed by primary care practitioners in NMCS 2010
VISIT DISPOSITION NUMBER TOTAL (%)
95 % CI
LOWER UPPER
No follow up planned 15,803 74.73 74.62 74.85
Follow up planned 4,872 23.04 22.98 23.10
Referral to other doctor / specialist1 185 0.87 0.86 0.89
Referral to hospital2 141 0.67 0.66 0.68
Others3 145 0.69 0.68 0.70
SUBTOTAL 21,146* 100 - -
* includes presence of missing data
1. Includes referral to other doctors (e.g. doctors in government clinics), physicians, specialists
2. Includes referral to hospital emergency department and hospital follow up
APPENDIX 1
|
PARTICIPANTS OF NMCS 2010
PUBLIC/MINISTRY OF HEALTH
Wilayah Persekutuan Kuala Lumpur
1 Klinik Kesihatan Pantai 2 Klinik Kesihatan Sentul
Wilayah Persekutuan Putrajaya
1 Klinik Kesihatan Putrajaya
Selangor
1 Poliklinik Komuniti Sungai Buloh 8 Poliklinik Komuniti Jenjarom
2 Poliklinik Komuniti Selayang Baru 9 Poliklinik Komuniti Jeram
3 Poliklinik Komuniti Klang 10 Poliklinik Komuniti Seri Kembangan
4 Poliklinik Komuniti Hulu Langat ( Klinik Kesihatan Batu 13 1/4) 11 Poliklinik Komuniti Shah Alam
5 Poliklinik Komuniti Kampung Soeharto 12 Poliklinik Komuniti Sungai Pelek
6 Poliklinik Komuniti Telok Datok 13 Klinik Kesihatan Bestari Jaya
7 Poliklinik Komuniti Kg. Bandar
Kedah
1 Klinik Kesihatan Merbok 8 Klinik Kesihatan Kulim
2 Klinik Kesihatan Bakar Arang 9 Klinik Kesihatan Bandar Alor Setar
3 Klinik Kesihatan Sungai Limau Dalam 10 Poliklinik Komuniti Kota Sarang Semut
4 Poliklinik Komuniti Banai 11 Poliklinik Komuniti Pokok Sena
5 Poliklinik Komuniti Tunjang 12 Poliklinik Komuniti Jalan Putra
6 Poliklinik Komuniti Laka Temin 13 Klinik Kesihatan Kuah
7 Klinik Kesihatan Bandar Baharu 14 Klinik Kesihatan Padang Matsirat
Kelantan
1 Klinik Kesihatan Badang 4 Klinik Kesihatan Gual Ipoh
2 Klinik Kesihatan Pengkalan Chepa 5 Klinik Kesihatan Gaal
3 Klinik Kesihatan Wakaf Bharu
Johor
1 Klinik Kesihatan Bagan 7 Poliklinik Komuniti Parit Jawa
2 Klinik Kesihatan Kulai Besar 8 Klinik Kesihatan Bakri
3 Poliklinik Komuniti Kampung Majidee 9 Poliklinik Komuniti Pontian (Klinik Kesihatan Pontian)
4 Poliklinik Komuniti Ulu Tiram 10 Poliklinik Komuniti Batu Anam
5 Poliklinik Komuniti Air Tawar 2 11 Klinik Kesihatan Ayer Hitam, Batu Pahat
6 Poliklinik Komuniti Bukit Besar
Melaka
1 Klinik Kesihatan Ayer Molek 3 Klinik Kesihatan Peringgit
2 Klinik Kesihatan Kuala Sungai Baru 4 Klinik Kesihatan Ujong Pasir
Negeri Sembilan
1 Klinik Kesihatan Jelai 4 Klinik Kesihatan Palong 4,5,6
2 Klinik Kesihatan Lenggeng 5 Klinik Kesihatan Pertang
3 Klinik Kesihatan Lui Muda 6 Klinik Kesihatan Titi
Participants of NMCS 2010
28 NATIONAL MEDICAL CARE STATISTICS 2010
Pahang
1 Klinik Kesihatan Bandar Tun Razak 5 Klinik Kesihatan Padang Luas
2 Klinik Kesihatan Chini 6 Klinik Kesihatan Sanggang 3 Klinik Kesihatan Kampung Bantal 7 Klinik Kesihatan Sungai Lembing 4 Klinik Kesihatan Lanchang
Perak
1 Klinik Kesihatan Bidor 12 Klinik Kesihatan Kuala Kurau 2 Klinik Kesihatan Bota Kiri 13 Klinik Kesihatan Lambor Kiri 3 Klinik Kesihatan Changkat Jering 14 Klinik Kesihatan Lekir
4 Klinik Kesihatan Changkat Keruing 15 Klinik Kesihatan Lintang 5 Klinik Kesihatan Chenderong Balai 16 Klinik Kesihatan Menglembu 6 Klinik Kesihatan Gopeng 17 Klinik Kesihatan Pokok Assam 7 Klinik Kesihatan Hutan Melintang 18 Klinik Kesihatan Redang Panjang
8 Klinik Kesihatan Jalan Baru 19 Klinik Kesihatan Sungai Bayor 9 Klinik Kesihatan Kampung Gajah 20 Klinik Kesihatan Tanjung Piandang 10 Klinik Kesihatan Kedai Empat 21 Klinik Kesihatan Trong
11 Klinik Kesihatan Tronoh
Pulau Pinang
1 Klinik Kesihatan Kepala Batas 4 Klinik Kesihatan Sungai Acheh 2 Klinik Kesihatan Mak Mandin 5 Klinik Kesihatan Tasek Gelugor
3 Klinik Kesihatan Nibong Tebal
Sabah
1 Klinik Kesihatan Luyang 6 Poliklinik Komuniti Perancangan
2 Poliklinik Komuniti Bundu Tuhan 7 Poliklinik Komuniti Telaga 3 Poliklinik Komuniti Karakit 8 Poliklinik Komuniti Tinangol 4 Poliklinik Komuniti Paginatan 9 Poliklinik Komuniti Tongod 5 Poliklinik Komuniti Penangah
Sarawak
1 Klinik Kesihatan Balai 12 Klinik Kesihatan Nanga Tau
2 Klinik Kesihatan Batu Danau 13 Klinik Kesihatan Nanga Wak 3 Klinik Kesihatan Batu Kawa 14 Klinik Kesihatan Pakan 4 Klinik Kesihatan Biawak 15 Klinik Kesihatan Sambir 5 Klinik Kesihatan Kuala Balingian 16 Klinik Kesihatan Sematan
6 Klinik Kesihatan Long Sukang 17 Klinik Kesihatan Spaoh 7 Klinik Kesihatan Nanga Ensiring 18 Klinik Kesihatan Tanjung Manis 8 Klinik Kesihatan Nanga Entaih 19 Klinik Kesihatan Tarat 9 Klinik Kesihatan Nanga Patoh 20 Klinik Kesihatan Tian 10 Klinik Kesihatan Nanga Semah 21 Klinik Kesihatan Trusan
11 Klinik Kesihatan Tubau
Terengganu
PRIVATE
Johor
1 Klinik Gan Surgery 46 Klinik Teo ( Klinik Teo & Tan Sdn Bhd )
2 Klinik Joseph Varghese 47 Klinik Ishi
3 Klinik K-K 48 Poliklinik Penawar - Kg Pasir, Tampoi
4 Klinik P. N. Teoh 49 Klinik Praba
5 Klinik Theesan (Taman U) 50 Poliklinik Penawar - Masai 6 Klinik Lee 51 Klinik Daya Singh Sdn Bhd
7 Klinik Naveen 52 Poliklinik Penawar - Tmn Universiti
8 Kelinik Rakyat (Yong Peng) 53 Poliklinik Damai & Surgeri, Tmn Desa Jaya
9 Klinik Toledo 54 Poliklinik Puteri Dan Surgeri (Jln Niaga, Kota Tinggi)
10 Federal Clinic (Century Garden) 55 Poliklinik Penawar (Pusat Bandar, Bandar Penawar) 11 PoliKlinik P & Lee (Taman Intan) 56 Poliklinik Penawar - Tmn Bintang, Senai
12 Klinik Adham Cawangan Kota Tinggi 57 Kelinik Woo & Hong
13 Klinik Anda 58 24 Jam Poliklinik Yap
14 Poliklinik Fatimah (Taman Daya) 59 Klinik Keluarga
15 Klinik Adham Cawangan Indahpura 60 Poliklinik Penawar
16 Klinik Chan & Ng 61 Poliklinik Penawar - Tmn Istimewa Pandan
17 Klinik Foo 62 Klinik Sentosa
18 Klinik Hooi 63 Klinik Sejahtera (Pt. Raja)
19 Klinik Hosanna 64 Poliklinik John
20 Klinik Insan Sdn Bhd (Tmn U) 65 Klinik Pertama ( Tmn Johor Jaya )
21 Klinik Jamaliah 66 Klinik Skudai
22 Klinik Kamal 67 Klinik Githa (Tmn Mesra, Saleng)
23 Klinik Kota, Yong Peng 68 The People Dispensary Sdn Bhd (Klinik People Masai)
24 Kelinik Mersing 69 Klinik Sri Sulong
25 Klinik Murni 70 Poliklinik Penawar (Tmn Tun Sri Lanang)
26 Klinik Penawar & Surgeri, Kluang 71 Poliklinik Jaya Skudai 27 Klinik Tawakal, Rengit 72 Klinik Selesa Jaya
28 Klinik Wira 73 Poliklinik Ihsan (Tmn Kempas)
29 Klinik Zainab 74 Klinik Public, Kulai
30 Poliklinik Dahlia 75 Tay & Tan Medicare Sdn Bhd ( T & T Clinic)
31 Poliklinik Penawar - Tmn Rinting 76 Klinik Australia 32 Poliklinik Tan 77 Klinik Wan Suhaimi
33 Poliklinik Penawar (Tmn Air Biru) 78 Poliklinik Penawar - Tmn Sri Bahagia
34 Klinik Intan, Johor Bahru 79 Poliklinik Taj 24 Jam,Taman Tampoi Utama
35 Poliklinik Universiti 80 Klinik Uma
36 Klinik Sandhu Senai 81 Poliklinik Sejahtera Sdn Bhd
37 Klinik M. Y. Wong 82 Klinik Mohan
38 Klinik Dan Surgeri Taman Daya 83 Klinik Adham ( Senai I )
39 Klinik Yee 84 Poliklinik PTP
40 Klinik Githa, Tmn Kulai Utama 85 Klinik S. T. Ng
41 Klinik Wong (Jln Senohong Dua) 86 Poliklinik Impian
42 Poliklinik Sutera 87 Poliklinik Penawar - Tanjung Sedili 43 Poliklinik Penawar - Tmn Dahlia 88 Poliklinik Mesra
44 Klinik Githa, Kelapa Sawit 89 Poliklinik Penawar (Tmn Kota Masai, Jln Betik)
45 Klinik People (Permas Jaya) 90 Kelinik Malaysia Johor Bahru
Participants of NMCS 2010
30 NATIONAL MEDICAL CARE STATISTICS 2010
Johor (CONT)
91 Klinik Achutha 121 Klinik Wong (Jln Temenggong)
92 Klinik Dhass Sdn Bhd 122 Klinik Zainon
93 Poliklinik Anggerik 123 Klinik Zalina
94 Poliklinik Hijrah (Tmn Puteri Wangsa) 124 Klinik Perintis Health Care
95 Poliklinik Penawar - Felda Tenggaroh 2 125 Klinik Razak
96 Poliklinik Penawar (Felda Kledang) 126 Klinik Redzuan
97 Poliklinik Penawar (Jalan Suasa, Pasir Gudang) 127 Klinik Sairam
98 Poliklinik Penawar - Kolam Air 128 Klinik Sia Dan Surgeri 99 Poliklinik Penawar - Tmn Daya 129 Poliklinik Koh
100 Kelinik Sri Larkin (Tmn Perindustrian Tebrau) 130 Poliklinik Kuek
101 Klinik Aishah 131 Poliklinik Amin
102 Klinik Chew Dan Surgeri 132 Poliklinik Cempaka (Tmn Air Biru)
103 BP Diagnostic Centre Sdn Bhd (Tmn Century) 133 Poliklinik Medic
104 Klinik Adham (Bandar Putra) 134 Poliklinik Sejahtera
105 Klinik Adham (Caw. Larkin) 135 Poliklinik Penawar (Tmn Johor Jaya)
106 Klinik Hussien 136 Poliklinik Rozikin (Masai)
107 Klinik King 137 The People Dispensary Sdn Bhd (Jln Ibrahim)
108 Klinik Ali 138 Titan Inplant Clinic Tg Langsat
109 Klinik Keluarga (Segamat) 139 Titan P Gudang Inplant Clinic 110 Klinik Amar 140 Klinik i Care
111 Klinik Bakti 141 Klinik Tan & Lum (Benut)
112 Klinik Goh & Surgeri 142 Klinik Tan & Lum (Pekan Nenas)
113 Klinik Kulit Pertama 143 Klinik Aliza Sdn Bhd
114 Klinik Mulia Pasir Gudang 144 Klinik Kwang 115 Klinik Rompin 145 Klinik Malaysia
116 Klinik Makmur 146 Dispensari Huang
117 Klinik Senggarang (Klinik Teo & Tan Sdn Bhd) 147 Klinik Rashid dan Raudhah
118 Klinik Sinaran 148 Klinik Pontian
119 Klinik Tee 149 Poliklinik Zakariya
120 Klinik Parit Yaani
Kedah
1 Klinik Ceria 14 Klinik Lim Chin Chong Sdn Bhd
2 Klinik Cham 15 Klinik Low
3 Klinik Cheng & Su, Tmn Sejati Indah 16 Klinik Pakar Dr Adnan Osman (Poliklinik Pakar Perubatan Jitra)
4 Klinik Cheng & Su, Wisma Bandaran 17 Klinik Pakar Dr Adnan Osman (Poliklinik Pakar Perubatan Jitra)
5 Klinik Cinta Sayang, Tmn Ria jaya 18 Klinik Rapha
6 Klinik Doreen Khoo 19 Klinik Sanan
7 Klinik Dr Rosly 20 Klinik Soma
8 Klinik Faisal Hamdi 21 Klinik Sri Cengal
9 Klinik Fatimah 22 Poliklinik Tanjung
10 Klinik Fernandez Lunas 23 Klinik Teoh Kim Yong
11 Klinik Foong 24 Klinik Ummi
12 Klinik Gurun 25 Klinik Yahya
Kedah (CONT)
27 Mediklinik Ehsan Alor Setar 36 Poliklinik Dr. Azhar & Rakan-rakan
28 Petronas Fertilizer (Kedah) Sdn. Bhd. Industrial Clinic 37 Poliklinik Dr. Azhar & Rakan-rakan, Plaza Kuala Kedah
29 Poliklinik Afiat 38 Poliklinik Dr. Jalaludin
30 Poliklinik Berkat 39 Poliklinik Famili
31 Poliklinik Dr. Azhar & Rakan-rakan 40 Poliklinik Mutiara Cawangan Simpang Kuala
32 Poliklinik Dr. Azhar & Rakan-rakan 41 Poliklinik Mutiara, Tmn Desa Aman
33 Poliklinik Dr. Azhar & Rakan-rakan 42 Poliklinik Sandhu
34 Poliklinik Dr. Azhar & Rakan-rakan 43 Poliklinik Tan
35 Poliklinik Dr. Azhar & Rakan-rakan
Kelantan
1 Aziz Clinic 16 Klinik Lim
2 Klinik A Wahab 17 Klinik Lua, Jln Sultan Yahya Petra
3 Klinik An Nuur 18 Klinik Nik
4 Klinik Ariffin 19 Klinik Perdana - Bgn PKINK
5 Klinik Dr Kamaludin 20 Klinik Perdana Cawangan Islah
6 Klinik Dr Nida 21 Klinik Perdana Melor
7 Klinik Dr Ramzi 22 Klinik Prihatin
8 Klinik Dr. Wan Abdul Kadir 23 Klinik Rahimah
9 Klinik Dr. Yasiman Perdana 24 Klinik Rusli
10 Klinik Farisya 25 Klinik Sayyida Sdn.Bhd.
11 Klinik Fatah & Abdullah 26 Klinik Shafee
12 Klinik Ho 27 Klinik Suhaila
13 Klinik Ikthiar Kota Jambal 28 Klinik Wan Fatimah
14 Klinik Insaf 29 Poliklinik Utama
15 Klinik Kota Bharu
Melaka
1 Klinik Dr.Raimah & X-Ray 15 Klinik A Famosa
2 Klinik Keluarga Dr.Fauziah 16 Klinik Nik Amrah & Zaliha Sdn. Bhd
3 Klinik Khaw 17 Klinik Naharajan & Imaging Centre
4 Klinik Noh 18 Klinik Al Azhim
5 Klinik Perubatan Chan 19 Klinik Chin
6 The Merican Dispensary 20 Klinik Tampin
7 Klinik Masjid Tanah 21 Klinik Noor Shila
8 Poliklinik Medic 22 Kelinik Ayer Keroh
9 Klinik Kok Dan Segeri 23 Kelinik Malin Tengkera Sdn. Bhd
10 Klinik Dr Adam 24 Klinik Sohvindir
11 Klinik Ummi 25 Bukit Rambai Health Farm
12 Klinik Dr Halim Sdn Bhd 26 Kelinik Malin
13 Klinik Rohani 27 Kelinik Malin
14 Klinik Maiza 28 Klinik Cheng
Participants of NMCS 2010