March 2011
© Ministry of Health Malaysia
Published by:
The National Healthcare Statistics Initiative (NHSI) 3rd Floor, MMA House
124, Jalan Pahang 53000 Kuala Lumpur Malaysia
Tel. : (603) 40439 300
Fax : (603) 40439 400
e-mail : [email protected]
Website : http://www.crc.gov.my/nhsi
This report is copyrighted. Reproduction and dissemination of this report in part or in whole for research, educational or other non commercial purposes are authorized without any prior written permission from the copyright holders provided the source is fully acknowledged. Suggested citation is Clinical Research Centre, National Medical Device Statistics Kuala Lumpur 2011
This report is also published electronically on the website of the National Healthcare Statistics Initiative at: http://www.crc.gov.my/nhsi
Funding:
The National Healthcare Statistics Initiative is funded by a grant from the Ministry of Health Malaysia (MRG Grant Number NMRR-09-842-4718)
Please note that there is the potential for minor corrections of data in this report. Please check the online version at
PREFACE
As we progress into the future, the role of medical devices in the diagnosis of diseases and administration of therapy is growing by leaps and bounds. Over the past century, many new innovations and improvements in technology have been created making medical devices almost indispensable in patient care. The increasing use and dependence on devices in diagnosing and managing patients has created the need to assess availability and distribution of medical devices in this country.
The National Medical Device Survey (NMDS) was designed to identify the supply, procurement, and utilisation of medical devices to ensure equitable health to all Malaysians. This collaborative effort between the Medical Device Bureau, Engineering Division and Clinical Research Centre also aims to determine whether the available devices are actually meeting the current needs of healthcare providers and patients. NMDS is part of the umbrella project, the National Healthcare Statistics Initiative that collects data on the various components of the national healthcare system.
This is indeed not an effort in isolation, in 2007 WHO conducted the Priority Medical Devices project with a similar aim albeit with an extended worldwide scope. The gaps between need and supply of medical devices in several high-burden diseases in countries with varying development status were studied. Our initiative is indeed in line with the WHO strategic objective of ensuring improved access, quality and use of medical devices.
The wide array of devices that span from basic non-active devices such as hospitals beds and stethoscopes to high cost, high technology devices such as Positron Emission Tomography scans made the task of identifying devices to be included an arduous one. Reasoning for the need to study both ends of the spectrum with all its in-betweens cannot be denied however this report focuses on non-invasive active devices that have a strong importance in 12 major disciplines.
Much effort has gone into the collection of data, corroboration with external sources and analyses to produce this report. To all agencies and institutions that have cooperated in this study, I thank you and am pleased that the objectives of this study have been met.
... Dato’ Dr. Hasan Abdul Rahman
CONTENTS
PREFACE I
ACKNOWLEDGEMENTS III
ABOUT THE NATIONAL MEDICAL DEVICE SURVEY IV
NATIONAL MEDICAL DEVICE SURVEY PROJECT TEAM VI
MEMBERS OF NATIONAL MEDICAL DEVICE SURVEY EXPERT PANELS VII
NMDS STUDY METHODOLOGY IX
ABBREVIATIONS XII
CHAPTER 1 : OVERVIEW ON MEDICAL DEVICES IN MALAYSIAN HOSPITALS 1
CHAPTER 2 : RADIOLOGY DEVICES IN MALAYSIAN HOSPITALS 3
CHAPTER 3 : NUCLEAR MEDICINE DEVICES IN MALAYSIAN HOSPITALS 9
CHAPTER 4 : ONCOLOGY DEVICES IN MALAYSIAN HOSPITALS 13
CHAPTER 5 : ANAESTHESIOLOGY & INTENSIVE CARE MEDICAL DEVICES IN MALAYSIAN HOSPITALS 17
CHAPTER 6 : OBSTETRICS AND GYNAECOLOGY DEVICES IN MALAYSIAN HOSPITALS 23
CHAPTER 7 : NEUROLOGY DEVICES IN MALAYSIAN HOSPITALS 27
CHAPTER 8 : CARDIOLOGY DEVICES IN MALAYASIAN HOSPITALS 29
CHAPTER 9 : NEPHROLOGY DEVICES IN MALAYSIA 33
CHAPTER 10 : DERMATOLOGY DEVICES IN MALAYSIAN HOSPITALS 37
CHAPTER 11 : OPHTHALMOLOGY DEVICES IN MALAYSIAN HOSPITALS 43
CHAPTER 12 : EMERGENCY AND TRAUMA DEVICES IN MALAYSIAN HOSPITALS 47
CHAPTER 13 : NEONATAL INTENSIVE CARE DEVICES IN MALAYSIAN HOSPITALS 49
ACKNOWLEDGEMENTS
The National Medical Device Survey Team would like to thank the following for their participation, assistance, support or contribution:
• Director General of Health, Malaysia
• Deputy Director General of Health (Research and Technical Support), Ministry of Health (MOH)
• Deputy Director General of Health (Medical ), MOH
• Deputy Director General of Health (Public Health), MOH
• Director, Engineering Services Division, MOH
• Director , Medical Device Bureau, MOH
• Director , Planning and Development Division, MOH
• Director, Clinical Research Centre (CRC), MOH
• Heads of Clinical Services, MOH
• All participating public and private hospitals that provided medical devices data
• University of Malaya Medical Centre, Hospital Universiti Kebangsaan Malaysia and Hospital Universiti Sains Malaysia
• Faber Medi-Serve Sdn Bhd, Pantai Medivest Sdn Bhd and Radicare Sdn Bhd
• National Renal Registry
• Members of NMDS Expert Panels who helped write this report
• All who have supported or contributed to the success of the NMDS and this report
Datuk Dr Noor Hisham Abdullah
Principal Investigator
Dr Lim Teck Onn
Principal Co-Investigator
National Medical Device Survey Team
ABOUT THE NATIONAL MEDICAL DEVICE SURVEY
Definition of Medical Device
The Global Harmonization Task Force (GHTF), a collaboration of multi-national medical device regulatory authorities and the regulated industry, defines medical device as any instrument, machine, apparatus, implement, appliance, implant, in vitro reagent or calibrator, software, material or other similar or related article1 which:
a. Is intended by the manufacturer to be used, alone or in combination, for human beings for one or more of the specific purpose(s) of:
• diagnosis, prevention, monitoring, treatment or alleviation of disease
• diagnosis, monitoring, treatment, alleviation of or compensation for an injury
• investigation, replacement, modification, or support of the anatomy or of a physiological process
• supporting or sustaining life
• control of conception
• disinfection of medical devices
• providing information for medical or diagnostic purposes by means of in vitro examination of specimens derived from the human body
b. Does not achieve its primary intended action in or on the human body by pharmacological, immunological or metabolic means, but which may
be assisted in its intended function by such means.
Hence, functions of medical devices extend from disease diagnosis to treatment, inclusive of disease prevention, monitoring, management of conditions and diseases, health promotion as well as alleviation of functioning disabilities. It is no wonder that in the past century, medical devices has become a crucial aspect of healthcare, to the workforce and the healthcare establishments. Table 1.1 lists its various scientific breakthroughs.
Table 1.1 From the most rudimentary early stethoscope to the current Positron Emission Tomography machines, medical devices have come a long way. Medical practice is becoming increasingly dependent on these devices.2
YEAR INVENTIONS / BREAKTHROUGHS KEY INVENTOR
1800 – 1850 Stethoscopes,laryngoscopes,opthalmoscopes
-1895 Xray Wilhelm Roentgen
1903 Electrocardiogram machine Willem Einthoven
1927 First modern respirator Philip Drinker
1945 First Kidney Dialysis Machine Willem Kollf
1950 First hip replacement Austin Moore
1951 First commercially available artificial heart valve Miles Edwards
The objectives – Why a survey on medical devices?
Due to the significant contributions of medical devices to healthcare, national and cross-national surveys were carried out by various countries or international organisations, particularly on high-end and expensive devices, such as imaging and nuclear devices (Table 1.2).
Table 1.2 Several national and international surveys on medical devices outside of Malaysia
YEAR NAME OF REPORT COUNTRY / ORGANISATION SCOPE
2007 Medical Imaging in Canada3 Canada Imaging Devices
2008 Heart Rhythm Devices: UK National Survey4 UK Implantable heart devices
2009 Organisation for Economic Cooperation and Development5
2010 Medical Devices: Managing the Mismatch2 WHO Developing countries
In Malaysia, the first National Medical Device Survey (NMDS) was launched in 2007. The primary objective of NMDS is to quantify the present state and time trends of selected medical devices in the country. All our results were circulated among the various stakeholders, especially policymakers and clinicians, with the hope that these findings can serve as a guide for resources planning and allocation. Meanwhile, to keep the general public, i.e. the end users, updated on the state of this issue, our full report is available at CRC website (http://www.crc.gov.my)
The Malaysian Statistics on Medical Devices report
In 2009, we implemented the medical devices report as part of a holistic National Healthcare Statistics Initiative (NHSI). In NMDS 2009, key medical devices were reported according to their medical practice specialties with input from consultants and practitioners in the respective fields. All the medical devices reported were from private and public hospitals. Availability and distribution of the devices were reflected by the number of devices reported by these hospitals and converted to the density per million population to allow more meaningful inter-state comparison. Where appropriate, the results were also compared with the studies listed in Table 1.2.
References:
1. GHTF Study Group 1. Information Document Concerning the Definition of the Term “Medical Device”. Global Harmonization Task Force. 2000.
2. World Health Organization. Medical Devices: Managing the Mismatch. WHO Priority Medical Devices. WHO Press; 2010.
3. Canadian Institute for Health Information, Medical Imaging in Canada, 2007 (Ottawa, Ont.: CIHI, 2008).
4. Central Cardiac Audit Database. Heart Rhythm Devices: UK National Survey. UK: Central Cardiac Audit Database 2008.
NATIONAL MEDICAL DEVICE SURVEY PROJECT TEAM
PRINCIPAL INVESTIGATOR DATUK DR NOOR HISHAM ABDULLAH
PRINCIPAL CO-INVESTIGATOR DR LIM TECK ONN
CO-INVESTIGATORS
MR ZAMANE ABDUL RAHMAN DR NOORAINI BABA
DR MD KHADZIR SHEIKH AHMAD
PROJECT COORDINATOR DR SHEAMINI SIVASAMPU
PROJECT LIASON OFFICER MR AHMAD SHARIFF HAMBALI
PROJECT MANAGERS DR ARIZA ZAKARIA (JULY 2009-JUNE 2010)
DR JETHANANDA
SURVEY COORDINATOR MR LEON HO LIP MAN
RESEARCH OFFICER MS NABILAH BT MAMAT KHALID
STATISTICIAN DR HOO LING PI
DATABASE DEVELOPERS / ADMINISTRATORS
MEMBERS OF THE NATlONAL MEDICAL DEVICE SURVEY EXPERT PANELS
RADIOLOGY
EXPERT PANEL INSTITUTION
Datin Dr Zaharah Musa Hospital Selayang
Dr Fatimah Othman Hospital Putrajaya
Dr Sheamini Sivasampu Clinical Research Centre, Ministry of Health
NUCLEAR MEDICINE
EXPERT PANEL INSTITUTION
Dato’ Dr Mohamed Ali Abdul Khader Hospital Pulau Pinang
Dr Lee Boon Nang Hospital Kuala Lumpur
Mr Lim Ka Keat Clinical Research Centre, Ministry of Health
ONCOLOGY
EXPERT PANEL INSTITUTION
Dr Gerard Lim Chin Chye Hospital Kuala Lumpur
Mr Mohd Azhar Musa Hospital Kuala Lumpur
Mr Leon Ho Lip Man Clinical Research Centre, Ministry of Health
ANAESTHESIOLOGY
EXPERT PANEL INSTITUTION
Dr Mary Cardosa Hospital Selayang
Dr Abu Bakar Ahmad Hospital Selayang
Dr Noorsila Abdul Razak Hospital Serdang
Ms Nabilah Mamat Khalid Clinical Research Centre, Ministry of Health
OBSTETRICS AND GYNAECOLOGY
EXPERT PANEL INSTITUTION
Dr Ravichandran Jeganathan Hospital Sultanah Aminah Johor Bahru
Dr Ng Poh Yen Hospital Kuala Lumpur
Dr Sharmila Saraswathy Hospital Kuala Lumpur
Mr Lim Ka Keat Clinical Research Centre, Ministry of Health
NEUROLOGY
EXPERT PANEL INSTITUTION
Dato Dr Md. Hanip Rafia Hospital Kuala Lumpur
Dr Ooi Phaik Yee Hospital Kuala Lumpur
Mr Zulkifli Abdul Salam Hospital Kuala Lumpur
CARDIOLOGY
EXPERT PANEL INSTITUTION
Dato’ Dr Omar Ismail Hospital Pulau Pinang
Dr Abdul Kahar Ghapar Hospital Serdang
Dr Abdul Muiz Jasid Hospital Serdang
Dr Arif Mohd. Noor Hospital Serdang
Prof Dr Wan Azman Wan Ahmad University Malaya Medical Centre
Mr Lim Ka Keat Clinical Research Centre, Ministry of Health
NEPHROLOGY
EXPERT PANEL INSTITUTION
Dato’ Dr Ghazali Ahmad Kutty Hospital Kuala Lumpur
Dr Shahnaz Shah Firdaus Khan Hospital Tengku Ampuan Rahimah
Ms Hazimah Hashim Clinical Research Centre, Ministry of Health
Ms Lee Day Guat National Renal Registry
DERMATOLOGY
EXPERT PANEL INSTITUTION
Datin Dr Asmah Johar Hospital Kuala Lumpur
Dr Roshidah Baba Hospital Melaka
Dr Chang Choong Chor Hospital Kuala Lumpur
Dr Noor Zalmy Mohd Ali Azizan Hospital Kuala Lumpur
Dr Yung Chen Lin Clinical Research Centre, Ministry of Health
OPHTHALMOLOGY
EXPERT PANEL INSTITUTION
Dr. Chandramalar T. Santhirathelagan Hospital Sungai Buloh
Dr Shamala A. Retnasabapathy Hospital Sungai Buloh
Dr Jethananda Clinical Research Centre, Ministry of Health
EMERGENCY AND TRAUMA
EXPERT PANEL INSTITUTION
Dr Sabariah Faizah Jamaluddin Hospital Sungai Buloh
Dr Ridzuan Dato’ Mohd. Isa Hospital Ampang
Dr Khairul Nizam Hassan Hospital Putrajaya
Dr Jethananda Clinical Research Centre, Ministry of Health
NEONATOLOGY
EXPERT PANEL INSTITUTION
Dr. Irene Cheah Guat Sim Hospital Kuala Lumpur
Dr Neoh Siew Hong T Hospital Kuala Lumpur
NMDS STUDY METHODOLOGY
Survey operations and data collection
The Clinical Research Centre (CRC) was the data collection agency for the NMDS survey. The CRC together with input from various specialty groups developed the survey operation procedures, designed, printed, and distributed all field manuals and Case Report Forms (CRF) for the survey. The Healthcare Statistics Unit within the CRC was responsible for the daily operations of the survey, the training of field staff and trouble-shooting, whenever there were queries. For this round of the survey, the requested fields on devices were incorporated into section 6 of the National Healthcare Establishments and Workforce Survey (NHEWS) forms for the hospital and primary care.
Sample design
The first task of the NMDS field operations consisted of determining sampled hospitals into NMDS. The sampling frame for hospitals was constructed from multiple sources including:
• Ministry of Health’s listing of hospitals
• Cawangan Kawalan Amalan Perubatan Swasta (CKAPS)’s list of private hospitals
• Malaysian Medical and Health Directory
Hospital induction
Hospital induction is the process of getting sampled hospitals to participate in the survey.
It began with the distribution of letters of introduction to the hospital administrators or directors. Several relevant documents were enclosed with the letter as below:
• Information brochure on the NHEWS
• Surveyinstructionmanual
• AnendorsementletterfromtheDeputyDirectorGeneral(Medical)oftheMOHforpublichospitals
• AnendorsementletterfromtheDirectoroftheBahagianAmalanPerubatanforprivatehospitals.
Approximately 14 days after mailing the letter of introduction, a CRC staff called the hospital administrators to determine whether they have received the letter and enclosed materials. If they received the documents, the staff would have then encouraged them to respond to the survey and answered any of their queries.
All private hospitals were invited to attend the induction meeting held in the Institute for Health Management, Kuala Lumpur on 3rd July 2009.
During this meeting, the hospital representatives were briefed on the objective of the survey, data required and various data submission options. A hands-on training was also conducted to familiarise the participants with the online data submission system. Hospitals that were not represented during the induction meeting were contacted on a later date in an effort to include their participation and provide them with the relevant documents by mail.
Public hospitals and university hospitals which are under the Ministry of Higher Education were, however, briefed together during another set of meetings conducted nationwide (Details as below)
NO DATE LOCATION TARGETED HOSPITALS
1 25th January 2010 Ipoh, Perak From Perak
2 3rd February 2010 Alor Setar, Kedah From Kedah
3 4th February 2010 Kota Bharu, Kelantan From Kelantan
4 5th February 2010 Kuantan, Pahang From Pahang
5 8th February 2010 Johor Bharu, Johor From Johor
6 10th February 2010 Georgetown, Pulau Pinang From Pulau Pinang
7 10th February 2010 Kuching, Sarawak From Sarawak
8 12th February 2010 Kota Kinabalu, Sabah From Terengganu
9 12th February 2010 Seremban, Negeri Sembilan From Negeri Sembilan
10 1st March 2010 Kuala Terengganu From Terengganu
Data collection and quality control
Data collection for NMDS was authorised under the Private Healthcare Facilities and Services Act 1998. Participation, however, was voluntary. Data collected in the NMDS are consistent with the Data Protection Act 2010. All information collected is held in the strictest confidence according to law and research ethics guidelines.
Approval for the NHEWS protocol was granted by the MOH Research and Ethics Committee (MREC) in 2010.
Two data collection procedures were used in the survey. Respondents had the option of either mode of submission.
1. Submission of paper CRF
2. Electronic submission of data via eCRF
For both data collection procedures, an ongoing quality control program was conducted on the coding and entering of data. Approximately 10% of the CRFs were independently reviewed and data entry discrepancies resolved by the project team. Almost 100% of missing or out-of-range mandatory variables and auxiliary variables were resolved. Verification of certain outliers was done with the Source Data Providers (SDP) via verbal and written communication. An audit check of those who responded noted that more than 50% of the hospitals had not filled section 6 of the NHEWS.
Edit checks run and data cleaning
Edit checks to identify missing compulsory data, out of range values, inconsistency of data, invalid values and errors with de-duplication is performed periodically by the survey personnel through the data query module. Data cleaning was performed based on the results of edit checks.
Besides data from SDP, the survey also requested for data from the device concession companies such as Faber, Radicare and Tongkah Medivest to verify the authenticity of the device data received for NMDS as well as to complete incomplete details. Due to the difference in the metadata of all the different databases, data standardisation was performed to standardise the format of data to ease record matching. Data coding was also performed to standardise the specialties according to a standard list that will be used for the survey. Data de-duplication was performed to ensure that these source data are clean before record matching was done against the NMDS survey dataset.
Final Edit Check
Statistical Methods
In this report, the quantity of a device is expressed as in absolute count as well as in number per million inhabitants. The latter statistics are calculated as follows:
Where T is an estimate of the total quantity of the device available in the country, in the year under consideration, P is the mid-year population of Malaysia or the relevant geographic region where the survey was conducted.
T the total is estimated from the sample of relevant health care facilities as follows:
The total is estimated by T =
Σ
Wi TiWhere;
Ti is the value of the quantity of device available in the ith facility in the year
Wi is the sampling weight of the ith facility
Wi = (B/b) * (bi/ Ь)
Where B is total number of beds in the population, b is number of beds of the responding hospitals (sample), bi is number of beds in the ith facility,
and Ь the mean number of beds in the population.
The sampling weight for each sampling unit or unit of analysis, therefore, has the following
components:
1. Probability of selection
The basic weight is obtained by multiplying the reciprocals of the probability of selection at each step of sampling design.
2. Adjustment for non-response
ABBREVIATIONS
CT Computed Tomography
ICU Intensive Care Unit
MRI Magnetic Resonance Imaging
NHEWS National Healthcare Establishment and Workforce Survey
NMDS National Medical Device Survey
OECD Organisation of European Economic Cooperation and Development
O&G Obstetrics and Gynaecology
OT Operating Theatre
PTLB Per Thousand Live Birth
PMP Per Million Population
SDP Source Data Provider
SPECT Single Photon Emission Computed Tomography
WP Wilayah Persekutuan
CHAPTER 1
|
OVERVIEW ON MEDICAL DEVICES IN MALAYSIAN HOSPITALS
This publication focuses on key medical devices of 12 specialties. In general, most of the devices surveyed were concentrated in more developed parts of the country (e.g. Wilayah Persekutuan (WP) Kuala Lumpur, Selangor, Pulau Pinang).
Below are some interesting highlights from this publication:
• Radiology: Seven radiology devices were reported. Overall, these devices were lower in number and density compared with Organisation for
European Economic Cooperation and Development (OECD) countries. An exception was in Wilayah Persekutuan Kuala Lumpur, where certain devices were found to be of comparable levels.
• Nuclear: As a highly-specialised area, the devices were found in small numbers at tertiary centres, most of which were government hospitals.
• Oncology: Five oncology devices were surveyed. Similar to Nuclear Medicine devices, there were only a small number of oncology devices
distributed in main regional centres.
• Anaesthesiology: A total of 12 devices were analysed, based on their settings of use (Operating Theatre and Intensive Care Unit). The
numbers of OT devices from both public and private were almost equal. Government hospitals provided more ICU devices than their private counterparts.
• Obstetrics & Gynaecology: Seven devices were measured. All were reported in higher number in the private sector (except ultrasound and
cardiotocograph).
• Neurology: Three neurology devices were reported. Both public and private sector contributed similar numbers.
• Cardiology: Eleven cardiology devices were analysed. The devices were mostly available in the private sector except for nuclear cardiology
system.
• Nephrology: Only haemodialysis machine was analysed, with data obtained from the National Renal Registry. The overall growth rate of the
device was 115% from 2000–2005 and only 30% for the subsequent 5 years.
• Dermatology: Twelve dermatology devices were analysed. Out of these, only 3 (the laser system, intense pulse light and microdermabrasion)
were more available in private sector.
• Ophthalmology: Twelve devices were analysed. All of the devices except the slit lamp were more available in the private sector.
• Emergency and Trauma: Two devices were surveyed. Both devices seem to be more available in public than in private hospitals.
• Paediatrics: Thirteen devices were measured. Overall, the devices did not reach the recommended norms set by the Ministry of Health
CHAPTER 2
|
RADIOLOGY DEVICES IN MALAYSIAN HOSPITALS
Zaharah M1, Fatimah O2, Sivasampu S3
1. Hospital Selayang, 2. Hospital Putrajaya, 3. Clinical Research Centre, Ministry Of Health
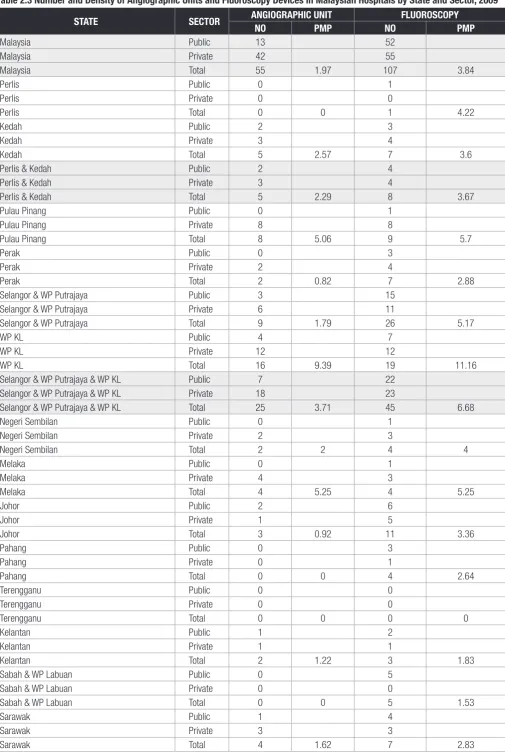
Summary: Distribution of 7 medical devices in radiology departments (i.e. angiography, fluoroscopy, conventional mammography, digital mammography, mammography with stereotaxic capabilities, Computed Tomography scanners and Magnetic Resonance Imaging units) were discussed and compared with OECD (Organisation for European Economic Cooperation and Development) countries. Responses were gathered from 191 out of 198 hospitals with radiology departments that had the above devices. Limitations of the data were also identified.
In this chapter, distribution of 7 medical devices in radiology departments was reported in number and density by state and sector. All of these devices were high-end, expensive, skill-intensive and knowledge intensive. Other commonly utilised radiological devices that were not included in the survey were general radiography, ultrasound, bone densitometer, mobile C arm equipment and orthopantomography.
As shown by Table 2.1, a total of 191 out of 198 hospitals with radiological services responded to our survey. Response rates were high with 100% and 92.5% response from 104 public institutions (Ministry of Health and University Hospitals) and 94 private institutions respectively.
Table 2.1 Distribution of Respondents and Non-respondents by Sector
Status Public Private Total
The angiographic units reported in this chapter were used by the radiologists for diagnostic and interventional procedures for the whole body excluding the heart. In the public sector, angiography diagnostic and interventional services are provided in the regional centres in the north, central, eastern and southern regions in Peninsular Malaysia and in Kuching. Its density was 1.97 per million population (pmp), lower than the
average of 5.4 pmp in Canada.1 On the other hand, availability of fluoroscopy machines was higher at a density of 3.84 pmp, with most of the
devices concentrated in Klang Valley (Selangor & WP Putrajaya and WP Kuala Lumpur) (Table 2.3).
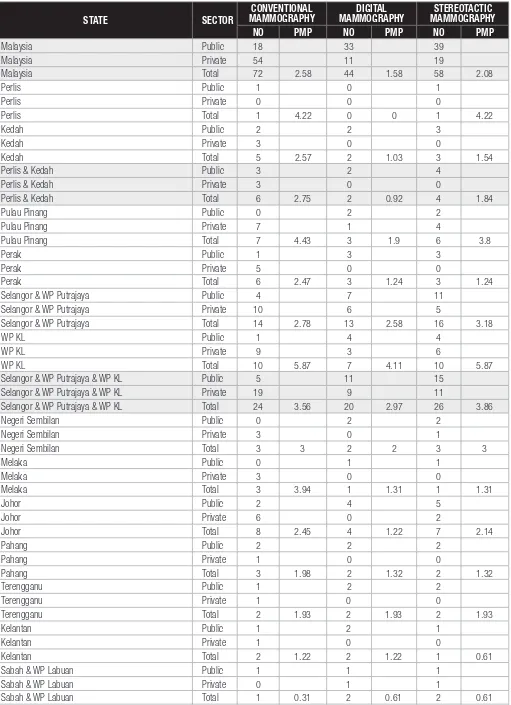
Mammography services were available in all MOH hospitals with resident radiologists. Until 2009, the majority of the mammography equipments in Malaysia were conventional analog systems (Table 2.4). However, keeping with global trends, MOH purchased 29 new full-field digital mammograms in 2009 making a total of 33 digital mammograms in MOH facilities. Overall density of mammography equipment was 6.24
pmp and this is much lower than the average in OECD countries (20.4 pmp) in 2004.1
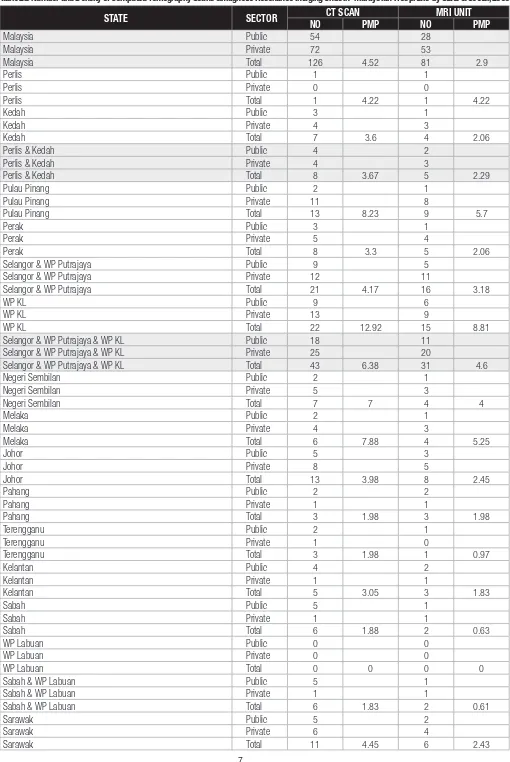
In the public sector, Computed Tomography (CT) scan machines were available in all the major MOH specialist hospitals. The overall density
of CT scanners was 4.52 pmp (Table 2.5) compared to an average of 22.8 pmp among OECD countries (2009).2
Magnetic Resonance Imaging (MRI) services are available in all state MOH hospitals as well as some of the major specialist hospitals. Overall density of MRI units throughout the country was 2.9pmp (Table 2.5); once again much lower than the average of 11.0 pmp in OECD countries (2009).2
Table 2.2 Comparison between Density of Devices in Wilayah Persekutuan Kuala Lumpur and Organisation for European Economic Cooperation average
DEVICES DENSITY IN WPKL, PMP OECD AVERAGE1,2, PMP
2009 20041 20092
Angiographic unit 9.4 5.4*
-Mammogram 15.9 20.4
-CT scan machine 12.9 20.4 22.8
MRI unit 8.8 8.6 11.0
*refers to average angiography suites in Canada
Limitations
1. The data is not representative of all medical devices available in the country. This is because data was collected only from hospitals with radiology services while data from stand alone private diagnostic imaging centres were not included.
2. Some of the devices were not exclusively used by the radiology department but were instead shared with other departments. For instance, fluoroscopy machines located in the ambulatory care centre in some hospitals were also being used by other departments (e.g. medical, surgical, urology) and could be reported in other chapters.
3. The total number of machines for the above specified modalities does not represent the actual number of machines that were functioning,
for example fluoroscopy machines in Taiping, Teluk Intan and Seberang Jaya although available were not functioning and were in line for replacements. It must be pointed out that despite temporary unavailability of services, patients from these hospitals were sent to the nearest MOH hospitals to undergo radiologic examination or services were purchased from the nearest private hospitals to ensure continuity and availability of care.
4. In comparisons with OECD data,our results, overall, reflect low availability of these high end imaging devices in Malaysia1, 2. However as
Table 2.3 Number and Density of Angiographic Units and Fluoroscopy Devices in Malaysian Hospitals by State and Sector, 2009
Perlis & Kedah Total 5 2.29 8 3.67
Pulau Pinang Public 0 1
Pulau Pinang Private 8 8
Pulau Pinang Total 8 5.06 9 5.7
Perak Public 0 3
Perak Private 2 4
Perak Total 2 0.82 7 2.88
Selangor & WP Putrajaya Public 3 15
Selangor & WP Putrajaya Private 6 11
Selangor & WP Putrajaya Total 9 1.79 26 5.17
WP KL Public 4 7
WP KL Private 12 12
WP KL Total 16 9.39 19 11.16
Selangor & WP Putrajaya & WP KL Public 7 22
Selangor & WP Putrajaya & WP KL Private 18 23
Selangor & WP Putrajaya & WP KL Total 25 3.71 45 6.68
Negeri Sembilan Public 0 1
Negeri Sembilan Private 2 3
Negeri Sembilan Total 2 2 4 4
Melaka Public 0 1
Sabah & WP Labuan Public 0 5
Sabah & WP Labuan Private 0 0
Sabah & WP Labuan Total 0 0 5 1.53
Sarawak Public 1 4
Sarawak Private 3 3
Table 2.4 Number and Density of Different Types of Mammography Devices in Malaysian Hospitals by State and Sector, 2009
Malaysia Total 72 2.58 44 1.58 58 2.08
Perlis Public 1 0 1
Perlis & Kedah Public 3 2 4
Perlis & Kedah Private 3 0 0
Perlis & Kedah Total 6 2.75 2 0.92 4 1.84
Pulau Pinang Public 0 2 2
Selangor & WP Putrajaya Public 4 7 11
Selangor & WP Putrajaya Private 10 6 5
Selangor & WP Putrajaya Total 14 2.78 13 2.58 16 3.18
WP KL Public 1 4 4
WP KL Private 9 3 6
WP KL Total 10 5.87 7 4.11 10 5.87
Selangor & WP Putrajaya & WP KL Public 5 11 15
Selangor & WP Putrajaya & WP KL Private 19 9 11
Selangor & WP Putrajaya & WP KL Total 24 3.56 20 2.97 26 3.86
Negeri Sembilan Public 0 2 2
Terengganu Total 2 1.93 2 1.93 2 1.93
Kelantan Public 1 2 1
Kelantan Private 1 0 0
Kelantan Total 2 1.22 2 1.22 1 0.61
Sabah & WP Labuan Public 1 1 1
Sabah & WP Labuan Private 0 1 1
Sabah & WP Labuan Total 1 0.31 2 0.61 2 0.61
Sarawak Public 2 1 1
Sarawak Private 5 0 0
Table 2.5 Number and Density of Computed Tomography Scans &Magnetic Resonance Imaging Units in Malaysian Hospitals by State & Sector, 2009
Perlis & Kedah Total 8 3.67 5 2.29
Pulau Pinang Public 2 1
Pulau Pinang Private 11 8
Pulau Pinang Total 13 8.23 9 5.7
Perak Public 3 1
Perak Private 5 4
Perak Total 8 3.3 5 2.06
Selangor & WP Putrajaya Public 9 5
Selangor & WP Putrajaya Private 12 11
Selangor & WP Putrajaya Total 21 4.17 16 3.18
WP KL Public 9 6
WP KL Private 13 9
WP KL Total 22 12.92 15 8.81
Selangor & WP Putrajaya & WP KL Public 18 11
Selangor & WP Putrajaya & WP KL Private 25 20
Selangor & WP Putrajaya & WP KL Total 43 6.38 31 4.6
Negeri Sembilan Public 2 1
Negeri Sembilan Private 5 3
Negeri Sembilan Total 7 7 4 4
Melaka Public 2 1
Sabah & WP Labuan Public 5 1
Sabah & WP Labuan Private 1 1
Sabah & WP Labuan Total 6 1.83 2 0.61
Sarawak Public 5 2
Sarawak Private 6 4
References
CHAPTER 3
|
NUCLEAR MEDICINE DEVICES IN MALAYSIAN HOSPITALS
Mohamed Ali AK1, Lee BN2, Lim KK3
1.Hospital Pulau Pinang, 2. Hospital Kuala Lumpur, 3. Clinical Research Centre, Ministry Of Health
Summary: Distribution of 4 key nuclear medicine devices was discussed. Most of these devices were only available in more populated states such as Pulau Pinang, Wilayah Persekutuan Kuala Lumpur, Selangor and Wilayah Persekutuan Putrajaya. Some devices were compared with similar devices in Canada. Limitations of the data were also described.
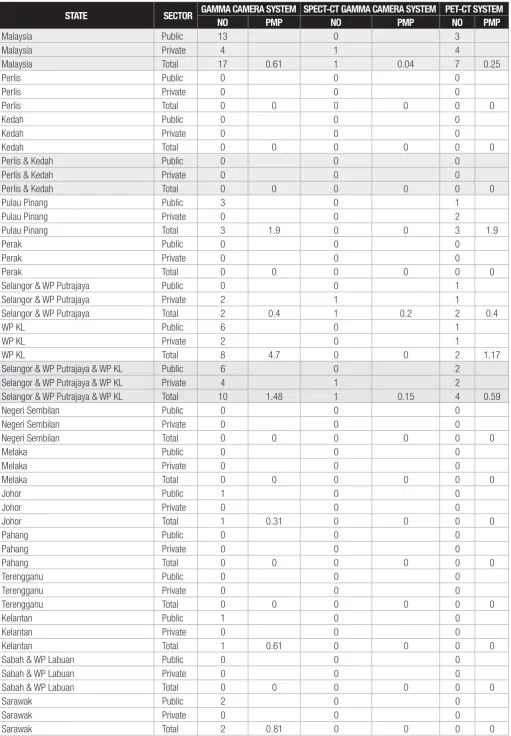
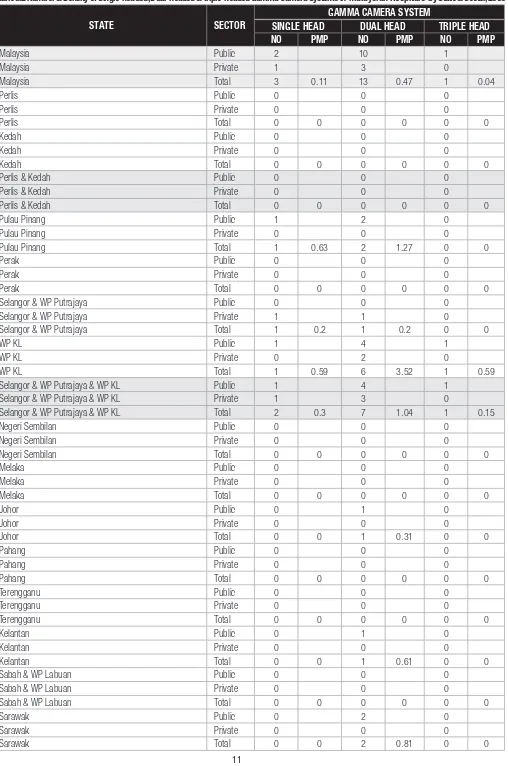
The NMDS 2009 identified the distribution and densities by state of 4 main nuclear medicine devices (namely gamma camera system,
SPECT-CT gamma camera system, PET-CT system and cyclotron system) throughout Malaysia.
The function of a gamma camera (including single-photon emission computed tomography or SPECT) is to register gamma-ray emissions from an isotope introduced into the patient’s body (injected, inhaled or ingested) as the camera rotates around the patient in a nuclear medicine procedure,
producing a cross sectional image.1 There were a total of 19 gamma camera systems in Malaysia in 2009 (not including SPECT-CT), and these
were mostly in the public sector (15 in public and 4 in private). However, the systems were only available in several states in the West Coast of Peninsula Malaysia (i.e. Pulau Pinang, Selangor & WP Putrajaya, WPKL, and Johor), Kelantan in the East Coast of the Peninsula and Sarawak in
East Malaysia. In Canada, 230 gamma cameras were available in its hospitals with a density of 19.0 pmp.1 On the other hand, only one SPECT-CT
gamma camera system was reported in the country (Table 3.1) compared with 35 in Canadian hospitals.1
Meanwhile, 6 PET-CT systems were available in the country in 2009 (0.22 pmp); out of which 3 were found in the state of Pulau Pinang, 1 in Selangor & Wilayah Persekutuan Putrajaya and 2 in Wilayah Persekutuan Kuala Lumpur. Four of the 6 systems were in private hospitals (Table
3.1). This was much lower than in Canada where 16 PET-CT scanners were reported in a similar survey.1 In 2004, the French Ministry of Health
authorised the standard of 1 PET/PET-CT scanner per 800000 population (or 1.25 pmp) in the country.1 However, the number of PET scanners
alone was not available for comparison in this aspect.
Table 3.2 illustrates the distribution of different sub-types of gamma camera systems in the country. Generally, there were 3 single-headed, 13 dual-headed and 1 triple-headed gamma camera systems; each made up 21.2%, 63.2% and 15.8% of the total systems available. This distribution mimics that in Canadian hospitals, where dual-head systems comprised the highest proportion (59%) while triple-head systems was the least available (3%).1
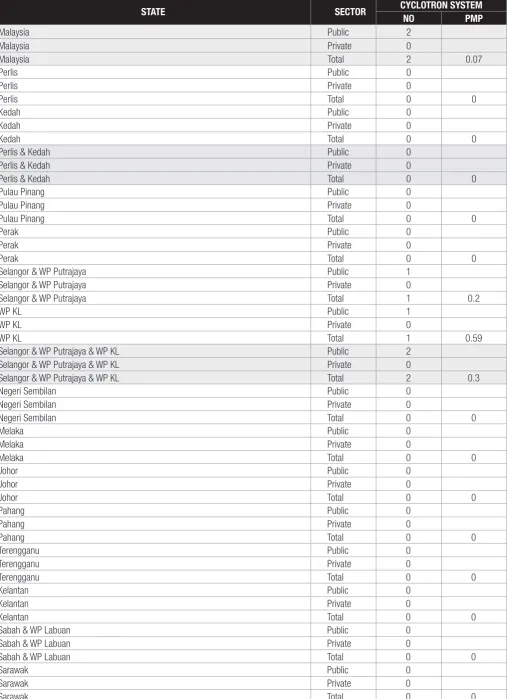
Two cyclotrons were available in the country in 2009, which was in WP KL and WP putrajaya (Table 3.3).
Limitations
1. Our data is not representative of all the nuclear medicine devices available in the country as they were collected only from hospitals and not free-standing private diagnostic centres.
Table 3.1 Number and Density of Gamma Camera Systems, Single Photon Emission Computed TomographyGamma Camera Systems and Positron Emission Tomography Systems in Malaysian Hospitals by State and Sector, 2009
STATE SECTOR GAMMA CAMERA SYSTEM SPECT-CT GAMMA CAMERA SYSTEM PET-CT SYSTEM
NO PMP NO PMP NO PMP
Malaysia Public 13 0 3
Malaysia Private 4 1 4
Malaysia Total 17 0.61 1 0.04 7 0.25
Perlis Public 0 0 0
Perlis & Kedah Public 0 0 0
Perlis & Kedah Private 0 0 0
Perlis & Kedah Total 0 0 0 0 0 0
Selangor & WP Putrajaya Public 0 0 1
Selangor & WP Putrajaya Private 2 1 1
Selangor & WP Putrajaya Total 2 0.4 1 0.2 2 0.4
WP KL Public 6 0 1
WP KL Private 2 0 1
WP KL Total 8 4.7 0 0 2 1.17
Selangor & WP Putrajaya & WP KL Public 6 0 2
Selangor & WP Putrajaya & WP KL Private 4 1 2
Selangor & WP Putrajaya & WP KL Total 10 1.48 1 0.15 4 0.59
Negeri Sembilan Public 0 0 0
Sabah & WP Labuan Public 0 0 0
Sabah & WP Labuan Private 0 0 0
Sabah & WP Labuan Total 0 0 0 0 0 0
Sarawak Public 2 0 0
Sarawak Private 0 0 0
Table 3.2 Number & Density of Single-headed, Dual-headed & Triple-headed Gamma Camera Systems in Malaysian Hospitals by State & Sector, 2009
Malaysia Total 3 0.11 13 0.47 1 0.04
Perlis Public 0 0 0
Perlis & Kedah Public 0 0 0
Perlis & Kedah Private 0 0 0
Perlis & Kedah Total 0 0 0 0 0 0
Selangor & WP Putrajaya Public 0 0 0
Selangor & WP Putrajaya Private 1 1 0
Selangor & WP Putrajaya Total 1 0.2 1 0.2 0 0
WP KL Public 1 4 1
WP KL Private 0 2 0
WP KL Total 1 0.59 6 3.52 1 0.59
Selangor & WP Putrajaya & WP KL Public 1 4 1
Selangor & WP Putrajaya & WP KL Private 1 3 0
Selangor & WP Putrajaya & WP KL Total 2 0.3 7 1.04 1 0.15
Negeri Sembilan Public 0 0 0
Sabah & WP Labuan Public 0 0 0
Sabah & WP Labuan Private 0 0 0
Sabah & WP Labuan Total 0 0 0 0 0 0
Sarawak Public 0 2 0
Sarawak Private 0 0 0
Table 3.3: Number and Density of Cyclotrons by State and Sector among Hospitals in Malaysia, 2009
Selangor & WP Putrajaya Total 1 0.2
WP KL Public 1
WP KL Private 0
WP KL Total 1 0.59
Selangor & WP Putrajaya & WP KL Public 2
Selangor & WP Putrajaya & WP KL Private 0
Selangor & WP Putrajaya & WP KL Total 2 0.3
Negeri Sembilan Public 0
Sabah & WP Labuan Total 0 0
Sarawak Public 0
Sarawak Private 0
Sarawak Total 0 0
Reference
CHAPTER 4
|
ONCOLOGY DEVICES IN MALAYSIAN HOSPITALS
Lim GCC1, Musa A1, Ho LLM2
1.Hospital Kuala Lumpur, 2. Clinical Research Centre, Ministry Of Health
Summary: A total of 5 devices utilised by oncology departments in Malaysia were described and analysed. More devices were concentrated in the Klang Valley and Penang. This is due to the regionalisation of government radiotherapy facilities in the northern, southern, eastern regions. In future, the devices have to be more up to date, accessible, and affordable to better serve the country’s population.
The age-standardised rate of cancer incidence for Peninsular Malaysia in 2006 was 128.6 per 100000 in males and 135.7 per 100000 in
females withmalignant neoplasm denoted as one of the five principal causes of national mortality. Cancer was the third most common principal
cause of death in Ministry of Health Hospitals in Malaysia in 2006, and it contributed to 10.59 % of all deaths in these hospitals.1,2
The distribution of the machines was skewed towards the more developed parts of the country such as Kuala Lumpur, Penang and Selangor. In
the northern states which include Perlis, Kedah, Penang and Perak, most devices were concentrated in Penang (5 linear accelerators and 1
brachytherapy system). Similar trends were seen in the Southern states (Johor and Melaka) and East Coast states (Terengganu, Pahang and Kelantan) with devices concentrated in Johor and Kelantan respectively. This is due to the regionalisation of government radiotherapy facilities in Penang for the northern region, Johor for the southern region and Kelantan for the eastern regions in the Peninsular, in Sarawak and in Sabah. This was designed as such to improve the accessibility of patients in these regions. In the central region (Kuala Lumpur, Selangor and Negeri Sembilan), Kuala Lumpur had the most number of devices with one third of linear accelerators and brachytherapy systems in Malaysia. This is because Kuala
Lumpur is the most densely populated area in Malaysia as well as the area with the most number of private hospitals..3
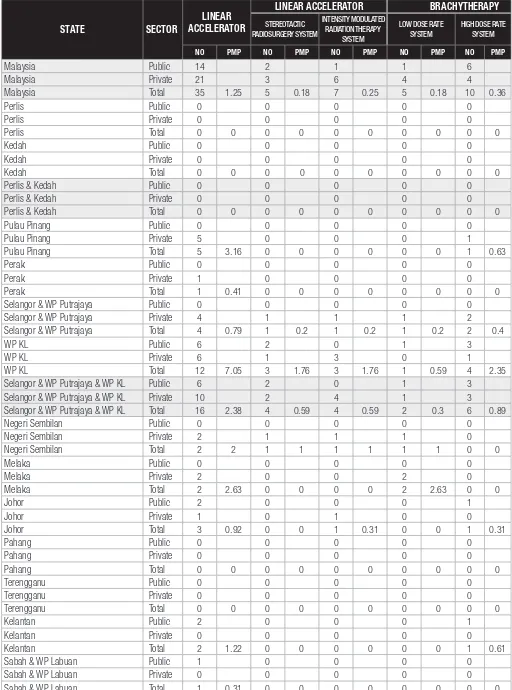
There is still room for much improvement in the machine to population ratio in Malaysia. For example, the ratio for linear accelerators in 2007
was 1.05 pmp which increased to 1.25 pmp in 2009.4 However, according to international standards, this was still far from adequate. In 2001,
the National Strategic Plan for Radiation oncology (Australia) recommended a linear accelerator to population ratio of 6.47 pmp5. Hence, not only
does the number of these devices need to be increased but also equitable distribution of these devices to regions such as the East Coast and East Malaysia needs to be addressed.
In conclusion, with the rapid development of technology and increasing numbers of patients, the frontiers of radiotherapy are continually expanding. The capacity of these machines in carrying out sophisticated treatment will have to be continually reviewed while conventional treatment of the most common diseases must be adequate in terms of accessibility and affordability to the population.
Table 4.1 Distribution of Respondents by Sectors in Malaysia, 2009
Table 4.2 Number and Density of Different Linear Accelerator Systems & Different Brachytherapy Systems in Malaysian Hospitals by
Malaysia Private 21 3 6 4 4
Malaysia Total 35 1.25 5 0.18 7 0.25 5 0.18 10 0.36
Selangor & WP Putrajaya Public 0 0 0 0 0
Selangor & WP Putrajaya Private 4 1 1 1 2
Selangor & WP Putrajaya Total 4 0.79 1 0.2 1 0.2 1 0.2 2 0.4
WP KL Public 6 2 0 1 3
WP KL Private 6 1 3 0 1
WP KL Total 12 7.05 3 1.76 3 1.76 1 0.59 4 2.35
Selangor & WP Putrajaya & WP KL Public 6 2 0 1 3
Selangor & WP Putrajaya & WP KL Private 10 2 4 1 3
Selangor & WP Putrajaya & WP KL Total 16 2.38 4 0.59 4 0.59 2 0.3 6 0.89
Negeri Sembilan Public 0 0 0 0 0
Negeri Sembilan Private 2 1 1 1 0
Negeri Sembilan Total 2 2 1 1 1 1 1 1 0 0
Terengganu Public 0 0 0 0 0
Terengganu Private 0 0 0 0 0
References
1. Annual Report 2006, Ministry of Health, Malaysia.
2. Omar ZA, Ali ZM. Tamin NSI (Eds). Malaysian Cancer Statistics Cancer Data and Figure. Peninsular Malaysia 2006. National Cancer Registry: Kuala Lumpur; 2009
3. Population, Household and Living Quarters (2010), Department of Statistics, Malaysia
4. Ariza Z, Faridah A, Lim T.O. Malaysian Statistics on Medical Devices 2007. Kuala Lumpur; 2008
CHAPTER 5
|
ANAESTHESIOLOGY & INTENSIVE CARE MEDICAL DEVICES IN MALAYSIAN HOSPITALS
Norsila AR1. Abu Bakar A2, Cardosa MS2
1. Hospital Serdang, 2. Hospital Selayang
Summary: A total of 12 devices used by the anaesthesiology and intensive care department were analysed in this chapter. In terms of distribution, the anaesthesia workstation was concentrated in the urban areas. The number of intensive care unit ventilators in public hospitals was more than in private hospitals. The concentration of devices in the urban centres was due to the presence of subspeciality anaesthesiology services in urban tertiary hospitals. In the future, there is a need for surveys to link devices to frequency of their usage in hospitals.
Anaesthesia and intensive care are essential components of the services provided by the Ministry of Health to support other clinical disciplines and to provide adequate and appropriate care for patients undergoing surgery as well as for critically ill patients. Advances in surgery and surgical techniques, higher prevalence of chronic illnesses and greater public expectations add up to an increasing demand for comprehensive and efficient anaesthesiology and intensive care services in all major hospitals, either in the private or public sectors.
Scope of service
1. The Department of Anaesthesiology and Intensive Care provides peri-operative anaesthetic care and pain management for patients undergoing surgery or diagnostic procedures.
2. The Department also provides care for critically ill surgical or medical patients who require intensive monitoring, ventilation and other interventions, including advanced life support.
The availability of medical devices should reflect the components of anaesthesia and intensive care services provided, which vary depending on the category of the hospital. While all hospitals surveyed would provide perioperative anaesthesia services, intensive care services and acute pain management services, not all would provide subspecialty anaesthesia services (e.g. paediatric anaesthesia, cardiac anaesthesia). This survey only included devices relevant for anaesthesia and intensive care services and did not include pain management devices.
Data was collected from 244 hospitals in total, of which 128 (52.5%) were public and 116 (48.5%) private; representing a response rate of 99.2% for public hospitals and 82.3% for private hospitals.
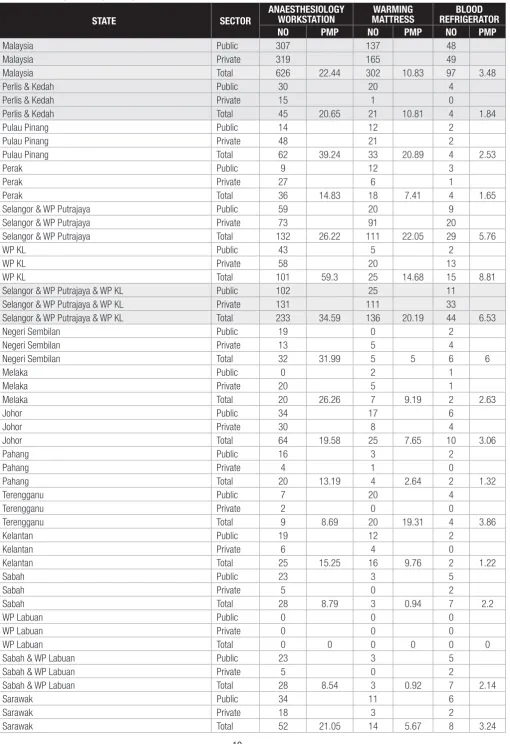
The data in Table 5.1 shows that both government and private hospitals are moving towards Integrated Anaesthesiology workstations, thereby upgrading the anaesthesiology service in the Operation Theatre.
The number of anaesthesiology workstations in public and private hospitals was almost equal. However, the distribution was concentrated in states where there were more subspecialty anaesthesia services (such as in Klang Valley). This is probably in line with advancements in surgery and rapid development of surgical subspecialties which require the support of a comprehensive and efficient subspecialty anaesthesiology service with modern equipment.
Blood Refrigerators and Warming Mattresses are considered as standard devices in the operation theatre. The data again showed that the numbers were more in states where there were heavier workloads and subspeciality anaesthesia services.
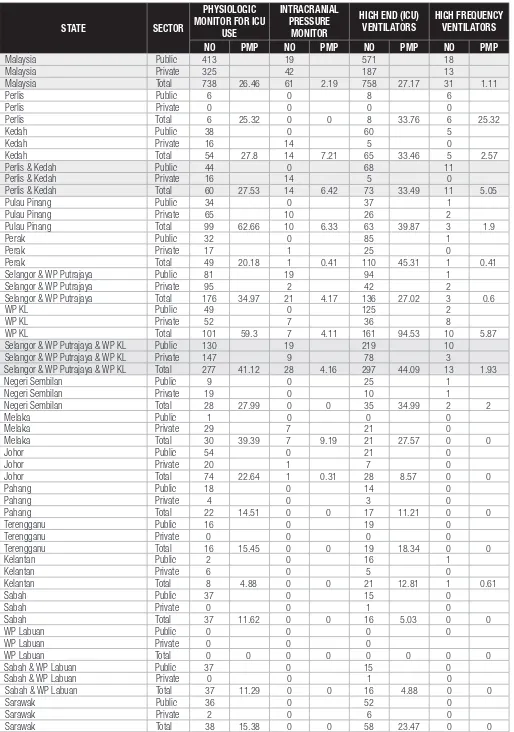
Table 5.2 shows the medical devices in intensive care units (ICUs). Physiologic monitors for ICU and High End Ventilators were available in both the public and private hospitals. It is interesting to note that while the number of physiologic monitors in private hospitals was almost equal to that in public hospitals, the number of ICU ventilators was much less (1.6 ventilators per private hospital compared with 4.5 ventilators per public hospital). This probably reflects the level of intensive care service provided in private hospitals to be different from that in public hospitals. There is again a maldistribution of these devices in terms of number of devices per million population – the data shows that there was a much higher concentration in developed areas like the Klang Valley and Penang, while Sabah and Kelantan were lagging behind.
The distribution of the Intracranial Pressure Monitors and High Frequency ventilators were also concentrated in some states, most likely where there were subspecialty services like neurosurgery, neuroanaesthesia and paediatric intensive care.
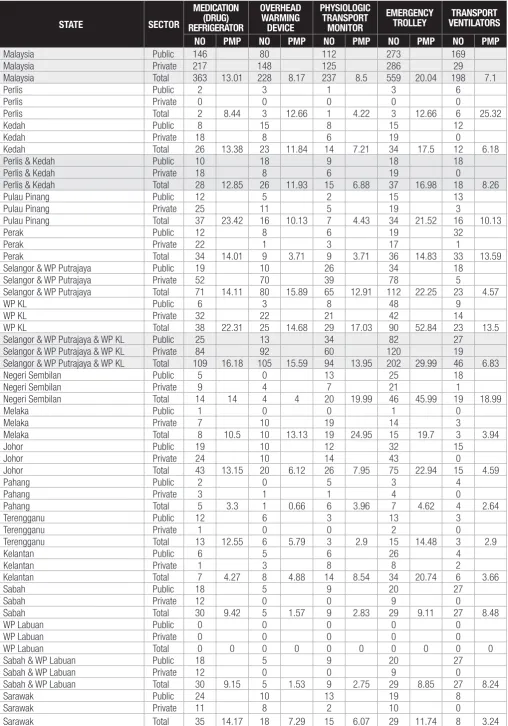
All the medical devices in Table 5.3 are considered as standard recommended devices for providing services in operation theatres and intensive care units. The data shows that all hospitals, whether public or private, fulfill the standard requirement. Overhead warming devices were more readily available in the private hospitals while transport ventilators were more available in public hospitals; again reflecting the different nature of services provided by the different sectors.
Limitations
1. Accuracy of the data may be compromised by the respondent’s understanding of terminologies, e.g. “Anaesthesia workstation” vs “Anaesthesia machine”.
Table 5.1 Number and Density of Anaesthesiology Workstations, Blood Refrigerators and Warming Mattresses in Operation Theatres in Malaysian Hospitals by State and Sector, 2009
STATE SECTOR
Malaysia Total 626 22.44 302 10.83 97 3.48
Perlis & Kedah Public 30 20 4
Perlis & Kedah Private 15 1 0
Perlis & Kedah Total 45 20.65 21 10.81 4 1.84
Pulau Pinang Public 14 12 2
Pulau Pinang Private 48 21 2
Pulau Pinang Total 62 39.24 33 20.89 4 2.53
Perak Public 9 12 3
Perak Private 27 6 1
Perak Total 36 14.83 18 7.41 4 1.65
Selangor & WP Putrajaya Public 59 20 9
Selangor & WP Putrajaya Private 73 91 20
Selangor & WP Putrajaya Total 132 26.22 111 22.05 29 5.76
WP KL Public 43 5 2
WP KL Private 58 20 13
WP KL Total 101 59.3 25 14.68 15 8.81
Selangor & WP Putrajaya & WP KL Public 102 25 11
Selangor & WP Putrajaya & WP KL Private 131 111 33
Selangor & WP Putrajaya & WP KL Total 233 34.59 136 20.19 44 6.53
Negeri Sembilan Public 19 0 2
Negeri Sembilan Private 13 5 4
Negeri Sembilan Total 32 31.99 5 5 6 6
Melaka Public 0 2 1
Melaka Private 20 5 1
Melaka Total 20 26.26 7 9.19 2 2.63
Johor Public 34 17 6
Johor Private 30 8 4
Johor Total 64 19.58 25 7.65 10 3.06
Pahang Public 16 3 2
Pahang Private 4 1 0
Pahang Total 20 13.19 4 2.64 2 1.32
Terengganu Public 7 20 4
Terengganu Private 2 0 0
Terengganu Total 9 8.69 20 19.31 4 3.86
Kelantan Public 19 12 2
Kelantan Private 6 4 0
Kelantan Total 25 15.25 16 9.76 2 1.22
Sabah Public 23 3 5
Sabah & WP Labuan Public 23 3 5
Sabah & WP Labuan Private 5 0 2
Sabah & WP Labuan Total 28 8.54 3 0.92 7 2.14
Sarawak Public 34 11 6
Sarawak Private 18 3 2
Table 5.2 Number and Density of Physiologic Monitors, Intracranial Pressure Monitors, High-End Ventilators and High Frequency Ventilators in Intensive Care Units in Malaysian Hospitals by State and Sector, 2009
STATE SECTOR
Malaysia Total 738 26.46 61 2.19 758 27.17 31 1.11
Perlis Public 6 0 8 6
Perlis Private 0 0 0 0
Perlis Total 6 25.32 0 0 8 33.76 6 25.32
Kedah Public 38 0 60 5
Kedah Private 16 14 5 0
Kedah Total 54 27.8 14 7.21 65 33.46 5 2.57
Perlis & Kedah Public 44 0 68 11
Perlis & Kedah Private 16 14 5 0
Perlis & Kedah Total 60 27.53 14 6.42 73 33.49 11 5.05
Pulau Pinang Public 34 0 37 1
Pulau Pinang Private 65 10 26 2
Pulau Pinang Total 99 62.66 10 6.33 63 39.87 3 1.9
Perak Public 32 0 85 1
Perak Private 17 1 25 0
Perak Total 49 20.18 1 0.41 110 45.31 1 0.41
Selangor & WP Putrajaya Public 81 19 94 1
Selangor & WP Putrajaya Private 95 2 42 2
Selangor & WP Putrajaya Total 176 34.97 21 4.17 136 27.02 3 0.6
WP KL Public 49 0 125 2
WP KL Private 52 7 36 8
WP KL Total 101 59.3 7 4.11 161 94.53 10 5.87
Selangor & WP Putrajaya & WP KL Public 130 19 219 10
Selangor & WP Putrajaya & WP KL Private 147 9 78 3
Selangor & WP Putrajaya & WP KL Total 277 41.12 28 4.16 297 44.09 13 1.93
Negeri Sembilan Public 9 0 25 1
Negeri Sembilan Private 19 0 10 1
Negeri Sembilan Total 28 27.99 0 0 35 34.99 2 2
Melaka Public 1 0 0 0
Terengganu Total 16 15.45 0 0 19 18.34 0 0
Kelantan Public 2 0 16 1
Sabah & WP Labuan Public 37 0 15 0
Sabah & WP Labuan Private 0 0 1 0
Sabah & WP Labuan Total 37 11.29 0 0 16 4.88 0 0
Sarawak Public 36 0 52 0
Sarawak Private 2 0 6 0
Table 5.3 Number and Density of Medication Refrigerators, Overhead Warming Devices, Physiologic Transport Monitors, Emergency Trolleys and Transport Ventilators in the Operating Theatre and Intensive Care Unit in Malaysian Hospitals by State and Sector, 2009
STATE SECTOR
Malaysia Public 146 80 112 273 169
Malaysia Private 217 148 125 286 29
Malaysia Total 363 13.01 228 8.17 237 8.5 559 20.04 198 7.1
Perlis Public 2 3 1 3 6
Perlis Private 0 0 0 0 0
Perlis Total 2 8.44 3 12.66 1 4.22 3 12.66 6 25.32
Kedah Public 8 15 8 15 12
Kedah Private 18 8 6 19 0
Kedah Total 26 13.38 23 11.84 14 7.21 34 17.5 12 6.18
Perlis & Kedah Public 10 18 9 18 18
Perlis & Kedah Private 18 8 6 19 0
Perlis & Kedah Total 28 12.85 26 11.93 15 6.88 37 16.98 18 8.26
Pulau Pinang Public 12 5 2 15 13
Pulau Pinang Private 25 11 5 19 3
Pulau Pinang Total 37 23.42 16 10.13 7 4.43 34 21.52 16 10.13
Perak Public 12 8 6 19 32
Perak Private 22 1 3 17 1
Perak Total 34 14.01 9 3.71 9 3.71 36 14.83 33 13.59
Selangor & WP Putrajaya Public 19 10 26 34 18
Selangor & WP Putrajaya Private 52 70 39 78 5
Selangor & WP Putrajaya Total 71 14.11 80 15.89 65 12.91 112 22.25 23 4.57
WP KL Public 6 3 8 48 9
WP KL Private 32 22 21 42 14
WP KL Total 38 22.31 25 14.68 29 17.03 90 52.84 23 13.5
Selangor & WP Putrajaya & WP KL Public 25 13 34 82 27
Selangor & WP Putrajaya & WP KL Private 84 92 60 120 19
Selangor & WP Putrajaya & WP KL Total 109 16.18 105 15.59 94 13.95 202 29.99 46 6.83
Negeri Sembilan Public 5 0 13 25 18
Negeri Sembilan Private 9 4 7 21 1
Negeri Sembilan Total 14 14 4 4 20 19.99 46 45.99 19 18.99
Melaka Public 1 0 0 1 0
Melaka Private 7 10 19 14 3
Melaka Total 8 10.5 10 13.13 19 24.95 15 19.7 3 3.94
Johor Public 19 10 12 32 15
Johor Private 24 10 14 43 0
Johor Total 43 13.15 20 6.12 26 7.95 75 22.94 15 4.59
Pahang Public 2 0 5 3 4
Pahang Private 3 1 1 4 0
Pahang Total 5 3.3 1 0.66 6 3.96 7 4.62 4 2.64
Terengganu Public 12 6 3 13 3
Terengganu Private 1 0 0 2 0
Terengganu Total 13 12.55 6 5.79 3 2.9 15 14.48 3 2.9
Kelantan Public 6 5 6 26 4
Kelantan Private 1 3 8 8 2
Kelantan Total 7 4.27 8 4.88 14 8.54 34 20.74 6 3.66
Sabah Public 18 5 9 20 27
Sabah & WP Labuan Public 18 5 9 20 27
Sabah & WP Labuan Private 12 0 0 9 0
Sabah & WP Labuan Total 30 9.15 5 1.53 9 2.75 29 8.85 27 8.24
Sarawak Public 24 10 13 19 8
Sarawak Private 11 8 2 10 0
CHAPTER 6
|
OBSTETRICS & GYNAECOLOGY (O&G) DEVICES IN MALAYSIAN HOSPITALS
Ng PY1, Sharmila S1, Ravichandran J2, Lim KK3
1.Hospital Kuala Lumpur, 2. Hospital Sultanah Aminah, Johor Bahru, 3. Clinical Research Centre, Ministry Of Health
Summary: This article describes the availability and distribution of 7 main obstetrics & gynaecology devices throughout the country. Most of the devices (except ultrasound and cardiotocograph machine) were found in higher numbers in the private sector. Among all the states, Selangor & WP Putrajaya had consistently reported the highest number for most of the devices in contrast to Perlis which often reported the lowest number. However, low densities (per million population) of the devices were commonly observed in the states of Sabah & WP Labuan, Terengganu and Pahang instead of Perlis.
The NMDS 2009 identified 7 main obstetrics & gynaecology (O&G) devices reflective of the extent of the services within the country. As shown in Table 6.1, almost all the public hospitals providing O&G services (95.4%) responded compared with only 73.0% of those in the private sector. Only functional devices available in these hospitals were taken into account in the report.
Table 6.1 Number of Respondents and Non-respondents by Sector
STATUS PUBLIC PRIVATE TOTAL
Ultrasound machines (USG) are used for imaging of uterus, ovaries, pelvic organs and presence of fetus either via the vagina (trans-vaginal ultrasound) or via the abdomen (trans-abdominal ultrasound). Table 6.2 shows that USG was widely available in the country, with higher number in the public (62.7%) than in the private sector (37.3%). This trend was consistent across all states except Pulau Pinang, WP KL and Selangor & WP Putrajaya, where the private sector contributed more USG to the service. While the data for public hospitals were believed to be reflective of the actual scenario, the general belief was that there was a possible under-reporting by the private sector in some states. For example, in the state of Perak where there were 14 private hospitals providing O&G services, only 7 USG were reported.
Overall, Selangor & WP Putrajaya reported the highest number of USG (130), followed by Johor (74) and Kedah (60) in contrast to Perlis, Melaka and Terengganu which recorded 7, 9, and 18 devices respectively. On the other hand, the density was the highest in Pulau Pinang, Kedah, and Perlis. The lowest density was found in Melaka, followed by Sabah & WP Labuan and Perak. Within the public sector, the number was highest in Selangor & WP Putrajaya (59), followed by Sarawak (46) and Sabah (42).
The function of a cardiotocograph (CTG) machine is to monitor the fetal heart during pregnancy. In contrast to the ultrasound machines, CTG
machines were more available in the public hospitals (60.6%) than in private hospitals. The highest number was reported in Selangor & WP Putrajaya (195), followed by Johor (121), Sarawak (111) and the lowest in Perlis (5). Meanwhile WP KL, Kedah and Sarawak had the three highest densities of the device. (Table 6.2)
Hysteroscope is a device used to directly visualise the uterine cavity. Its distribution was similar between public and private sectors (31 and 37 respectively), with the highest number recorded in Selangor & WP Putrajaya (17), WP KL (11) and Johor (10). On the contrary, there was only one in Perlis, Pahang and Kelantan each. The highest density was found in WP KL, followed by Perlis and Melaka.
Colposcope is used to magnify the uterine cervix to check for abnormality of the cervix. More than half (60.7%) of this device was found in the private sector. Interestingly, 6 states (namely Selangor & WP Putrajaya, Sarawak, WP KL, Kedah, Pulau Pinang and Johor) reported 9 – 11 units per state whereas all the other states reported less than 5 units each. None was available in Pahang. Pulau Pinang had the highest density of the device at 6.33 pmp.
Laparoscope is used for direct visualisation of the abdominal cavity through an incision. One hundred sixty laparoscopes were available in the country with only 30.6% in the public sector. Selangor & WP Putrajaya (49), WP KL (23) and Johor (20) had the highest number of laparoscopes in contrast to Perlis and Terengganu which only had one and two respectively. the lowest densities were observed in Sabah & WP Labuan (1.22 pmp) and Terengganu (1.93 pmp).
Two other specialised equipments available in O&G departments are the urodynamic machine and uroflowmeter. A urodynamic machine is
Limitations
1. It was difficult to quantify the number of equipments available by specialty as some of them were not exclusively utilised and kept in O&G departments. For example, urodynamic machines and uroflowmeter were also used for urology patients. In some hospitals, the machines were kept in the urology department and O&G patients were referred there when the machines were required. Therefore, there could be an underestimation of the total numbers utilised by O&G departments in our hospitals.
2. It was impossible to judge the deficiency or adequacy of these devices by looking at their numbers and densities alone without relating them to their rates of use. The method of self-reporting by respective hospitals also raised some doubts over the quality and reliability of the data as there was no control over who could provide the information.
3. Due to a much lower proportion of respondents from the private sector, statistical imputations made for the non-respondents could have caused inaccuracy in data for this sector.
Table 6.2 Number and Density of Ultrasounds and Cardiotocograph Machines in Malaysian Hospitals by State and Sector, 2009
STATE SECTOR ULTRASOUND MACHINE (USG) CARDIOTOCOGRAPH (CTG) MACHINE
NO PMP NO PMP
Pulau Pinang Total 54 34.18 66 41.77
Perak Public 35 36
Perak Private 7 23
Perak Total 42 17.3 59 24.3
Selangor & WP Putrajaya Public 59 92
Selangor & WP Putrajaya Private 71 103
Selangor & WP Putrajaya Total 130 25.83 195 38.74
WP KL Public 7 32
WP KL Private 30 63
WP KL Total 37 21.73 95 55.78
Negeri Sembilan Public 21 17
Negeri Sembilan Private 5 11
Negeri Sembilan Total 26 25.99 28 27.99
Melaka Public 8 22
Sabah & WP Labuan Public 42 30
Sabah & WP Labuan Private 8 12
Sabah & WP Labuan Total 50 15.25 42 12.81
Sarawak Public 46 97
Sarawak Private 6 14
Table 6.3 Number and Density of Hysteroscopes, Colposcopes and Laparoscopes in Malaysian Hospitals by State and Sector, 2009
STATE SECTOR HYSTEROSCOPE COLPOSCOPE LAPAROSCOPE
NO PMP NO PMP NO PMP
Malaysia Public 31 31 49
Malaysia Private 37 48 111
Malaysia Total 68 2.44 79 2.83 160 5.74
Perlis Public 1 1 1
Pulau Pinang Total 5 3.16 10 6.33 11 6.96
Perak Public 2 3 1
Perak Private 3 1 12
Perak Total 5 2.06 4 1.65 13 5.36
Selangor & WP Putrajaya Public 5 5 12
Selangor & WP Putrajaya Private 12 6 37
Selangor & WP Putrajaya Total 17 3.38 11 2.19 49 9.73
WP KL Public 6 1 10
Johor Total 10 3.06 9 2.75 20 6.12
Pahang Public 1 0 3
Pahang Private 0 0 1
Pahang Total 1 0.66 0 0 4 2.64
Terengganu Public 0 1 1
Terengganu Private 0 0 1
Terengganu Total 0 0 1 0.97 2 1.93
Kelantan Public 1 2 5
Kelantan Private 0 0 1
Kelantan Total 1 0.61 2 1.22 6 3.66
Sabah & WP Labuan Public 2 2 1
Sabah & WP Labuan Private 0 2 3
Sabah & WP Labuan Total 2 0.61 4 1.22 4 1.22
Sarawak Public 3 2 2
Sarawak Private 5 9 4
Table 6.4 Number and Density of Urodynamic Machines and Uroflowmeters in Malaysian Hospitals by State and Sector, 2009
Pulau Pinang Total 1 0.63 1 0.63
Perak Public 1 1
Perak Private 2 0
Perak Total 3 1.24 1 0.41
Selangor & WP Putrajaya Public 1 1
Selangor & WP Putrajaya Private 3 4
Selangor & WP Putrajaya Total 4 0.79 5 0.99
WP KL Public 1 1
WP KL Private 0 1
WP KL Total 1 0.59 2 1.17
Negeri Sembilan Public 1 1
Negeri Sembilan Private 0 0
Negeri Sembilan Total 1 1 1 1
Melaka Public 0 0
Sabah & WP Labuan Public 0 0
Sabah & WP Labuan Private 0 0
Sabah & WP Labuan Total 0 0 0 0
Sarawak Public 0 0
Sarawak Private 0 0
CHAPTER 7
|
NEUROLOGY DEVICES IN MALAYSIAN HOSPITALS
Ooi PY1, Hanip Rafia1 Zulkifli AS1
1. Hospital Kuala Lumpur
Summary: A total of 3 devices, namely the Electroencephalogram, Nerve Conduction Study and Electromyography, and Evoked Potential System were analysed. Sufficient numbers of neurologists and technicians trained in the appropriate use of these devices were needed. There was a preponderance of these devices in the Klang Valley, especially in the private centres. In the future, getting accurate data especially from the private sector via registries or surveys will be important to guide resource allocation.
Clinical neurophysiology aids in the diagnosis of central and peripheral nervous system disorders. The first neurophysiology unit was set up in Hospital Kuala Lumpur in 1964. There has been an increase in the number of neurophysiology units and services in the country over the years.
The following are 3 of the neurophysiology tests reported in the chapter namely:
Electroencephalogram
Electroencephalogram (EEG) is used to record the electrical activity of the brain, and aids in the diagnosis of seizures/epilepsy, central nervous system infections, metabolic and degenerative disorders.
Nerve conduction study and electromyography
Nerve conduction study (NCS) involves stimulation of the peripheral nerves and recording of the responses. Needle electromyography (EMG) is an invasive procedure with insertion of a specialised needle into muscles. These tests are usually done in the same setting. They are used to assess the severity and temporal course of neuromuscular disorders, e.g. carpal tunnel syndrome, neuropathy, neuromuscular junction disorders and muscle diseases.
Evoked potentials
Evoked potentials (EP) are electrical responses recorded from the brain, spinal cord or peripheral nerve that are evoked by external stimuli to the visual,
auditory or somatosensory system. It is helpful in assessment of integrity and localisation of neurological lesions. Visual evoked potential (VEP)
examines the integrity of the visual pathway and is widely used in diagnosis of multiple sclerosis. Somatosensory evoked potential (SSEP) assesses
the sensory system from peripheral nerves to the sensory cortex of the brain. Brainstem auditory evoked potential (BAEP) aids in evaluation
of the brainstem integrity. It is commonly done for evaluation of hearing problems, dizziness, suspected brain stem lesions and multiple sclerosis.
The EEG is the most common neurophysiology tests offered in Malaysian hospitals, followed by NCS/EMG and EP. The EEG machine was available in all the states but there were fewer machines in Perlis, East Coast and East Malaysia. The NCS/EMG and EP equipments were available in all the states except Perlis. At least half of these equipments were in the public hospitals, concentrated around the Klang Valley. In Penang and Klang Valley, the majority of the equipments were in the private sector. Penang constitutes the highest availability rate per million populations for all devices, compared with other states. Surprisingly, there was no EEG machine reported in private hospitals in Melaka, Sabah and Sarawak, where private neurologists were available.
In general, neurophysiology is largely a consultant-provided service. While simpler tests like EEG and basic NCS can be performed by medical attendants or neurophysiologists, more complex tests like EMG can only be performed by trained neurologists. All neurophysiology tests are dependent on neurologists for interpretation. The shortage of neurologists in the country explains why neurology devices were not widely available compared with devices of other specialties.
There was unequal distribution of the equipments, with a larger number in Klang Valley, especially in the private hospitals. This is because subspecialty services, including neurologist service, were more readily available in private hospitals.
There were other devices under neurology service which were not included, for example the polysomnography and transcranial Doppler ultrasound. The EEG can be further subdivided into outpatient EEG, video telemetry recording, portable EEG and ambulatory EEG. The data presented here was only for conventional outpatient EEG. These devices were not exclusively owned by the neurology unit. For example, some intensive care units may have ambulatory EEG service under the care of anesthesiologists or neuro-intensivists. Other units which may use the devices are orthopaedics, rehabilitation medicine, rheumatology and paediatrics.
Limitation
It is tempting to extrapolate the service adequacy from the number of device per million populations. However, this may not be accurate. The most obvious reason is device does not equate service, as some equipment may be physically available but non-functional, due to multiple reasons. The adequacy is best judged by the waiting time for the tests. Generally the reasonable waiting time should not exceed 16-18 weeks.
Table 7.1 Number and Density of Electroencephalogram (EEG) System, Nerve Conduction Study (NCS) and Electromyogram (EMG) Device and Evoked Potential (EP)System Devices in Malaysian Hospitals by State and Sector, 2009.
STATE SECTOR
Malaysia Total 62 2.22 40 1.43 33 1.18
Perlis Public 1 0 0
Perlis & Kedah Public 4 1 1
Perlis & Kedah Private 0 0 0
Perlis & Kedah Total 4 1.84 1 0.46 1 0.46
Pulau Pinang Public 2 1 1
Pulau Pinang Private 6 5 3
Pulau Pinang Total 8 5.06 6 3.8 4 2.53
Perak Public 2 1 1
Perak Private 2 1 2
Perak Total 4 1.65 2 0.82 3 1.24
Selangor & WP Putrajaya Public 5 3 3
Selangor & WP Putrajaya Private 12 9 6
Selangor & WP Putrajaya Total 17 3.38 12 2.38 9 1.79
WP KL Public 2 3 1
WP KL Private 6 3 3
WP KL Total 8 4.7 6 3.52 4 2.35
Selangor & WP Putrajaya & WP KL Public 7 6 4
Selangor & WP Putrajaya & WP KL Private 18 12 9
Selangor & WP Putrajaya & WP KL Total 25 3.71 18 2.67 13 1.93
Negeri Sembilan Public 1 1 1
Terengganu Total 1 0.97 1 0.97 1 0.97
Kelantan Public 5 1 1
Kelantan Private 0 0 0
Kelantan Total 5 3.05 1 0.61 1 0.61
Sabah & WP Labuan Public 4 3 3
Sabah & WP Labuan Private 0 0 0
Sabah & WP Labuan Total 4 1.22 3 0.92 3 0.92
Sarawak Public 4 1 1
Sarawak Private 0 0 0
Sarawak Total 4 1.62 1 0.4 1 0.4