Editor: Dr Goh Bak Leong
Expert Panel: Dr Goh Bak Leong (Chair)
Fan Kin Sing
Rohan Malek Bin Dato’ Dr. Johan Rosnawati Yahya
S. Prasad Menon Tan Si Yen Wong Hin Seng
Contents
5.1 Stock and Flow of Renal Transplantation • Stock and Flow
• Transplant Rates
5.2 Recipients’ Characteristics
• Demographics, Clinical and Serology Status • Primary Causes of ESRF
5.3 Transplant Practices • Type of Transplant • Place of Transplant
5.4 Transplant Outcomes
• Post Transplantation Complications • Biochemical Outcome • Deaths and Graft Loss
5.5 Patient and Graft Survival
5.6 Use of Immunosuppression and Non Immunosuppressive Medications 5.7 Cardiovascular Risk in Renal Transplant Recipients
5.8 Influence of Immunosuppression on Outcome and Cardiovascular Risk Factors
List of Tables
Chapter Table of Listing Page
Table 5.1.1 Stock and flow of renal transplantation, 1993-2012 5 Table 5.1.2 New transplant rate per million populations (pmp), 1993-2012 6 Table 5.1.3 Transplant prevalence rate per million population, 1993-2012 6 Table 5.2.1 Renal transplant recipients’ characteristics, 1993-2012 7 Table 5.2.2 Primary causes of end stage renal failure, 1993-2012 8
Table 5.3.1 Type of renal transplantation, 1993-2012 9
Table 5.3.2 Place of transplantation, 1993-2012 10
Table 5.4.1 Post-transplant complications, 1993-2012 12
Table 5.4.2 Biochemical data, 2004-2012 13
Table 5.4.3 Transplant patients’ death rate and graft loss, 1993-2012 15 Table 5.4.4(a) Causes of death in transplant recipients, 1993-2012 16
Table 5.4.4(b) Causes of graft failure, 1993-2012 17
Table 5.5.1.1 Patient survival, 1993-2012 19
Table 5.5.1.2 Risk factors for transplant patient survival 1993-2012 19
Table 5.5.1.3 Graft survival, 1993-2012 20
Table 5.5.1.4 Risk factors for transplant graft survival 1993-2012 21 Table 5.5.2.1 Unadjusted patient survival by type of transplant, 1993-2012 22 Table 5.5.2.2 Graft survival by type of transplant, 1993-2012 23 Table 5.5.3.1 Patient survival by year of transplant (Living related transplant,
1993-2012)
24
Table 5.5.3.2 Graft survival by year of transplant (Living related transplant, 1993-2012)
25
Table 5.5.4.1 Patient survival by year of transplant (Commercial cadaver transplant, 1993-2012)
26
Table 5.5.4.2 Graft survival by year of transplant (Commercial cadaver transplant, 1993-2012)
27
Table 5.6.1 Medication data, 2004-2012 29
Table 5.6.2 Use of anti-hypertensive medication 31
Table 5.7.1 Risk factors for IHD in renal transplant recipients at year 2004-2012
Table 5.7.5(a) LDL choelsterol, 2004-2012 38
Table 5.7.5(b) Total cholesterol, 2004-2012 39
Table 5.7.5(c) HDL cholesterol, 2004-2012 40
Table 5.7.6(a) Treatment for hypertension, 2004-2012 41
Table 5.7.6(b) Distribution of systolic BP without anti-hypertensive, 2004-2012 41 Table 13.7.6(c) Distribution of diastolic BP without anti-hypertensive, 2004-2012 41 Table 5.7.6(d) Distribution of systolic BP on anti-hypertensives, 2004-2012 41 Table 5.7.6(e) Distribution of diastolic BP on anti-hypertensives, 2004-2012 42 Table 5.8.1 Allograft and patient survival, Azathioprine vs Mycophenolic
Acid 1993-2012
42
Table 5.8.2 Graft and patient survival, CsA vs Tacrolimus 43
Table 5.8.3 Mean SBP, CsA vs Tacrolimus, 2004-2012 44
3
List of Tables (cont’)
Chapter Table of Listing Page
Table 5.8.5 Mean LDL cholesterol, CsA vs Tacrolimus, 2004-2012 45
Table 5.8.6 Incidence of post transplant diabetes mellitus, CsA vs Tacrolimus, 2004-2012
46
Table 5.9.1 Cumulative distribution of QoL-Index score transplant recipient patients 1993-2012
47
Table 5.9.2 Cumulative distribution of QoL-Index score in relation to diabetes mellitus, transplant recipient patients 1993-2012
48
Table 5.9.3 Cumulative distribution of QoL-Index score in relation to gender, transplant recipient patients 1993-2012
48
Table 5.9.4 Cumulative distribution of QoL-Index score in relation to age, transplant recipient patients 1993-2012
49
Table 5.9.5 Cumulative distribution of QoL-Index score in relation to year of entry, transplant recipient patients 1993-2012
50
List of Figures
Figure Label Page
Figure 5.1.1 Stock and flow of renal transplantation, 1993-2012 5
Figure 5.1.2 New transplant rate, 1993-2012 6
Figure 5.1.3 Transplant prevalence rate, 1993-2012 7
Figure 5.4.3(a) Transplant recipient death rate, 1993-2012 15
Figure 5.4.3(b) Transplant recipient graft loss rate, 1993-2012 16
Figure 5.5.1.1 Patient survival, 1993-2012 19
Figure 5.5.1.3 Graft survival, 1993-2012 20
Figure 5.5.2.1 Patient survival by type of transplant, 1993-2012 22 Figure 5.5.2.2 Graft survival by type of transplants, 1993-2012 23 Figure 5.5.3.1 Patient survival by year of transplant (Living related transplant,
1993-2012)
24
Figure 5.5.3.2 Graft survival by year of transplant (Living related transplant, 1993-2012)
25
Figure 5.5.4.1 Patient survival by year of transplant (Commercial cadaver transplant, 1993-2012)
26
Figure 5.5.4.2 Graft survival by year of transplant (Commercial cadaver transplant, 1993-2012)
27
Figure 5.6.1(a)(i) Calcineurin inhibitors: Cyclosporin vs Tacrolimus 30 Figure 5.6.1(a)(ii) Antimetabolites: Azathioprine vs Mycophenolic Acid 30 Figure 5.7.1(a) Venn diagram for pre and post transplant complications
(%) at year 2004
32
Figure 5.7.1(b) Venn diagram for pre and post transplant complications (%) at year 2006
33
Figure 5.7.1(c) Venn diagram for pre and post transplant complications (%) at year 2008
33
Figure 5.7.1(d) Venn diagram for pre and post transplant complications (%) at year 2010
4
List of Figures (cont’)
Figure Label Page
Figure 5.7.1(e) Venn diagram for pre and post transplant complications (%) at year 2012
34
Figure 5.7.2(a) Systolic BP, 2004-2012 35
Figure 5.7.2(b) Diastolic BP, 2004-2012 36
Figure 5.7.3 CKD stages by year 37
Figure 5.7.4 BMI, 2004-2012 38
Figure 5.7.5(a) LDL cholesterol, 1993-2012 39
Figure 5.7.5(b) Total cholesterol, 2004-2012 39
Figure 5.7.5(c) HDL cholesterol, 2004-2012 40
Figure 5.8.1(a) Graft survival, Azathioprine vs Mycophenolic Acid 1993-2012 42 Figure 5.8.1(b) Patient survival, Azathioprine vs Mycophenolic Acid, 1993-2012 43
Figure 5.8.2(a) Graft survival, CsA vs Tacrolimus, 1993-2012 44
Figure 5.8.2(b): Patient survival, CsA vs Tacrolimus, 1993-2012 44
Figure 5.8.3 Mean SBP, CsA vs Tacrolimus, 2004-2012 44
Figure 5.8.4: Mean GFR, CsA vs Tacrolimus, 2004-2012 45
Figure 5.8.5 Mean LDL cholesterol, CsA vs Tacrolimus, 1993-2012 46 Figure 5.8.6 Cumulative incidence of post transplant diabetes,
CsA vs Tacrolimus, 2004-2012
46
Figure 5.9.1 Cumulative distribution of QoL-Index score transplant recipient patients 1993-2012
47
Figure 5.9.2 Cumulative distribution of QoL-Index score in relation to diabetes mellitus, transplant recipient patients 1993-2012
48
Figure 5.9.3 Cumulative distribution of QoL-Index score in relation to gender, transplant recipient patients 1993-2012
49
Figure 5.9.4 Cumulative distribution of QoL-Index score in relation to age, transplant recipient patients 1993-2012
50
Figure 5.9.5 Cumulative distribution of QoL-Index score in relation to year of entry, transplant recipient patients 1993-2012
50
5
5.1 STOCK AND FLOW
The number of new transplant patients fluctuated in the 1990s and subsequently showed an initial rise from 140 transplants in 1993 to a peak of 192 transplants in 2004. The 94 transplant surgeries performed in 2012 are a substantial decrease from 2011, which was an extension of the continuous decline since 2009 (Table & Figure 5.1.1). This is predominantly due to reduction in the number of transplantations performed overseas, which coincides with the drop in the number of patients who underwent renal transplantation in China. This drop is due to the implementation of restrictions on commercial organ transplantation by the Chinese Ministry of Health.
The number of functioning renal transplants had increased from 734 in 1993 to 1443 in 2002 and to 1894 in 2012 (Table 5.1.1).
Despite advances in immunosuppression, the rate of allograft failure remained static with 2-3% allografts lost every year.
Table 5.1.1: Stock and flow of renal transplantation, 1993-2012
Year 1993 1994 1995 1996 1997 1998 1999 2000 2001 2002
Figure 5.1.1: Stock and flow of renal transplantation, 1993-2012 0
6 The incidence rate of renal transplantation continued to decline, from 6 to 7 million population in the early 2000s to 4 to 5 million population between 2007 and 2011; this decreased further in 2012 to 3 per million population (Table & Figure 5.1.2). This rate is extremely low in comparison to Australia and New Zealand, which reported rates of 38 and 25 per million population respectively in 2010.
Table 5.1.2: New transplant rate per million populations (pmp), 1993-2012
Year 1993 1994 1995 1996 1997 1998 1999 2000 2001 2002
Figure 5.1.2: New transplant rate, 1993-2012
The transplant prevalence rate has grown from 37 per million in 1993 to 65 per million population (pmp) in 2005 (Table & Figure 5.1.3).The transplant prevalence rate has not kept up with the growth in the prevalence rate of dialysis patients (which has increased from 71 pmp in 1993 to 975 pmp in 2012). In fact, the transplant incidence rate has reduced over the last ten years and the prevalence rate has remained static over the last 7 years (3 and 65 per million population respectively) (Table 5.1.2 and 5.1.3).
Table 5.1.3: Transplant prevalence rate per million population, 1993-2012
7
Figure 5.1.3: Transplant prevalence rate, 1993-2012
5.2 RECIPIENTS’ CHARACTERISTICS
Over the last 20 years, the age of transplant recipients has remained unchanged, with a mean between 35 to 42 years old. This is unlike changes in the demography of HD patients over the last two decades. The proportion of new HD patients >55 years old has increased to 72.8% in year 2012. Between 56% and 70% of recipients were males over the last two decades.
Over the two decades, the proportion of diabetic patients undergoing renal transplantation initially increased from 10% to a peak of 23% in 2003 and subsequently decreased slowly over the last 10 years. This coincided with the drop in China transplants where the majority of the diabetic patients underwent their transplantation. The proportion of diabetic renal transplant recipients has reduced to 14-16% in the last 2 years
Patients with hepatitis B have decreased from 5-8% earlier to 3-4% in the last 2 years. Similar patterns are seen with patients with Hepatitis C infections.
In terms of cause of end stage renal failure (Table 5.2.2), glomerulonephritis (GN) remains the primary cause, followed by hypertension and diabetes. Up to 40% of transplant recipients had end stage renal disease due to unknown causes, belying the fact that majority of these patients presented late.
Table 5.2.1: Renal transplant recipients’ characteristics, 1993-2012
8
9
5.3 TRANSPLANT PRACTICES 5.3.1 Type of transplant
The proportion of commercial transplantation had gradually reduced from 79% at its peak in 2004 to 21% in 2012. This was predominantly due to the marked decline in commercial cadaveric transplantation (76% in 2004 to 3% in 2011), which was in keeping with the implementation of restriction of cadaveric organ transplantation by the Chinese Ministry of Health. There was an increasing number of commercial living transplantation in 2010 which contributed to 25% of all transplants performed. However, this number has dropped to 23% in 2011 and 15% in 2012.
Local live donor transplantation made up 55% of transplants (49 recipients) in 2012, which was an increase from 42 cases (38%) in 2011. However, the number of live donors has remained low. Local cadaveric transplantation had shown a promising rise over the last 10 years with 15 transplants performed in 2003 rising to 34 recipients (31%) in 2010 and 40 recipients (36%) in 2011. Unfortunately, this rise was not sustained and the number of local cadaveric transplants dropped to 22 recipients (25%) in 2012. The year 2007 marked the first time in 20 years where there were more local transplants (56%) compared to overseas commercial transplants (44%). The proportion of local transplants continues to rise over the last five years with 80% of transplantations performed locally in 2012.
Table 5.3.1: Type of renal transplantation, 1993-2012
10
*Commercial cadaver (China, India, other oversea) *Commercial live donor (living unrelated)
5.3.2 Place of transplant
Transplantation within local centers fluctuated in the last two decades with 39 cases in 1993, remaining static for five years, increasing to a peak of 70 cases in 2001 but declining again with only 40 cases in 2004. This slowly increased again with a peak of 84 cases in 2011. Unfortunately, this was not sustained and the number of renal transplants performed in local centers decreased in 2012. This is disturbing data as it underscores our failure to improve the rate of transplantation within the country, which is mainly due to the lack of both living as well as cadaveric donors.
The number of transplants performed in Hospital Kuala Lumpur, which is the main transplant centre in Malaysia continue to fluctuate. A similar trend is seen in Hospital Selayang. Prince Court Hospital initiated their transplant program in 2009 and had contributed a significant number of transplants performed in 2012 with 16 new cases (17%).
Even though, transplantation in China continues to drop from 139 cases (72%) in 2004 down to 19 cases in 2012 (Table 5.3.2), China transplantation still contributes 20% of all transplants in Malaysia in 2012.
12
5.4 TRANSPLANT OUTCOMES 5.4.1 Post transplant complications
In the year 2012, 58% of patients were hypertensive prior to transplantation whereas 26% developed hypertension post transplantation. In terms of cardiovascular and cerebrovascular disease 2 to 3% had either or both prior to transplant and another 2 to 3% developed these post transplantation.
Table 5.4.1: Post-transplant complications, 1993-2012
Pre Transplant 2004 2005 2006 2007 2008
n % n % n % n % n %
All patients 1521 100 1597 100 1571 100 1672 100 1712 100
Diabetes 188 12 218 14 222 14 231 14 239 14
Cancer 3 0 2 0 2 0 3 0 2 0
Cardiovascular disease + cerebrovascular disorder 36 2 37 2 31 2 30 2 28 2
Hypertension 987 65 1024 64 1017 65 1052 63 1065 62
Post transplant
All patients 1521 100 1597 100 1571 100 1672 100 1712 100
Diabetes 246 16 263 16 245 16 219 13 232 14
Cancer 17 1 19 1 21 1 20 1 28 2
Cardiovascular disease + cerebrovascular disorder 96 6 54 3 53 3 60 4 87 5
Hypertension 385 25 425 27 353 22 445 27 408 24
Pre Transplant 2009 2010 2011 2012
n % n % n % n %
All patients 1669 100 1815 100 1860 100 2300 100
Diabetes 204 12 237 13 259 14 334 15
Cancer 1 0 3 0 2 0 2 0
Cardiovascular disease + cerebrovascular disorder 22 1 27 1 24 1 19 1
Hypertension 1004 60 1059 58 1058 57 1337 58
Post transplant
All patients 1669 100 1815 100 1860 100 2300 100
Diabetes 159 10 195 11 199 11 258 11
Cancer 15 1 23 1 18 1 11 0
Cardiovascular disease + cerebrovascular disorder 63 4 55 3 55 3 35 2
13
5.4.2 Biochemical outcome
14
5.4.3 Deaths and Graft loss
In 2012, 45 transplant recipients died and 41 lost their grafts. The rates of transplant death and grafts lost have remained static for the past 20 years (Table 5.4.3) despite advances in immunosuppression and antibiotics.
The main causes of death have consistently been infection and cardiovascular disease with 35% and 22% respectively. In the last 2 years, the proportion of patient who died at home, which is usually presumed to be cardiovascular death, has increased to 17%.
Cancer death rates have been significantly high from 2002 to 2012 contributing between 8 to 17% of all deaths. Death due to liver disease has slowly declined from 13% in 2002 to around 4% in the last few years.
15
Table 5.4.3: Transplant patients’ death rate and graft loss, 1993-2012
Year 1993 1994 1995 1996 1997 1998 1999 2000 2001 2002
*Graft loss=graft failure
*All losses=death / graft loss (acute rejection happens concurrently with graft failure / death)
0
16
Annual graft loss rate
Figure 5.4.3(b): Transplant recipient graft loss rate, 1993-2012
5.4.4 Causes of death and graft loss
Table 5.4.4 (a): Causes of death in transplant recipients, 1993-2012
17
Table 5.4.4(b): Causes of graft failure, 1993-2012
18
5.5 PATIENT AND GRAFT SURVIVAL 5.5.1 Patient and Graft Survival
Overall patient survival rates from 1993 to 2012 were 95%, 92%, 88% and 79% at year 1, 3, 5 and 10 respectively. Overall graft survival rates were 92%, 86%, 80% and 65% at year 1, 3, 5 and 10 respectively (Figure & Table 5.5.1.1 and 5.5.1.3).
Factors affecting patient survival are year of transplantation, age at transplantation, primary disease and type of transplantation. Patients who underwent renal transplantation in later years have higher risk of mortality. This may be due to the acceptance of patients with more co-morbidities to undergo renal transplantation during later years. Older patients are also at higher risk of mortality. Diabetes as primary renal disease has a tendency for higher mortality but this was not statistically significant. However, patients with glomerulonephritis and systemic lupus nephritis have better survival in comparison to those with an unknown primary (Table 5.5.1.2).
19
Table 5.5.1.1: Patient survival, 1993-2012 Interval (years) n % Survival SE
*n=Number at risk SE=standard error
0.00 Transplant patient survival, 1993-2012
Figure 5.5.1.1: Patient survival, 1993-2012
Table 5.5.1.2: Risk factors for transplant patient survival 1993-2012
Factors n Hazard Ratio 95% CI P value
Year of transplant
1993-2002 (ref*) 1441 1.00
20
Table 5.5.1.3: Graft survival, 1993-2012 Interval (years) n % Survival SE
*n=Number at risk SE=standard error
0.00 Transplant graft survival, 1993-2012
21
Table 5.5.1.4: Risk factors for transplant graft survival 1993-2012
Factors n Hazard Ratio 95%CI P value
Year of transplant
1993-2002 (ref*) 1441 1.00
Obstructive nephropathy 97 0.82 (0.55;1.24) 0.350
Others 628 1.36 (1.12;1.65) 0.002
5.5.2 Survival according to type of transplant
Outcomes of renal transplantation over the last 20 years in the 4 different donor groups are shown in Figures 5.5.2.1 and Figure 5.5.2.2.
For local living renal transplantation, the patient survival was 97%, 96%, 94% and 88%, while the graft survival was 92%, 90%, 86% and 71% at year 1, 3, 5 and 10 respectively. For commercial cadaveric allografts, patient and graft survival was 96%, 92%, 87% and 79% and 94%, 89% and 82% and 70% at year 1, 3, 5 and 10 years respectively
22
Table 5.5.2.1: Unadjusted patient survival by type of transplant, 1993-2012 Type of
Transplant
Commercial Cadaver
Commercial
Live Donor Live Donor Cadaver
Interval (years) n %
*n=Number at risk SE=standard error
Figure 5.5.2.1: Patient survival by type of transplant, 1993-2012
Commercial cadaver
23
Table 5.5.2.2: Graft survival by type of transplant, 1993-2012 Type of
Transplant
Commercial Cadaver
Commercial
Live Donor Live Donor Cadaver
Interval (years) n %
*n=Number at risk SE=standard error
Commercial cadaver
Transplant graft survival by Type of Transplant, 1993-2012
Figure 5.5.2.2: Graft survival by type of transplants, 1993-2012
5.5.3 Outcome of Living Related Renal Transplantation
24
Table 5.5.3.1: Patient survival by year of transplant (Living related transplant, 1993-2012)
Year of Transplant 1993-2002 2003-2012
Interval (years) n % Survival SE n % Survival SE
*n=Number at risk SE=standard error
Year 1993-2002
Transplant patient survival by Year of Transplant, 1993-2012
25
Table 5.5.3.2: Graft survival by year of transplant (Living related transplant, 1993-2012)
Year of Transplant 1993-2002 2003-2012
Interval (years) n % Survival SE n % Survival SE
*n=Number at risk SE=standard error
Year 1993-2002
Transplant graft survival by Year of Transplant, 2002-2012
Figure 5.5.3.2: Graft survival by year of transplant (Living related transplant, 1993-2012)
5.5.4 Outcome of Commercial Cadaveric Transplantation
26
Table 5.5.4.1: Patient survival by year of transplant (Commercial cadaver transplant, 1993-2012)
Year of Transplant 1993-2002 2003-2012
Interval (years) n % Survival SE n % Survival SE
*n=Number at risk SE=standard error
Year 1993-2002
Transplant patient survival by Year of Transplant, 1993-2012
27
Table 5.5.4.2: Graft survival by year of transplant (Commercial cadaver transplant, 1993-2012)
Year of Transplant 1993-2002 2003-2012
Interval (years) n % Survival SE n % Survival SE
*n=Number at risk SE=standard error
Year 1993-2002
Transplant graft survival by Year of Transplant, 1993-2012
28
5.6 USE OF IMMUNOSUPPRESSION AND NON IMMUNOSUPPRESSIVE MEDICATIONS
5.6.1 Immunosuppressive medications
Majority of patients were on combination immunosuppression.
Calcineurin-inhibitor based therapy remained the mainstay of immunosuppressive therapy with 89% of patients receiving it in 2012. Cyclosporin remained the most widely used calcineurin inhibitor. However, there was a gradual decline in cyclosporine usage from 79% in 2004 to 67% in 2008 and 49% in 2012, which coincided with increasing use of tacrolimus, with 13% in 2004 to 23% in 2008 and 40% in 2012.
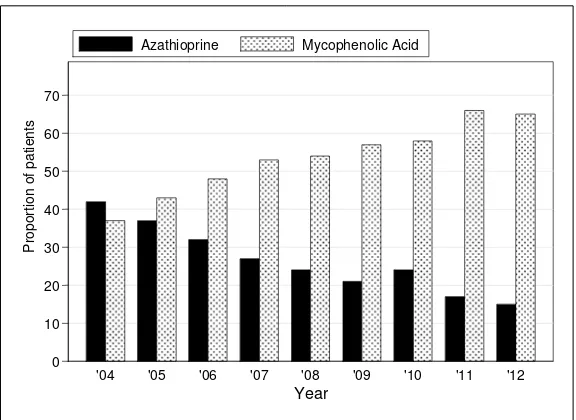
The usage of anti-proliferative agents have shown a similar trend over the last nine years. The use of azathioprine continues to decline from year 2004 to year 2012, and this coincided with gradual increase in the use of mycophenolic acid (Figure 5.6.1(a)(i) & (ii)).
The use of Proliferation Signal Inhibitors (PSI) such as sirolimus remained low in 1-2% of all transplant recipients in 2012.
5.6.2 Non immunosuppressive medications
29
Table 5.6.1: Medication data, 2004-2012
Combined drug treatment
Medication data 2004 2005 2006 2007 2008 2009 2010 2011 2012
n % n % n % n % n % n % n % n % n %
All 1563 100 1643 100 1598 100 1695 100 1706 100 1703 100 1859 100 1925 100 1943 100
(i) Immunosuppressive drug(s) treatment
Prednisolone 1524 98 1588 97 1535 96 1600 94 1613 95 1570 92 1751 94 1826 95 1845 95
Cyclosporin A 1241 79 1264 77 1177 74 1188 70 1144 67 1057 62 1092 59 1047 54 959 49
Tacrolimus 199 13 240 15 278 17 335 20 394 23 470 28 591 32 710 37 774 40
Azathioprine 655 42 610 37 516 32 462 27 403 24 365 21 443 24 321 17 282 15
Mycophenolic Acid 0 0 0 0 0 0 659 39 750 44 721 42 758 41 942 49 865 45
Rapamycin 6 0 11 1 24 2 35 2 41 2 40 2 36 2 48 2 48 2
Others 0 0 5 0 1 0 0 0 1 0 1 0 0 0 1 0 0 0
(ii) Non-Immunosuppressive drug(s) treatment
Alpha blocker 112 7 119 7 116 7 105 6 117 7 94 6 60 3 93 5 123 6
Beta blocker 700 45 694 42 627 39 728 43 660 39 678 40 717 39 872 45 624 32
Calcium channel blocker 858 55 858 52 817 51 921 54 742 43 749 44 794 43 760 39 850 44
ACE inhibitor 286 18 356 22 303 19 379 22 335 20 302 18 298 16 270 14 276 14
AIIRB 95 6 168 10 142 9 210 12 155 9 146 9 210 11 189 10 232 12
Direct Renin Inhibitors (DRI) 0 0 0 0 0 0 0 0 0 0 0 0 0 0 0 0 3 0
30
Figure 5.6.1(a)(i): Calcineurin inhibitors: Cyclosporin vs Tacrolimus
Figure 5.6.1(a)(ii): Antimetabolites: Azathioprine vs Mycophenolic Acid
31
Table 5.6.2: Use of anti-hypertensive medication
Antihypertensive medication Single drug treatment
2004 2005 2006 2007 2008 2009 2010 2011 2012
n % n % n % n % n % n % n % n % n %
Alpha blocker 7 0 3 0 11 1 3 0 8 0 10 1 7 0 10 1 15 1
Beta blocker 202 13 176 11 166 10 151 9 174 10 203 12 259 14 440 23 202 10
Calcium channel blocker 322 20 311 19 311 19 309 18 258 15 267 16 336 18 269 14 346 18
ACE inhibitor 70 4 91 6 65 4 72 4 90 5 92 5 75 4 68 4 91 5
AIIRB 26 2 39 2 41 3 40 2 32 2 34 2 60 3 54 3 66 3
Direct Renin Inhibitor (DRI) 0 0 0 0 0 0 0 0 0 0 0 0 0 0 0 0 1 0
Other anti-hypertensive 11 1 7 0 4 0 5 0 27 2 25 1 32 2 15 1 9 0
Antihypertensive medication
Combined drug treatment
2004 2005 2006 2007 2008 2009 2010 2011 2012
n % n % n % n % n % n % n % n % n %
Alpha blocker 112 7 119 7 116 7 105 6 117 7 94 6 60 3 93 5 122 6
Beta blocker 704 45 690 42 627 39 728 43 662 39 677 40 716 38 870 45 625 32
Calcium channel blocker 863 55 857 52 817 51 919 54 741 43 749 44 795 43 763 40 845 44
ACE inhibitor 286 18 356 22 303 19 379 22 335 20 306 18 298 16 270 14 278 14
AIIRB 95 6 168 10 142 9 210 12 155 9 146 9 207 11 189 10 232 12
Direct Renin Inhibitor (DRI) 0 0 0 0 0 0 0 0 0 0 0 0 0 0 0 0 3 0
32
5.7 CARDIOVASCULAR RISK IN RENAL TRANSPLANT RECIPIENTS 13.7.1 Risk factors for Ischaemic Heart Disease (IHD)
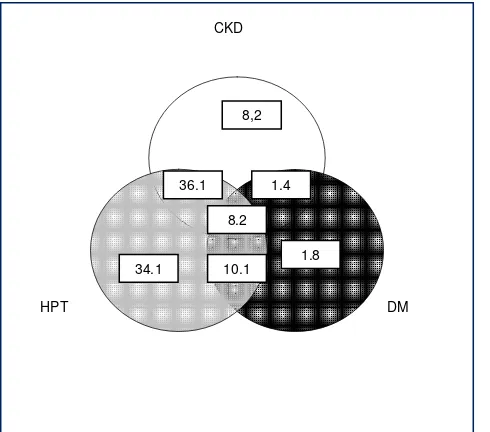
In 2012, 82.2% of patients were hypertensive, 22.6% were diabetic and 49.4% had renal insufficiency fulfilling CKD III and above. Forty-two percent of patients had 2 cardiovascular risk factors while 6.1 % had all 3 major risk factors. The proportion of patients with hypertension appears to be decreasing over the years. However the proportion of patients with diabetes remains the same.
Table 5.7.1: Risk factors for IHD in renal transplant recipients at year 2004-2012
2004 2005 2006 2007 2008
Diabetes 27 (1.8) 21 (1.4) 21 (1.4) 25 (1.6) 18 (1.1)
Hypertension** 501 (34.1) 508 (33.1) 452 (30.9) 586 (37.2) 662 (41.7)
CKD 121 (8.2) 142 (9.3) 177 (12.1) 127 (8.1) 117 (7.4)
Diabetes + Hypertension** 149 (10.1) 163 (10.6) 158 (10.8) 179 (11.4) 204 (12.8)
Diabetes + CKD 21 (1.4) 20 (1.3) 18 (1.2) 11 (0.7) 22 (1.4)
CKD + Hypertension** 530 (36.1) 537 (35.0) 489 (33.4) 515 (32.7) 456 (28.7)
Diabetes + CKD + Hypertension** 120 (8.2) 143 (9.3) 148 (10.1) 134 (8.5) 110 (6.9)
2009 2010 2011 2012
Diabetes 28 (1.8) 35 (2.1) 38 (2.2) 37 (2.2)
Hypertension** 644 (41.0) 635 (37.8) 674 (38.9) 596 (36.1)
CKD 156 (9.9) 166 (9.9) 159 (9.2) 225 (13.6)
Diabetes + Hypertension** 164 (10.4) 197 (11.7) 215 (12.4) 203 (12.3)
Diabetes + CKD 18 (1.1) 22 (1.3) 33 (1.9) 33 (2.0)
CKD + Hypertension** 472 (30.1) 514 (30.6) 508 (29.3) 457 (27.7)
Diabetes + CKD + Hypertension** 88 (5.6) 109 (6.5) 105 (6.1) 100 (6.1)
**Hypertension: BP systolic > 140 and BP diastolic > 90 or anti-hypertensive drugs
Figure 5.7.1(a): Venn diagram for pre and post transplant complications (%) at year 2004
CKD
DM HPT
8,2
1.8 34.1
1.4 36.1
33
Figure 5.7.1(b): Venn diagram for pre and post transplant complications (%) at year 2006
Figure 5.7.1(c): Venn diagram for pre and post transplant complications (%) at year 2008
Figure 5.7.1(d): Venn diagram for pre and post transplant complications (%) at year 2010
CKD
DM HPT
9.9
2.2 37.8
1.3 30.6
11.7 6.5 CKD
DM HPT
9.9
1.1 41.7
1.4 28.7
12.8 6.9
CKD
DM HPT
12.1
1.4 30.9
1.2 33.4
34
Figure 5.7.1(e): Venn diagram for pre and post transplant complications (%) at year 2012
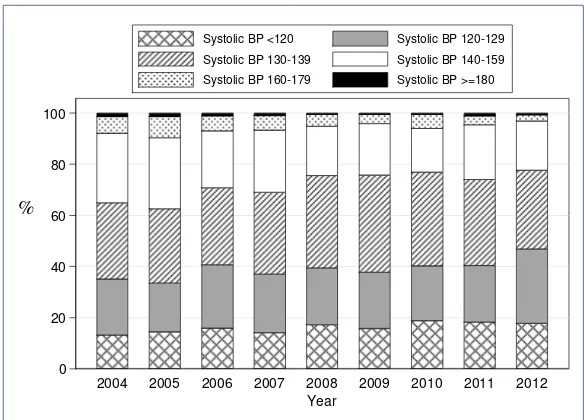
5.7.2 Blood pressure classification according to JNC VIII criteria, 2004-2012
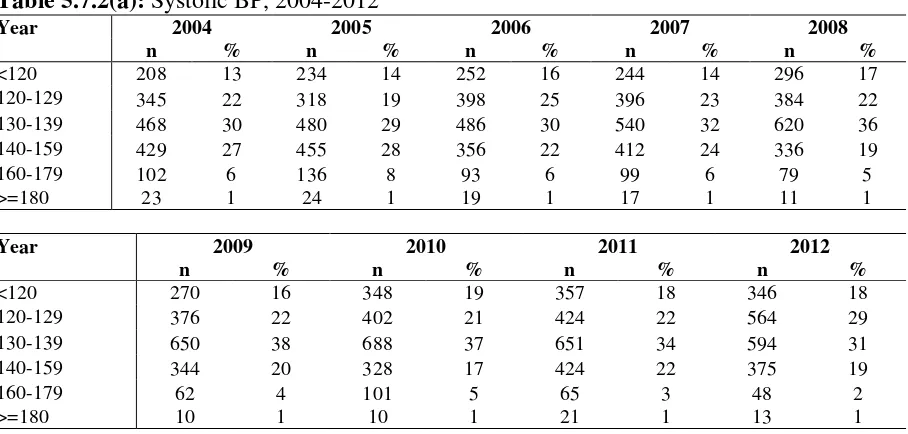
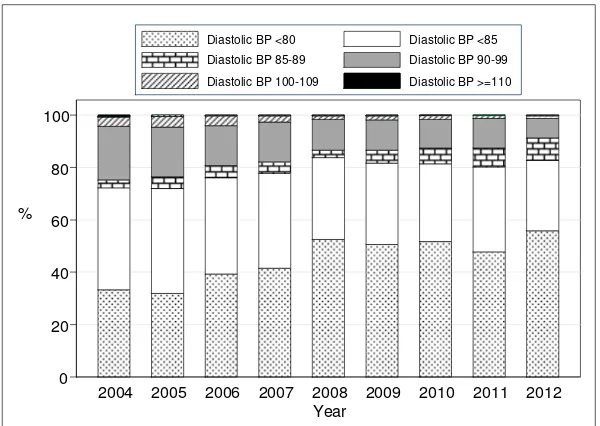
In 2012, 19% of renal transplant recipients had stage I hypertension whereas 2% had stage II hypertension and 1% had stage III hypertension despite being on treatment (Table 5.7.2 a). In terms of diastolic hypertension 7% had stage I hypertension, 1% of patients had stage II diastolic hypertension.
Table 5.7.2(a): Systolic BP, 2004-2012
Year 2004 2005 2006 2007 2008
n % n % n % n % n %
<120 208 13 234 14 252 16 244 14 296 17
120-129 345 22 318 19 398 25 396 23 384 22
130-139 468 30 480 29 486 30 540 32 620 36
140-159 429 27 455 28 356 22 412 24 336 19
160-179 102 6 136 8 93 6 99 6 79 5
>=180 23 1 24 1 19 1 17 1 11 1
Year 2009 2010 2011 2012
n % n % n % n %
<120 270 16 348 19 357 18 346 18
120-129 376 22 402 21 424 22 564 29
130-139 650 38 688 37 651 34 594 31
140-159 344 20 328 17 424 22 375 19
160-179 62 4 101 5 65 3 48 2
>=180 10 1 10 1 21 1 13 1
CKD
DM HPT
12.3
2.2 36.1
2.0 27.7
35
Figure 5.7.2(a): Systolic BP, 2004-2012
Table 5.7.2(b): Diastolic BP, 2004-2012
Year 2004 2005 2006 2007 2008
n % n % n n % n % n
<80 524 33 526 32 632 39 711 42 908 53
80-84 614 39 660 40 589 37 617 36 537 31
85-89 48 3 74 4 74 5 74 4 51 3
90-99 321 20 312 19 244 15 262 15 202 12
100-109 56 4 65 4 61 4 39 2 23 1
>=110 12 1 10 1 4 0 5 0 5 0
Year 2009 2010 2011 2012
n % n % N % n %
<80 866 51 971 52 927 48 1089 56
80-84 533 31 557 30 629 32 522 27
85-89 84 5 114 6 142 7 171 9
90-99 197 12 204 11 219 11 143 7
100-109 27 2 27 1 22 1 20 1
>=110 5 0 4 0 3 0 5 0
0 20 40 60 80 100
%
2004 2005 2006 2007 2008 2009 2010 2011 2012
Year
36
Figure 5.7.2(b): Diastolic BP, 2004-2012
5.7.3 Level of allograft function
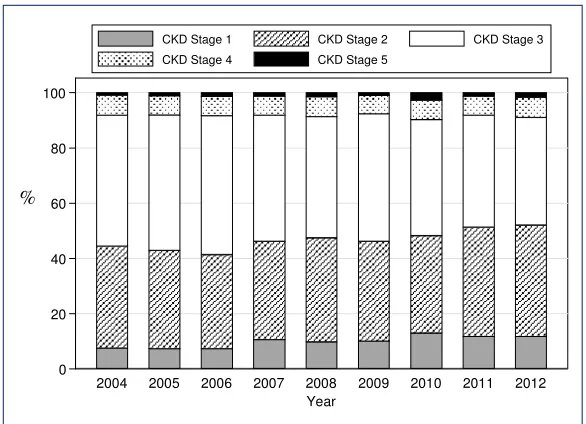
Table and Figure 5.7.3 shows the CKD Stage classification by year and in 2012, 39% of renal transplant recipients had CKD Stage III, whilst another 7% had CKD Stage IV. CKD Stage V (impending renal replacement therapy) was found in 2% of renal transplant recipients.
Table 5.7.3: CKD stages, 2004-2012
Year 2004 2005 2006 2007 2008
n % n % n % n % n %
Stage 1 119 8 119 7 117 7 180 11 165 10
Stage 2 579 37 583 36 542 34 598 35 636 37
Stage 3 738 47 805 49 803 50 773 46 751 44
Stage 4 113 7 113 7 109 7 116 7 123 7
Stage 5 15 1 19 1 24 2 23 1 27 2
Year 2009 2010 2011 2012
n % n % n % n %
Stage 1 169 10 237 13 227 12 224 12
Stage 2 605 36 652 35 754 39 772 40
Stage 3 777 46 773 42 772 40 749 39
Stage 4 107 6 131 7 133 7 141 7
Stage 5 22 1 51 3 25 1 38 2
0 20 40 60 80 100
%
2004 2005 2006 2007 2008 2009 2010 2011 2012
Year
37
Figure 5.7.3: CKD stages by year
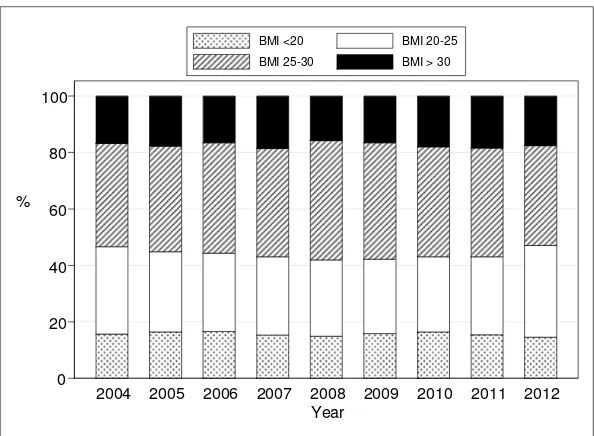
5.7.4 Body Mass Index
In 2012, 47% of renal transplant recipients had BMIs of 25 or below. However 35% were overweight and another 18% were obese. There seems to be a slow but steady increase in numbers of obese patients over the last few years.
Table 5.7.4: BMI, 2004-2012
Year 2004 2005 2006 2007 2008
n % n % n % n % n %
<20 248 16 272 17 266 17 262 15 259 15
20-25 487 31 467 28 445 28 474 28 464 27
25-30 575 37 616 37 626 39 653 38 730 42
> 30 265 17 292 18 267 17 319 19 273 16
Year 2009 2010 2011 2012
n % n % n % n %
<20 272 16 309 16 301 15 285 15
20-25 450 26 500 27 536 28 633 32
25-30 705 41 731 39 746 38 692 35
> 30 285 17 337 18 359 18 344 18
0 20 40 60 80 100
%
2004 2005 2006 2007 2008 2009 2010 2011 2012
Year
CKD Stage 1 CKD Stage 2 CKD Stage 3
38
Figure 5.7.4: BMI, 2004-2012
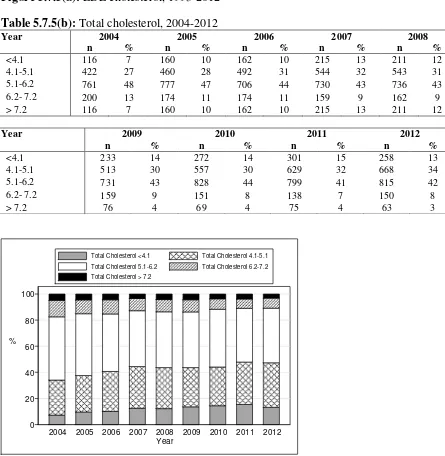
5.7.5 Lipid profile
LDL cholesterol has been identified as the primary lipid target for prevention of coronary heart disease by National Cholesterol Education Program (NCEP) with a log linear relationship between risk of coronary heart disease and level of LDL cholesterol. In 2012, only 34% of our renal transplant recipients have LDL levels below 2.6mmol/L. This has been relatively the same since 2006. Whether or not this translates into less cardiovascular mortality in the transplant population is still questionable. Patients with serum LDL >3.4mmol/L have been relatively static throughout the 10-year period.
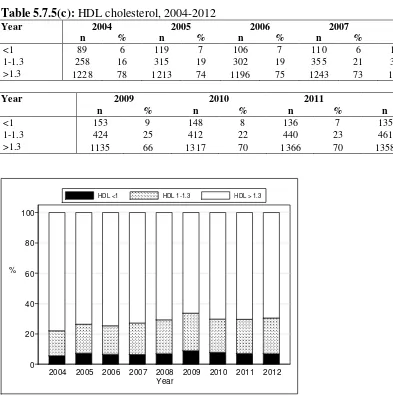
In terms of other cholesterol parameters, 47% had total cholesterol levels <5.1mmol/L and 7 % had HDL cholesterol levels < 1.0mmol/L.
Table 5.7.5(a): LDL choelsterol, 2004-2012
Year 2004 2005 2006 2007 2008
n % n % n % n % n %
< 2.6 287 18 424 26 497 31 531 31 595 34
2.6-3.4 962 61 865 53 741 46 794 46 792 46
>= 3.4 326 21 358 22 366 23 383 22 339 20
Year 2009 2010 2011 2012
n % n % n % n %
< 2.6 651 38 635 34 614 32 656 34
2.6-3.4 727 42 895 48 982 51 935 48
>= 3.4 334 20 347 18 346 18 363 19
0 20 40 60 80 100
%
2004 2005 2006 2007 2008 2009 2010 2011 2012
Year
BMI <20 BMI 20-25
39
Figure 5.7.5(a): LDL cholesterol, 1993-2012
Table 5.7.5(b): Total cholesterol, 2004-2012
Year 2004 2005 2006 2007 2008
Figure 5.7.5(b): Total cholesterol, 2004-2012
0
2004 2005 2006 2007 2008 2009 2010 2011 2012
Year
Total Cholesterol <4.1 Total Cholesterol 4.1-5.1 Total Cholesterol 5.1-6.2 Total Cholesterol 6.2-7.2 Total Cholesterol > 7.2
0
2004 2005 2006 2007 2008 2009 2010 2011 2012
Year
40
Table 5.7.5(c): HDL cholesterol, 2004-2012
Year 2004 2005 2006 2007 2008
n % n % n % n % n %
<1 89 6 119 7 106 7 110 6 119 7
1-1.3 258 16 315 19 302 19 355 21 387 22
>1.3 1228 78 1213 74 1196 75 1243 73 1220 71
Year 2009 2010 2011 2012
n % n % n % n %
<1 153 9 148 8 136 7 135 7
1-1.3 424 25 412 22 440 23 461 24
>1.3 1135 66 1317 70 1366 70 1358 69
Figure 5.7.5(c): HDL cholesterol, 2004-2012
5.7.6 Blood Pressure Control
There is a progressive reduction in the percentage of patients who were on antihypertensives over the last 9 years with 81% on antihypertensive drugs in 2004 reducing to 68% in 2012. The percentage of patients taking multiple antihypertensive medications were also reducing with 41%, 31% and 9% on 1, 2 and 3 antihypertensive drugs respectively in 2004, reduced to 39%, 33% and 6% were on 1, 2 and 3 antihypertensive drugs respectively in 2012.
Despite a reduction in the percentage of patients who were on antihypertensives, blood pressure control has improved over the same period with lower systolic and diastolic median blood pressure achieved in 2012. This may be contributed by the relatively lower dose and level of calcineurin inhibitors (CNI) used in the later period with the practice of CNI minimisation and also increasing use of tacrolimus.
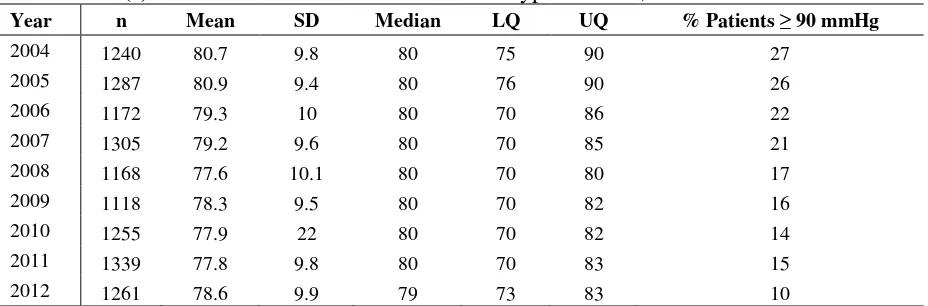
In 2012, only 4% of patients still had systolic BP of >160 mmHg and 10% had diastolic BP of >90 mmHg despite being given antihypertensive(s), which is a continuous improvement throughout the nine-year period.
0 20 40 60 80 100
%
2004 2005 2006 2007 2008 2009 2010 2011 2012
Year
41
Table 5.7.6(a): Treatment for hypertension, 2004-2012
Year n % on
anti-Table 5.7.6(b): Distribution of systolic BP without anti-hypertensive, 2004-2012
Year n Mean SD Median LQ UQ % Patients 160mmHg
Table 13.7.6(c): Distribution of diastolic BP without anti-hypertensive, 2004-2012
Year n Mean SD Median LQ UQ % patients 90mmHg
Table 5.7.6(d): Distribution of systolic BP on anti-hypertensives, 2004-2012
42
Table 5.7.6(e): Distribution of diastolic BP on anti-hypertensives, 2004-2012
Year n Mean SD Median LQ UQ % Patients 90 mmHg
5.8 INFLUENCE OF IMMUNOSUPPRESSION ON OUTCOME AND CARDIOVASCULAR RISK FACTORS
Patient and allograft survival appear to be better with mycophenolic acid compared to Azathioprine (Table 5.8.1 and Figure 5.8.1 (a) & (b)).
With the two calcineurin inhibitors, there was no difference in patient and allograft survival for cyclosporin in comparison to tacrolimus (Table 5.8.2 and Figure 5.8.2(a) & (b)).
It is interesting to note that the mean systolic blood pressure, the mean allograft function and LDL cholesterol were better in the tacrolimus group. However, there is no difference in the incidence of new onset diabetes after transplantation (NODAT).
Table 5.8.1: Allograft and patient survival, Azathioprine vs Mycophenolic Acid 1993-2012
Azathioprine Mycophenolic Acid
Survival (%) n Graft
43
Transplant patient survival, 2012
Figure 5.8.1(b): Patient survival, Azathioprine vs Mycophenolic Acid, 1993-2012
Table 5.8.2: Graft and patient survival, CsA vs Tacrolimus
CsA Tacrolimus
Survival (%) n Graft
44
Transplant patient survival, 2012
Figure 5.8.2(b): Patient survival, CsA vs Tacrolimus, 1993-2012
Table 5.8.3: Mean SBP, CsA vs Tacrolimus, 2004-2012
Year Mean SBP CsA Mean SBP Tacrolimus
2004 132.7 128.7
45
Table 5.8.4: Mean GFR, CsA vs Tacrolimus, 2004-2012
Year Mean GFR CsA Mean GFR Tacrolimus
2004 99.3 126.1
2005 97.3 111
2006 97.6 109.8
2007 96 104.4
2008 97.3 111
2009 95.6 108.8
2010 91.6 106.4
2011 90.7 101.9
2012 92.1 100.7
90 100 110 120 130
M
e
a
n
G
F
R
'04 '05 '06 '07 '08 '09 '10 '11 '12
Year
CsA Tacrolimus
Figure 5.8.4: Mean GFR, CsA vs Tacrolimus, 2004-2012
Table 5.8.5: Mean LDL cholesterol, CsA vs Tacrolimus, 2004-2012
Year Mean LDL CsA Mean LDL Tacrolimus
2004 3.2 3
2005 3 2.8
2006 3 2.9
2007 3 2.8
2008 2.9 2.8
2009 2.8 2.7
2010 2.9 2.8
2011 2.9 2.9
46
Figure 5.8.5: Mean LDL cholesterol, CsA vs Tacrolimus, 1993-2012
Table 5.8.6: Incidence of post transplant diabetes mellitus, CsA vs Tacrolimus, 2004-2012
Year Post Tx DM CsA Post Tx DM Tacrolimus
2004 2005 2006 2007 2008 2009 2010 2011 2012 Year
Post Tx DM CsA Post Tx DM Tacrolimus
Cumulative incidence of post transplant diabetes, CsA vs Tacrolimus, 2004-2012
47
5.9 QOL INDEX SCORE IN RENAL TRANSPLANT RECIPIENTS
1276 patients who were transplanted from 1993 to 2012 were analysed for QoL index score. They reported median QoL index score of 10 (Table & Figure 5.9.1). It was interesting to note that for those who underwent renal transplantation within this period, diabetics and non-diabetics had the same median QoL index score of 10 (Table & Figure 5.9.2), and this is in contrast to HD and PD patients where diabetics reported lower QoL index score than non-diabetics. There was also no difference seen between gender (Table & Figure 5.9.3) and age (Table & Figure 5.9.4). It is worthwhile to note that those above 60 year-old also enjoyed the same QoL index score (10) as their younger counterparts (Table & Figure 5.9.4). This trend of high QoL index score among renal transplant patients was maintained over the last 20 years (Table & Figure 5.9.5).
Table 5.9.1: Cumulative distribution of QoL-Index score transplant recipient patients 1993-2012
Renal transplant QoL score
Number of patients 2227
Centile Cumulative distribution of QOL by Modality, Transplant Patients
48
Table 5.9.2: Cumulative distribution of QoL-Index score in relation to diabetes mellitus, transplant recipient patients 1993-2012
Diabetes mellitus No Yes
Number of patients 1954 273
Cumulative distribution of QOL by DM, Transplant Patients
Figure 5.9.2: Cumulative distribution of QoL-Index score in relation to diabetes mellitus, transplant recipient patients 1993-2012
Table 5.9.3: Cumulative distribution of QoL-Index score in relation to gender, transplant recipient patients 1993-2012
49
Cumulative distribution of QOL by Gender, Transplant Patients
Figure 5.9.3: Cumulative distribution of QoL-Index score in relation to gender, transplant recipient patients1993-2012
Table 5.9.4: Cumulative distribution of QoL-Index score in relation to age, transplant recipient patients 1993-2012
Age group (years) <20 20-39 40-59 >=60
Age <20 Age 20-39
Age 40-59 Age >=60
Cumulative distribution of QoL-Index by Age Group, Transplant patients
50
Table 5.9.5: Cumulative distribution of QoL-Index score in relation to year of entry, transplant recipient patients 1993-2012
Year of Entry 1993 1994 1995 1996 1997 1998 1999 2000 2001 2002
Year 1993 Year 1995 Year 1997 Year 1999 Year 2001 Year 2003 Year 2005 Year 2007 Year 2009 Year 2011
Cumulative distribution of QOL by Year of Entry, Transplant Patients