Promoting School Readiness in
Oklahoma
An Evaluation of Tulsa’s Pre-K Program
William T. Gormley, Jr.
Ted Gayer
A B S T R A C T
Since the mid-1990s, three states, including Oklahoma, have established a universal pre-kindergarten (pre-K) program. We analyze the effects of Oklahoma’s universal pre-kindergarten (pre-K) program for four-year-olds on children in Tulsa Public Schools (TPS). The main difficulty with testing the causal impact of a voluntary pre-K program is that certain parents are more likely to select pre-K, and these parents might have other unobservable characteristics that influence the test outcomes of their children. Because TPS administered an identical test in September 2001 to children just begin-ning pre-K and children just beginbegin-ning kindergarten, we can compare test outcomes of “old” pre-kindergarten students to test outcomes of “young” kindergarten students who attended pre-K the previous year. We find that the Tulsa pre-K program increases cognitive/knowledge scores by approximately 0.39 standard deviation, motor skills scores by approximately 0.24 standard deviation, and language scores by approximately 0.38 standard deviation. Impacts tend to be largest for Hispanics, followed by blacks, with little impact for whites. Children who qualify for a free lunch have larger impacts than other children.
Both authors are at the Georgetown Public Policy Institute, Georgetown University, Washington, DC, 20057. This work was funded by the Center for Research on Children in the U.S. (CROCUS). The authors thank Jens Ludwig, Deborah Phillips, Ruby Takanishi, Steve Barnett, and three anonymous reviewers for lots of helpful suggestions. They would also like to thank Brittany Dawson, Alexis Lester, Shantay Prince, Emily Sama-Martin, Laura Schiebelhut, Ria Sengupta, Berkeley Smith, and Jean Chung for their invalu-able research assistance. The authors greatly appreciate the cooperation they received from the Tulsa Public Schools and the Oklahoma Department of Education. Finally, they would like to thank the Foundation for Child Development, the National Institute for Early Education Research at Rutgers University, and the Pew Charitable Trusts for their generous support. The authors claim full responsibility for the contents of this report. The data used in this article can be obtained October 2005 through September 2008 from Professor William Gormley, Public Policy Institute, Georgetown University, 3520 Prospect St., N.W., Washington, D.C. 20007.
E-mail: gormleyw@georgetown.edu. [Submitted May 2003; accepted July 2004]
I. Introduction
In recent years, several state governments have launched initiatives aimed at providing pre-kindergarten (hereafter, pre-K) programs for all four-year old children whose parents wish to enroll them. The program is thus universal, but vol-untary. Georgia established such a program in 1995,1followed by New York in 19972 and Oklahoma in 1998. The District of Columbia also has such a program. Other jurisdictions are moving in this direction.3
A key premise behind these initiatives is that a universal pre-K program will enhance school-readiness and give all students the kind of “head start” that the Head Start pro-gram was designed to provide to eligible low-income students. But is this premise cor-rect? Some studies show that well-funded, well-designed, and well-staffed early intervention programs can improve the academic achievement of disadvantaged children (Barnett 1993; Campbell and Ramey 1995; Reynolds et al. 2001). But can we extrapo-late from intensive early intervention programs to less intensive programs? Would we see the same results from programs that serve disadvantaged children and programs that serve middle-class and upper-class children as well? Can we generalize from selective programs to universal programs, in view of the larger staffing challenges the latter face? The primary difficulty with assessing a voluntarypre-K program is that certain par-ents are more likely to select the pre-K program for their children, and these parpar-ents (or their children) might also have other unobservable characteristics that influence the test outcomes of the children. In this paper, we assess Oklahoma’s universal pre-K program by focusing on data from the Tulsa Public Schools (TPS), the largest school district in the state. TPS struck us as an excellent research site for two reasons. First, TPS administered the same test to four-year-olds beginning TPS pre-K and five-year-olds beginning TPS kindergarten in September 2001. Second, TPS used a strict cutoff birthday requirement for enrollment in TPS pre-K. This strict cutoff birthday requirement creates a discontinuous relationship between age and whether the child attended TPS pre-K in the 2000 or 2001 academic year. Therefore we can compare children who just made the cutoff to children who just missed it. If other characteris-tics of the children are sufficiently smooth at this cutoff date, then this regression-discontinuity design can identify the effect of the TPS pre-K program on test scores.
II. Literature Review
The literature on the effects of Head Start, pre-K programs, and enriched early intervention programs is rich and intriguing. An enriched early intervention pro-gram that starts early in life, pays its staff well, and maintains low child-staff ratios can
1. Georgia’s universal program replaced a means-tested program established in 1993.
2. New York’s program, though established in 1997, was not intended to become universal until 2002. Because of state budget shortages, only 200 out of 700 school districts were participating in 2002. Governor George Pataki proposed discontinuing the pre-K program in 2003, but the New York state legislature voted to continue the program, overriding a gubernatorial veto.
have significant positive effects on student achievement and other desirable outcomes, at least for disadvantaged children. The Perry Preschool project from Ypsilanti, Michigan, and the Abecedarian project from Chapel Hill, North Carolina—both of which involved random assignment and several years of treatment—yielded benefits to society and to the children themselves that substantially exceeded project costs (Barnett 1993; Campbell and Ramey 1995). Children in the Abecedarian treatment group, for example, performed much better on reading and math tests than children in the control group. They were also less likely to be retained in grade or to be placed in special education classes, more likely to finish high school and to be employed, and less likely to commit a crime.
Like these two exemplary projects, the Head Start program embeds pre-K readiness goals in the context of comprehensive services. In general, however, Head Start is less expensive than these model programs (Currie 2001, p. 221), in part because it tends to be part-day and part-year, usually for nine months only.4According to a meta-analysis of the early Head Start literature, the Head Start program has some positive effects on cognition, socioemotional development, and health status (McKey et al. 1985). More recent and more sophisticated studies have taken a closer look at cognition, using standardized tests and grade retention measures. Sibling-based comparisons, which control for family background effects, show that Head Start improves school readiness for white and black children (Currie and Thomas 1995). Sibling-based comparisons also reveal positive Head Start effects for Hispanic children, especially for native-born Hispanics and for Hispanic children of Mexican origin (Currie and Thomas 1999).
While Head Start and early intervention programs have been studied thoroughly, pre-K programs have received less systematic attention. A Michigan study using a non-experimental research design found favorable results: in kindergarten, teachers rated students who attended a pre-K program higher in language, literacy, math, music, and social relations. Students who attended a pre-K program also were more likely to pass the Michigan Educational Assessment Program’s reading and mathematics tests (Xiang and Schweinhart 2002). Some national studies, combining a variety of pre-school programs (state-funded and otherwise), used sibling-based comparisons and reached disappointing conclusions about the efficacy of preschool (Currie and Thomas 1995; Currie and Thomas 1999). A recent national study, using the ECLS-K data, found that kindergarten students who had attended a pre-K program scored higher on reading and math tests than children receiving parental care (Magnuson et al. 2004). This same study found that disadvantaged children benefited more from pre-K than other children and that full-time enrollment was more beneficial than part-time enroll-ment. However, like so many others, this study likely suffers from selection bias, since the characteristics that influence parents’ decisions to enroll a child in the pre-K pro-gram also may contribute to the outcome measures. In fact, while a meta-analysis of state-funded preschool programs in 13 states found statistically significant positive impacts on some aspect of child development in all of the states (Gilliam and Zigler
4. In 2001, the cost per child for Head Start was $6,934 (Head Start Bureau 2003). Currie (2001) estimates that Head Start’s costs were 71 percent of the Perry Preschool Project’s costs, which would make the Perry Preschool Project’s costs $9,763 in 2001 dollars. Masse and Barnett (2003) have estimated that the Abecedarian project cost $13,900 per child in 2002 dollars.
2001, p. 453), none of the studies used random assignment and only one of the evalu-ations used a comparison group that constituted a credible control for selection bias.5
If we know little about the effects of pre-K programs, we know even less about the effects of universal pre-K programs. A Georgia study found that 82 percent of former pre-K students rated average or better on third-grade readiness (Henry et al. 2001), but it lacked an appropriate comparison group. A more recent Georgia study found that economically disadvantaged children attending Georgia’s K program began pre-school scoring below national norms on a letter-and-word recognition test but began kindergarten scoring above national norms (Henry et al. 2003). The latest Georgia study compared Georgia pre-K, Head Start, and other preschool children but did not include children who attended no preschool. In one urban upstate city in New York state, universal pre-K classrooms averaged between 5.7 and 5.8 on the seven-point Early Childhood Environmental Rating Scale (ECERS), with five being good and seven being excellent (Cochran 2002, p. 38). Although encouraging, these results fail to tell us whether New York children performed better because of their exposure to the universal pre-K program. An evaluation of New York’s program was to have been conducted, but it never received funding from the New York state legislature.
III. Oklahoma’s Universal Preschool Program
In 1990, Oklahoma established a pre-K program for disadvantaged children. Specifically, all school districts that wanted to offer a pre-K program received state aid for four-year-olds who met Head Start income eligibility require-ments. The program was well-received, and in 1998 the State Legislature voted to make it universal, triggering substantial increases in enrollments (see Figure 1).
Under the legislation and accompanying state regulations, each of the state’s 543 public school districts can choose to participate in the program. The state provides full funding, with no match required. As of 2002–2003, 494 (91 percent) of the state’s school districts were participating. An estimated 63 percent of all four-year-old chil-dren in Oklahoma were participating in the public pre-K program in 2003–2004—a penetration rate higher than Georgia’s and much higher than New York’s. Thus, in Oklahoma, “universal” means that all school districts are eligible to participate in the program, that almost all four-year-olds have access to the program, and that most four-year-olds actually are enrolled in the program.
One key provision of Oklahoma’s universal pre-K program is that all teachers must have a college degree and a certificate in early childhood education. A corollary is that pre-K teachers receive the same compensation as teachers in public elementary schools, which clearly distinguishes these programs from daycare centers, where wages are much lower. Group sizes are set at 20 and child/staff ratios are set at 10/1. Although pre-K services are provided by public schools, collaborative arrangements are possible. Approximately 18 percent of Oklahoma children enrolled in a public pre-K program are enrolled in a collaborative program with Head Start, a group day-care center, a private school, or some other type of facility.
We decided to focus on the Tulsa Public Schools (TPS) pre-K program for three rea-sons. First, the TPS is the state’s largest school district, in terms of enrollment: 41,495 students, as opposed to 37,231 students in Oklahoma City, the second largest district. Second, the ethnic composition of the TPS student body is quite diverse. The student body is: 44 percent white; 36 percent black; 10 percent Hispanic; 9 percent Native American; and 1 percent Asian. Third, beginning in September 2000, the TPS admin-istered an annual Early Childhood Skills Inventory to students entering TPS pre-K and to students entering TPS kindergarten. Together with TPS’s birthday cutoff policy, this testing allows us to estimate the effects of a universal pre-K program using a regres-sion-discontinuity approach that contrasts the performance of children born just before the cutoff date (the treatment group) to the performance of children born just after the cutoff date (the control group), at the same time controlling for continuous age effects.
A. Tulsa’s Database
In August 2001, TPS administered a 26-item test to most students about to enter their pre-K and kindergarten programs.6The tests were given to students, individually, by TPS teachers, who informed parents in advance that their child would need to be
6. The testing instrument (see Appendix A) used in August 2001 correlates rather well with nationally normed tests, including the Brigance Screens (0.85) and the Battelle Developmental Inventory (0.80) (Daleiden and DeBois 2001, p.8). Performance on the Battelle Developmental Inventory among preschool-ers correlates well with subsequent performance on the Woodcock-Johnson Achievement Test in elementary school (Berls and McEwen 1999). In addition, we were able to establish substantial congruence between the Tulsa testing instrument and Woodcock-Johnson (Working Paper # 1, http://www.crocus.georgetown.edu).
Gormley and Gayer 537
tested at a particular time.7Approximately 76 percent of the district’s 1,690 pre-K dents (1,284) and approximately 66 percent of the district’s 3,441 kindergarten stu-dents (2,276) were tested, yielding a total sample of 3,560 children.8
Did the test-takers make up a representative sample of TPS preschoolers? As Table 1 shows, the gender and free-lunch-eligibility of the tested children are quite similar to their corresponding populations. There are some small, statistically significant dif-ferences in the racial compositions: Hispanic students are underrepresented in our TPS pre-K test sample (10 percent level); black students are underrepresented in our TPS kindergarten test sample (5 percent level); and white students are overrepre-sented in our kindergarten test sample (5 percent level). There are no other statisti-cally significant differences between the observed characteristics of our sample and the observed characteristics of the universe of children, but since few measured char-acteristics are available to us, we cannot say more definitively whether our sample is fully representative of the population of Tulsa four and five-year-olds.
Thanks to the cooperation of the Tulsa Public Schools, we know which children who enrolled in kindergarten in September 2001 participated in the TPS pre-K pro-gram during the previous year. Unfortunately, for children who did not participate in the TPS pre-K program during 2000–2001, we do not know whether they participated in a private pre-K program or the Head Start program, unless the Head Start program was involved in a collaborative relationship with TPS. Thus, for some of the children, we only know that they did not participate in the TPS pre-K program, not whether they had no pre-K experience. This means that our empirical strategy can only esti-mate the treatment-on-the-treated effect—the effect on test scores of attendingTPS pre-K. Given the data limitations, we cannot estimate the intent-to-treat effect—the effect on the population’s test scores of making the TPS pre-K program available.
IV. Empirical Strategy
A. Research Design
This paper examines whether attending a TPS pre-K program leads to short-term improvements in test outcomes for children. The relationship between TPS pre-K and test scores can be captured using the following model:
(1) yi= γXi+ θTi+ui (2) Ti= ΓXi+vi,
where yiis child i’s test outcome; Xiis a vector of observed characteristics of child i; Tiis an indicator variable of whether the child attended a TPS pre-K program; ui cap-tures the unobservable determinants of child test outcomes; and vicaptures the unob-servable determinants of whether the child attended TPS pre-K. The obunob-servable characteristics are race (white, black, Hispanic, Native American, and Asian), gender,
7. Due to scheduling challenges, 19 percent of the TPS pre-K children and 23 percent of the TPS kinder-garten children were tested in a month other than August 2001: approximately half of them were tested in July 2001.
Gormle
y and Gayer
539
Table 1
Comparison of Tested Children to Universe of Children
Pre-K Pre-K Kindergarten Kindergarten
Variable Tested Children Universe Difference Tested Children Universe Difference
Female 0.519 0.499 −0.020 0.486 0.479 −0.007
(0.500) N=1,284 (0.500) N=1,690 P=0.2800 (0.500) N=2,276 (0.500) N=3,441 P=0.6044
White 0.406 0.407 0.001 0.448 0.421 −0.027
(0.491) N=1,284 (0.491) N=1,690 P=0.9561 (0.497) N=2,275 (0.494) N=3,441 P=0.0437
Black 0.389 0.370 −0.019 0.290 0.317 0.027
(0.488) N=1,284 (0.483) N=1,690 P=0.2902 (0.454) N=2,275 (0.465) N=3,441 P=0.0301
Hispanic 0.103 0.124 0.021 0.151 0.153 0.002
(0.304) N=1,284 (0.329) N=1,690 P=0.0750 (0.358) N=2,275 (0.360) N=3,441 P=0.8368
Native 0.084 0.083 −0.001 0.096 0.095 −0.001
American (0.278) N=1,284 (0.276) N=1,690 P=0.9223 (0.295) N=2,275 (0.294) N=3,441 P=0.9000
Asian 0.019 0.016 −0.003 0.015 0.013 −0.002
(0.135) N=1,284 (0.125) N=1,690 P=0.5312 (0.120) N=2,275 (0.115) N=3,441 P=0.5271
Free lunch 0.466 0.460 −0.006 0.513 0.529 0.016
(0.499) N=1,265 (0.499) N=1,822 P=0.7425 (0.500) N=2,239 (0.499) N=3,442 P=0.2380
Reduced- 0.118 0.109 −0.009 0.084 0.087 0.003
price (0.322) N=1,265 (0.311) N=1,822 P=0.4358 (0.277) N=2,239 (0.281) N=3,442 P=0.6925 lunch
Full-price 0.416 0.431 0.015 0.404 0.384 −0.020
lunch (0.493) N=1,265 (0.495) N=1,822 P=0.4070 (0.491) N=2,239 (0.486) N=3,442 P=0.1312
and whether the child qualified for partial, full, or no free lunch. Note that the treat-ment we examine is “TPS pre-K,” which is a pre-kindergarten program administered by TPS and funded by the state of Oklahoma. So the counterfactual to the treatment is either that the child gets no pre-K program or that the child gets another (perhaps private) daycare or pre-K program or Head Start. The treatment of TPS pre-K also includes a possible income effect, because parents who would have paid for a pre-K program if the treatment were not available now have more disposable income to spend on their child.
In order for an OLS estimation of Equation 1 to achieve an unbiased estimate of θ, it must be the case that E[uivi⎪Xi] = 0. If the unobservable determinants of whether a child goes to TPS pre-K are correlated with unobservable determinants of test scores, then a naïve cross-sectional analysis would yield biased estimates of the impact of TPS pre-K on test scores.
The clearest way to estimate the causal impact of TPS pre-K on test scores would be to randomly select each child to be either in the treatment group (attend TPS pre-K) or the control group (do not attend TPS pre-pre-K). Afterward, the children would be given the same test to see whether the treatment affects test outcomes. Randomization assures that E[uivi⎪Xi] = 0. In the absence of a randomized study, we exploit the struc-ture of Tulsa’s child testing program and strict age qualifications in order to identify the causal impact of TPS pre-K on test scores.
Within the Tulsa school district, children were qualified to attend TPS pre-K in aca-demic year 2000–2001 if, and only if, they were born before September 1, 1996 (and after September 1, 1995). Children whose birthdays were between September 1, 1996 and August 31, 1997 were required to wait until the following academic year to enroll in TPS pre-K; at that time, they automatically qualified.9In September 2001, the Tulsa school district administered an aptitude test to all TPS pre-K and kindergarten stu-dents: the identical test was administered to both groups of students. This gives us the following framework with which to work:
Starting TPS Pre-K in 2001 Starting TPS K in 2001 Not yet treated (Control2) Had TPS Pre-K (Treatment)
Did not have TPS Pre-K (Control1) These test-score data could be used in a cross-sectional analysis to compare the scores of kindergarten students who attended TPS pre-K the previous year (Treatment) to the scores of those who did not (Control1), controlling for other observable characteristics. As mentioned earlier, though, such an analysis would likely yield misleading results, because the former group could have unobservable characteristics that differ from the latter group.
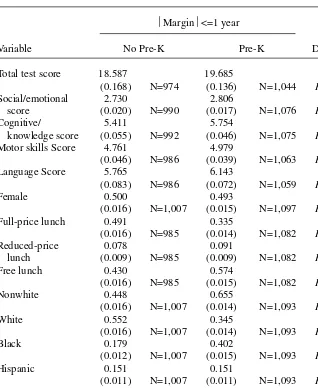
Table 2 illustrates the problem associated with this cross-sectional regression. There are four different tests, measuring social/emotional skills, cognitive/knowledge skills, motor skills, and language skills. We also include the total test score, which is
the sum of the scores from the four tests. Although the treatment group of children who have had TPS pre-K shows statistically significant higher scores for the four different tests, the treatment and control samples differ along many of the observed characteristics. For example, the children who were in TPS pre-K are more likely to
Gormley and Gayer 541
Table 2
Comparison of Mean Test Scores and Covariates for K Children Who Were in TPS Pre-K vs. K Children Who Were Not in TPS Pre-K
⎜Margin ⎜<=1 year
Variable No Pre-K Pre-K Difference
Total test score 18.587 19.685 1.098
(0.168) N=974 (0.136) N=1,044 P=0.0000
Social/emotional 2.730 2.806 0.075
score (0.020) N=990 (0.017) N=1,076 P=0.0037
Cognitive/ 5.411 5.754 0.343
knowledge score (0.055) N=992 (0.046) N=1,075 P=0.0000
Motor skills Score 4.761 4.979 0.219
(0.046) N=986 (0.039) N=1,063 P=0.0003
Language Score 5.765 6.143 0.378
(0.083) N=986 (0.072) N=1,059 P=0.0006
Female 0.500 0.493 −0.006
(0.016) N=1,007 (0.015) N=1,097 P=0.7715
Full-price lunch 0.491 0.335 −0.156
(0.016) N=985 (0.014) N=1,082 P=0.0000
Reduced-price 0.078 0.091 0.012
lunch (0.009) N=985 (0.009) N=1,082 P=0.3120
Free lunch 0.430 0.574 0.143
(0.016) N=985 (0.015) N=1,082 P=0.0000
Nonwhite 0.448 0.655 0.207
(0.016) N=1,007 (0.014) N=1,093 P=0.0000
White 0.552 0.345 −0.207
(0.016) N=1,007 (0.014) N=1,093 P=0.0000
Black 0.179 0.402 0.223
(0.012) N=1,007 (0.015) N=1,093 P=0.0000
Hispanic 0.151 0.151 0.000
(0.011) N=1,007 (0.011) N=1,093 P=0.9991
Native American 0.105 0.085 −0.020
(0.010) N=1,007 (0.008) N=1,093 P=0.1149
Asian 0.012 0.017 0.005
(0.003) N=1,007 (0.004) N=1,093 P=0.2996
have been on the full free-lunch program and less likely to have not qualified for any free-lunch program, and a much higher proportion of these children are black. The differences in observable characteristics suggest that Control1is not a valid con-trol group, and that there may well exist unobservable differences across the two groups. To the extent that these differences influence test outcomes, the regression strategy would yield biased estimates.10
Another estimation strategy would involve comparing the test scores of kinder-garten students who attended TPS pre-K the previous year (Treatment) to the scores of the children just beginning TPS pre-K (Control2). This has the advantage of choos-ing both a treatment and a control group that selected into the treatment, with the lat-ter not yet having been treated. But even if one controls for the effect of age on test scores, a potential problem with this strategy is that, while the selection criteria may be constant over the two years, the different populations may have different charac-teristics. This could be because of changing sociodemographic characteristics within Tulsa over time or changes in the selection process of parents over time. The former suggests the possibility of omitted-variables bias (if unobservable determinants of test scores also differ over time), and the latter suggests the possibility of selection bias (since different populations are selecting into TPS pre-K over time).
The first set of columns in Table 3 confirms these concerns. The difference in test scores between those who qualified and enrolled in TPS pre-K the previous year (denoted as “Before 9/1”) and those who are currently qualified and enrolled in TPS pre-K (denoted as “After 9/1”) is quite substantial. The total test score is 5.7 points higher for those children who were previously in TPS pre-K than for those who are currently in TPS pre-K. Keep in mind that much of this test differential is likely attributable to age differences. But even after controlling for age, the omitted-variable bias and selection bias are a concern in this analysis, because the two groups differ substantially in their other observable characteristics. The treatment group has a higher proportion of children in the full free-lunch program, a lower proportion of children with no or only partial free-lunch program, and a higher proportion of non-whites (especially Hispanics). Again, these differences suggest that the two groups probably also have different unobservable characteristics, which could lead to biased estimates.11
In the second and third set of columns, we can see that narrowing the margin closer to the cutoff qualification birth date results in a decrease in test score differentials, which is likely attributable to the reduced influence of age. We also see that some of the differences in observable characteristics disappear as the margin narrows. For example, there is no statistically significant difference in the proportion of children who are nonwhite once the margin is reduced to six or three months. However, some differences in observable characteristics still persist.
10. A regression comparing kindergarten children who were in TPS pre-K to kindergarten children who were not in TPS pre-K results in estimated test impacts lower than in the regression-discontinuity estima-tions reported later (see Working Paper # 1, http://www.crocus.georgetown.edu).
Gormle
y and Gayer
543
Table 3
Comparison of Mean Test Scores and Covariates Before and After Cutoff Birth Date Kindergarten Classes are conditional on having been in TPS Pre-K.
⎪Margin⎪<=1 year ⎪Margin⎪<=6 months ⎪Margin⎪<=3 months Quadratic Parametric Fit
Variable After 9/1 Before 9/1 After 9/1 Before 9/1 After 9/1 Before 9/1 After 9/1 Before 9/1
(Control) (Treatment) Difference (Control) (Treatment) Difference (Control) (Treatment) Difference (Control) (Treatment) Difference
Total test 13.950 19.685 5.735 15.372 18.626 3.254 15.833 18.254 2.421 16.269 17.625 1.355
score (0.150) N = 1,229 (0.136) N=1,044 P=0.0000 (0.207) N=608 (0.208) N=486 P=0.0000 (0.304) N=293 (0.293) N=268 P=0.000 (0.412) N=1233 (0.389) N=1,062 P=0.0169
Socio- 2.674 2.806 0.132 2.750 2.757 0.007 2.766 2.731 −0.035 2.749 2.688 −0.062
emotional (0.020) N=1,237 (0.017) N=1,076 P=0.0000 (0.026) N=612 (0.027) N=497 P=0.8643 (0.037) N=295 (0.039) N=275 P=.5087 (0.057) N=1241 (0.049) N=1,094 P=0.4082
score
Cognitive 4.006 5.754 1.748 4.443 5.460 1.018 4.465 5.294 0.829 4.577 5.118 0.541
knowledge (0.055) N=1,252 (0.046) N=1,075 P=0.0000 (0.076) N=619 (0.072) N=502 P=0.0000 (0.111) N=301 (0.100) N=279 P=0.0000 (0.153) N=1256 (0.132) N=1,093 P=0.0075
score
Motor skills 3.199 4.979 1.780 3.686 4.741 1.056 3.937 4.653 0.717 4.192 4.417 0.225
score (0.048) N=1,249 (0.039) N=1,063 P=0.0000 (0.067) N=617 (0.059) N=495 P=0.0000 (0.095) N=300 (0.080) N=274 P=0.0000 (0.129) N=1253 (0.114) N=1,081 P=0.1925
Language 4.090 6.143 2.052 4.532 5.688 1.157 4.677 5.540 0.863 4.781 5.342 0.561
score (0.061) N=1,250 (0.072) N=1,059 P=0.0000 (0.087) N=617 (0.107) N=494 P=0.0000 (0.129) N=300 (0.147) N=274 P=0.0000 (0.171) N=1254 (0.206) N=1,077 P=0.0357
Female 0.522 0.494 −0.028 0.522 0.513 −0.009 0.521 0.491 −0.030 0.543 0.475 −0.068
(0.014) N=1,261 (0.015) N=1,093 P=0.1793 (0.020) N=621 (0.022) N=507 P=0.7658 (0.029) N=303 (0.030) N=283 P=0.4645 (0.040) N=1265 (0.044) N=1,111 P=0.2546
Full price 0.415 0.335 −0.080 0.043 0.329 −0.105 0.415 0.322 −0.094 0.419 0.371 −0.048
lunch (0.014) N=1,243 (0.014) N=1,082 P=0.0001 (0.020) N=614 (0.021) N=504 P=0.0003 (0.028) N=301 (0.028) N=283 P=0.0190 (0.040) N=1246 (0.042) N=1,099 P=0.4021
Reduced price 0.117 0.091 −0.027 0.130 0.085 −0.045 0.136 0.106 −0.030 0.117 0.108 −0.009
lunch (0.009) N=1,243 (0.009) N=1,082 P=0.0349 (0.014) N=614 (0.012) N=504 P=0.0168 (0.020) N=301 (0.018) N=283 P=0.2651 (0.026) N=1246 (0.025) N=1,099 P=0.8090
Free lunch 0.467 0.574 0.107 0.435 0.585 0.150 0.449 0.572 0.124 0.463 0.521 0.057
(0.014) N=1,243 (0.015) N=1,082 P=0.0000 (0.020) N=614 (0.022) N=504 P=0.0000 (0.029) N=301 (0.029) N=283 P=0.0027 (0.040) N=1246 (0.044) N=1,099 P=0.3361
Nonwhite 0.600 0.655 0.055 0.596 0.651 0.055 0.617 0.654 0.037 0.621 0.620 0.000
(0.014) N=1,261 (0.014) N=1,093 P=0.0062 (0.020) N=621 (0.021) N=507 P=0.0580 (0.028) N=303 (0.028) N=283 P=0.3593 (0.039) N=1,265 (0.042) N=1,111 P=0.9952
White 0.400 0.345 −0.055 0.404 0.349 −0.055 0.383 0.346 −0.037 0.379 0.380 0.000
(0.014) N=1,261 (0.014) N=1,093 P=0.0062 (0.020) N=621 (0.021) N=507 P=0.0580 (0.028) N=303 (0.028) N=283 P=0.3593 (0.039) N=1265 (0.042) N=1,111 P=0.9952
Black 0.393 0.402 0.008 0.380 0.383 0.003 0.396 0.392 −0.004 0.380 0.349 −0.031
(0.014) N=1,261 (0.015) N=1,093 P=0.6813 (0.019) N=621 (0.022) N=507 P=0.9285 (0.028) N=303 (0.029) N=283 P=0.92550 (0.039) N=1265 (0.043) N=1,111 P=0.5938
Hispanic 0.103 0.151 0.048 0.114 0.168 0.053 0.125 0.177 0.051 0.142 0.175 0.034
(0.009) N=1,261 (0.011) N=1,093 P=0.0005 (0.013) N=621 (0.017) N=507 P=0.0098 (0.019) N=303 (0.023) N=283 P=0.0828 (0.025) N=1265 (0.032) N=1,111 P=0.3997
Native American 0.085 0.085 0.000 0.084 0.089 0.005 0.086 0.074 −0.012 0.096 0.093 −0.003
(0.008) N=1,261 (0.008) N=1,093 P=0.9838 (0.011) N=621 (0.013) N=507 P=0.7650 (0.016) N=303 (0.016) N=283 P=0.6060 (0.023) N=1265 (0.024) N=1,111 P=0.9227
Asian 0.019 0.017 −0.002 0.018 0.012 −0.006 0.010 0.011 0.001 0.003 0.003 0.000
(0.004) N=1,261 (0.004) N=1,093 P=0.7658 (0.005) N=621 (0.005) N=507 P=0.4206 (0.006) N=303 (0.006) N=283 P=0.9331 (0.011) N=1265 (0.011) N=1,111 P=0.9807
Read at home 0.858 0.813 −0.046 0.837 0.820 −0.017 0.834 0.810 −0.024 0.839 0.830 −0.009
(0.011) N=1,093 (0.013) N=955 P=0.0053 (0.016) N=546 (0.018) N=444 P=0.4755 (0.023) N=271 (0.025) N=242 P=0.4779 (0.985) N=1096 (1.144) N=970 P=0.8569
In order to address the concerns about using observational data, we base our empir-ical strategy on the strict birthday cutoff which generates a highly nonlinear relation-ship between age and whether a child attended TPS pre-K in 2000 or 2001.
The assignment of TPS kindergarten attendance in 2001 (versus TPS pre-K atten-dance in 2001) as a function of age lends itself to a regression-discontinuity design (see Cook and Campbell 1979). The control group (consists of those young children who missed the cutoff birth date and therefore were in TPS pre-K in 2001) and the treatment group (consists of those “old” children who made the cutoff birth date and therefore were in TPS pre-K the year before). Even though the older children are likely to be systematically different from the younger children (with these differ-ences contributing to higher test scores), the children who barely missed the September 1 cutoff birth date are likely to be comparable to the children who barely made the cutoff birth date.
The identifying assumption that needs to hold is that the unobservable characteris-tics of the children not vary discontinuously around the cutoff birth date. That is, the children who were in TPS kindergarten in 2001 and attended TPS pre-K in 2000 may be different from the children who attended TPS pre-K in 2001 (aside from differ-ences in age), but the research design assumes that these differdiffer-ences are not discon-tinuous at the cutoff birth date. If there are differences in unobservable characteristics of the children near the cutoff birth date, then this identifying assumption may not hold. For example, parents with children born near the cutoff date might be concerned about their children being either the youngest or oldest in their grade; this may influ-ence their children’s test scores in unobservable ways. A discontinuity of unobserv-able characteristics at the cutoff date could bias our results. But we find that observable characteristics are not discontinuous at the cutoff birth date, which sug-gests (though not conclusively) that the identifying assumption holds. Therefore we believe that the assumption of constant treatment effects is reasonable. However, if the impact of TPS pre-K on test scores is different for children with different birthdays, then one cannot make causal inferences across the range of birthdays.
B. Quadratic Specification
If the birthday cutoff requirement were perfectly enforced, then there would be a per-fectly discontinuous relationship between birth date and enrollment. In that case, a properly specified OLS model, including a dummy variable for whether the child made the cutoff, would result in unbiased estimates of the effect of TPS pre-K (assum-ing, again, that all the other determinants do not vary discontinuously at the same cut-off date).
enough that we proceed as if it were.12That is, we drop the observations for the 18 children who qualified for TPS pre-K in 2000 but were in TPS pre-K in 2001, and we drop the observations for the four children (three born right on the cutoff date) who qualified for TPS pre-K in 2001 but were in TPS kindergarten in 2001. This leaves 2,354 observations in our sample.
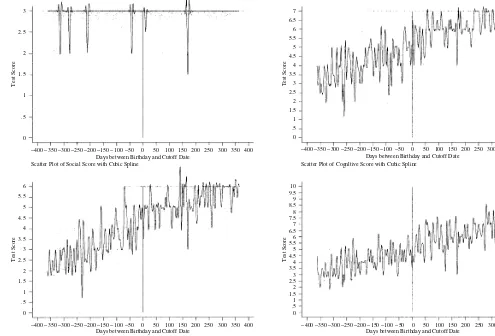
Our goal is to estimate a flexible specification of test scores as a function of age leading up to and after the cutoff birth date. We accomplish this by separately regress-ing test scores on a second-order polynomial of the difference between birth date and cutoff date, for the sample of children born before and after the cutoff date. Figure 2 shows the scatter plots for the four different tests, as well as fitted cubic spline func-tions on both sides of the cutoff birth date.13While not conclusive, the figure suggests that the age/test score relationship is linear on both sides of the cutoff date.
We opted for a second-order, or quadratic, polynomial specification because it offers a more flexible fit for the age/test score relationship. We also tried higher-order polynomials, but the additional terms failed an F-test of joint significance. In addition, our results are fairly robust to linear, quadratic, and higher-order polynomial specifi-cations. Using the quadratic specification, we compare test scores at the limit approaching from the left to test scores at the limit approaching from the right, and any effect of TPS pre-K is then captured in the difference.
The final set of columns in Table 3 shows that this method balances the observable characteristics between the children who were in TPS pre-K in 2001 (control group) and the children who were in TPS pre-K the previous year (treatment group). In the sixth through 16th rows (which show the demographic characteristics), all of the dif-ferences between the treatment and control groups are statistically insignificant.14 This suggests that the quadratic regression-discontinuity design credibly replicates a randomized experiment, since the treatment and control groups are similar along observable characteristics.
The parents of children who just miss the TPS pre-K cutoff date might enroll them in a private pre-K while they wait a year to qualify for the TPS pre-K program. This would effectively give the children who just missed the cutoff date (control group) an extra year of pre-K relative to the children who just made the cutoff date (treatment group). As mentioned earlier, this study can only estimate the treatment-on-the-treated effect, so the counterfactual is what children did in the absence of TPS pre-K. We cannot estimate the intent-to-treat effect because we cannot distinguish between children who enroll in a private pre-K program, children who enroll in another pro-gram, or children who stay at home for the year awaiting TPS pre-K.
12. In a separate analysis (Working Paper # 1, http://www.crocus.georgetown.edu), we include the aberrational observations in the full sample and conduct an instrumental-variables estimation. The findings are very similar to the analysis in this paper, which is expected given the very small number of aberrational observations. 13. The categorical nature of the test data leads to plotting several points on top of each other. In order to make the graphs more readable, we added spherical random noise to each point before graphing. 14. The last row of Table 3 compares the mean values for the treatment and control groups for whether the child sees an adult reading at home. We find no statistically significant difference in this measure between the treatment group and the control group at the discontinuity, which is what one would expect in a ran-domized framework. Because this variable is missing values for many children, we did not include it in our later regressions.
The Journal of Human Resources
Days between Birthday and Cutoff Date
3
Days between Birthday and Cutoff Date Scatter Plot of Social Score with Cubic Spline Scatter Plot of Cognltive Score with Cubic Spline
6
Days between Birthday and Cutoff Date Scatter Plot of Motor Score with Cubic Spline
10
Days between Birthday and Cutoff Date Scatter Plot of Language Score with Cubic Spline
Figure 2
Scatter Plot of Test Scores with Fitted Cubic Splines
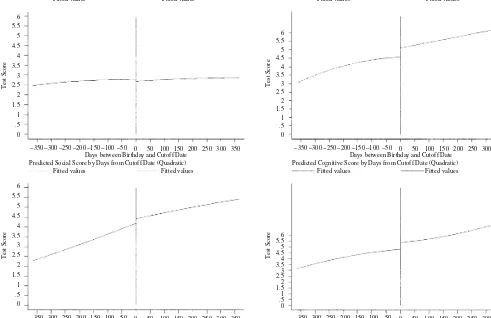
In addition to showing that the covariate observations balance, Table 3 shows that the differences in the cognitive/knowledge test scores and the language test scores remain large and statistically significant at the cutoff date. This indicates that TPS pre-K increases cognitive/knowledge test scores by 0.541 points (out of a possible seven points) and increases language test scores by 0.561 points (out of a possible ten points). These effects are equivalent to 0.28 and 0.23 standard deviations, respectively. Again, these test score effects of TPS pre-K are relative to the control group of children who have not yet received TPS pre-K. Figure 3 shows the predicted values for the test scores at various ages, with a discontinuous increase in these test scores at the cutoff birth date. The figure also suggests that the relationship between test scores and age is pri-marily linear, so while the second-order specification offers added flexibility, it con-tributes little in terms of explanatory power. A linear specification leads to very similar results.
The quadratic regression-discontinuity estimates for test scores can be estimated in a single-equation model that includes the difference (in days) between birth date and cutoff date, the square of this term, a cutoff dummy variable, and interactions. In our specifications, we also include other observable covariates in order to estimate the effects of these covariates on test outcomes. These other covariates (denoted as the vector Xi) measure whether the child receives no free lunch, partial free lunch, or full free lunch (no free lunch is the omitted category); whether the child is a boy or girl; and the race of the child (white, black, Hispanic, Native American, or Asian, with white as the omitted category). The estimation equation is as follows:
(3) yi= γiWi+ γ2Wi2+ γ3(Wi×Ti) + γ4(Wi2×Ti) + θTi+ γ5Xi+ui,
where Wimeasures the number of days between child i’s birthday and the cutoff date, Tiis an indicator variable of whether the child received the TPS pre-K treatment (is born before the cutoff date); and the other variables are as defined earlier. The coeffi-cient estimate of θ gives the mean test score difference at the cutoff date between those who did and those who did not attend TPS pre-K.
V. Results
A. Quadratic Regression-Discontinuity
The last set of columns in Table 3 shows the difference in the predicted probabilities of the test scores using a quadratic parametric fit on both sides of the cutoff date. In Table 4, we estimate Equation 3, which includes the observable covariates in the regression equation. Since the observable covariates are balanced at the cutoff (as shown in Table 3), adding these variables to the regression equation should not sig-nificantly change the estimation results. However, they do allow for tests of the impacts of these characteristics on test scores. Thus, we estimate Equation 3 in order to test the impact of TPS pre-K on the different test scores as well as the impact of the observable characteristics on the test scores.
Table 4 suggests that TPS pre-K does have an impact on three of the four tests. The largest effects are on language scores (0.817 increase; 0.38 standard devi-ations higher) and on cognitive/knowledge scores (0.756 increase; 0.39 standard
The Journal of Human Resources
Days between Birthday and Cutoff Date Predicted Social Score by Days from Cutoff Date (Quadratic)
Fitted values Fitted values
Days between Birthday and Cutoff Date Predicted Motor Skills Score by Days from Cutoff Date (Quadratic)
Test Score
Days between Birthday and Cutoff Date Predicted Cognitive Score by Days from Cutoff Date (Quadratic)
Fitted values Fitted values
Days between Birthday and Cutoff Date Predicted Language Score by Days from Cutoff Date (Quadratic)
Test Score
Figure 3
Predicted Test Scores by Margin of Birthday from Cutoff Date (Quadratic Parametric Fit)
Gormle
y and Gayer
549
Table 4
The Effect of TPS Pre-K on Test Scores: Quadratic Parametric Fit
⎪Margin⎪ =1 Year
Variable Total Social/Emotional Cognitive/Knowledge Motor Language
Born before cutoff (treated) 1.994a −0.043 0.756a 0.413b 0.817a
(0.557) (0.082) (0.197) (0.175) (0.259)
Qualify (days) 0.009c −3.9E-04 0.001 0.006a 0.002
(0.005) (0.001) (0.002) (0.002) (0.002)
Qualify2 −1.5E-05 −3.2E-06 −7.9E-06 2.0E-06 −6.5E-06
(0.000) (0.000) (0.000) (0.000) (0.000)
Qualify *Cutoff −0.003 0.001 0.002 −0.004c −5.3E-04
(0.007) (0.001) (0.002) (0.002) (0.003)
Qualify2 *Cutoff 2.7E-05 2.2E-06 7.9E-06 −1.3E-07 1.5E-05c
(0.000) (0.000) (0.000) (0.000) (0.000)
Female 1.593a 0.153a 0.255a 0.597a 0.560a
(0.187) (0.026) (0.068) (0.059) (0.086)
Black −0.319 −0.026 −0.309a −0.063 0.064
(0.227) (0.032) (0.081) (0.074) (0.103)
Hispanic −3.651a −0.095b −1.427a −0.203b −1.943a
(0.322) (0.047) (0.129) (0.097) (0.141)
Native American −0.056 −0.009 −0.099 −0.079 0.064
(0.350) (0.048) (0.131) (0.108) (0.165)
Asian −1.496c 0.126b −0.569c 0.353 −1.408a
(0.783) (0.058) (0.308) (0.231) (0.412)
Reduced price lunch −0.606c 0.005 −0.186 −0.067 −0.351b
(0.319) (0.044) (0.118) (0.106) (0.146)
Free lunch −1.685a −0.053c −0.523a −0.313a −0.753a
(0.219) (0.030) (0.079) (0.069) (0.100)
Number of Observations 2,246 2,286 2,298 2,283 2,280
Notes: Robust standard errors in parentheses. Statistical significance at the 1 percent, 5 percent, and 10 percent levels (two-tailed) is denoted by “a,” “b,” and “c,” respectively.
Kindergarten Children are Conditional on Having Been in TPS Pre-Kindergarten.
15. If, instead, we estimate natural logs (rather than levels) of the test scores, we find that TPS pre-K leads to a 17.2 percent increase in cognitive/knowledge scores and a 16.5 percent increase in language scores (both significant at the 1-percent level), as well as an 8.4 percent increase in motor skills (significant at the 10-per-cent level).
16. Although we rely on the quadratic results throughout this paper, in another draft we conducted analyses for different functional forms (Working Paper # 1, http://www.crocus.georgetown.edu). We found that the results are robust across linear, quadratic, cubic, and quartic specifications. We also conducted estimations of these alternative functional forms in which the sample was restricted to birthdays within six months of the cutoff birth date. This analysis found very similar point estimates to the results with the one-year margin; however, the reduction in degrees of freedom did increase the standard errors.
deviations higher), both significant at the 1 percent level. There is a smaller increase of 0.413 (0.24 standard deviations higher) on the motor skills score.15
Appendix B replicates the results for cases in which the window around the cutoff date has been narrowed. Because identification in the regression discontinuity research design comes from the observations in the neighborhood around the cutoff, narrowing the margin should reduce any bias (although reducing the number of observations increases the standard errors). The results in Appendix B demonstrate that the point estimates are rather robust as the margin around the cutoff date narrows.16
The absence of statistically significant effects on socioemotional development is worth noting here. It is possible that the measures of socioemotional development are too few (only three) to capture the actual effects of TPS pre-K. Indeed, the mean score on this test was 2.74 (2.67 for the children who missed the cutoff birthday and 2.81 for the children who made the cutoff). And, as the first graph of Figures 2 and 3 shows, there is virtually no variation in this test score across ages. Therefore, the actual impact of TPS pre-K on socioemotional development may be masked by “ceil-ing effects” of the test“ceil-ing instrument.
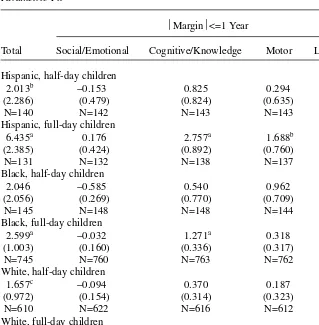
In Table 5 we report results separately for Hispanics, blacks, and whites, depend-ing on whether they were enrolled in a half-day or full-day TPS pre-K program. Each cell of Table 5 contains the estimated TPS pre-K treatment effect for race by half-day/full-day program. The table does not report the coefficient estimates for the other covariates. For each estimation the control group’s race and half-day/full-day desig-nation corresponds to the treatment group’s race and half-day/full-day desigdesig-nation. In the case of Hispanics, we observe higher cognitive scores, higher language scores, and higher motor skills scores for those enrolled in a full-day TPS pre-K program than for those just beginning a full-day TPS pre-K program. In the case of blacks, we find higher language scores and higher cognitive scores for those enrolled in a full-day TPS pre-K program than for those just beginning a full-day TPS pre-K program. We also observe lower socioemotional scores for black children enrolled in a half-day TPS pre-K program than for black children just beginning a half-day TPS pre-K pro-gram. In the case of whites, those enrolled in a half-day TPS pre-K program have higher language scores than those just beginning a half-day TPS pre-K program.
be attributable to the small sample size. For Hispanic children—where the sample sizes are relatively even across full and half-day programs—there is a larger estimated impact of full-day relative to half-day programs. However, even here it is possible that the unob-servable characteristics of Hispanic children who selected into the full-day program dif-fer from those of Hispanic children who selected into the half-day program. If so, one cannot know for sure that a full-day program would be more effective than a half-day program if these Hispanic children—or other Hispanic children—were randomly
Gormley and Gayer 551
Table 5
The Effect of TPS Pre-K on Test Scores by Race and Half-/Full-Day: Quadratic Parametric Fit
⎪Margin⎪<=1 Year
Total Social/Emotional Cognitive/Knowledge Motor Language
Hispanic, half-day children
2.013b −0.153 0.825 0.294 1.119b
(2.286) (0.479) (0.824) (0.635) (0.902)
N=140 N=142 N=143 N=143 N=142
Hispanic, full-day children
6.435a 0.176 2.757a 1.688b 1.801b
(2.385) (0.424) (0.892) (0.760) (0.908)
N=131 N=132 N=138 N=137 N=139
Black, half-day children
2.046 −0.585 0.540 0.962 1.194
(2.056) (0.269) (0.770) (0.709) (1.010)
N=145 N=148 N=148 N=144 N=146
Black, full-day children
2.599a −0.032 1.271a 0.318 0.962b
(1.003) (0.160) (0.336) (0.317) (0.468)
N=745 N=760 N=763 N=762 N=749
White, half-day children
1.657c −0.094 0.370 0.187 1.020b
(0.972) (0.154) (0.314) (0.323) (0.480)
N=610 N=622 N=616 N=612 N=616
White, full-day children
0.294 0.038 −0.208 0.561 −0.030
(1.748) (0.189) (0.617) (0.610) (0.861)
N=217 N=221 N=229 N=226 N=227
assigned to full-day and half-day programs. What we do know is that the full-day program in Tulsa is more effective than the half-day program for Hispanic children who enrolled in these programs. The same logic applies to black children, where we also find the full-day program to be effective for black children who selected into it.
It is possible that we have underestimated the impact of TPS pre-K on white children (especially for cognition), because a fixed-menu test is less likely to capture the achievement of high-performing students from more advantaged backgrounds, who are more likely to be white, than that of students of less priveleged backgrounds, who are more likely to be black or Hispanic.17
While not reported in the tables, we also find large and statistically significant improvements in cognitive/knowledge, motor skills, and language scores for children who qualified for the full free-lunch program. We find no statistically significant effect for the children who did not qualify for free lunch. Also, we find no impact of TPS pre-K on any test score for white children in the full free-lunch program, or for black children who were not receiving full or partial free lunch. This suggests that the advantages of TPS pre-K tend to accrue to minorities of low economic status.
VI. Conclusion
Because Oklahoma’s pre-K program is universal, it is impossible to conduct a randomized experiment to assess its impact on test scores. Relying instead on observational data, we use the strict cutoff age qualification for TPS pre-K in order to replicate randomization.
Oklahoma’s universal pre-K program offers tangible benefits to young children in Tulsa, especially low-income and minority children. For three of the four dimensions we examine—cognition, language, and motor skills—the effects of TPS pre-K on child development are clear. For the entire sample, we find an increase in cogni-tive/knowledge scores of approximately 0.39 standard deviation, an increase in lan-guage scores of approximately 0.38 standard deviation, and an increase in motor skills scores of approximately 0.24 standard deviation. We do not find a statistically signif-icant impact of the TPS pre-K program on socioemotional development, but that might be because of the restrictive survey instrument used and the resulting lack of variation in the social/emotional test scores.18
The positive effects of TPS pre-K are greatest for Hispanic children, followed by black children. For whites, there is only a modest positive impact on language test scores for those in the half-day program. The actual impact of TPS pre-K on white children may be greater than we have reported here because of “ceiling effects” from the testing instrument. We also find a positive impact of TPS pre-K on test scores for
children who qualify for the full free-lunch program. Thus both minority children and children of lower socioeconomic status gain the most from TPS pre-K. These findings support Currie (2001, p. 27), who argued that the “payoff to early intervention is greatest for the most disadvantaged children.”19
However, we do extend Currie’s findings in two respects. First, the positive effects of early intervention are not limited to programs that begin with infants or toddlers. A program that targets four-year-olds, like the Oklahoma pre-K program, can have pos-itive effects on the cognpos-itive, language, and motor skills of young children, especially disadvantaged children. Second, the positive effects of early intervention on disad-vantaged children are not limited to model programs or Head Start programs but also extend to other preschool programs, even massive programs available to children across the socioeconomic spectrum.
Whether the benefits of Oklahoma’s pre-K program exceed the costs is beyond the scope of this paper. However, we can say that the costs of the program appear to be relatively low in comparison to those of the Head Start program or to such celebrated early intervention programs as the Perry Preschool Program and the Abecedarian Project. According to an estimate from the TPS Budget Office, the cost of the Tulsa pre-K program for fiscal year 2003 was: $3,488 per child for the full-day program and $1,714 per child for the half-day program.20Because these figures exclude federal spending (Title I, special education, the school lunch program), they understate the actual cost somewhat. For the full-day program, the actual cost probably falls some-where in between $3,488 per child and $6,088 per child, which is the average cost for all children enrolled in the Tulsa public school system in fiscal year 2003.21
The focus of this paper has been on school readiness. Questions remain as to whether these effects persist over time. Some research suggests that this may vary by ethnic group. For example, Head Start’s positive test score impacts on white and Hispanic children seem to persist over time (Currie and Thomas 1995; Currie and Thomas 1999), while impacts on black children seem to fade after an initial burst (Currie and Thomas 1995). Other studies indicate that student test scores have impor-tant implications for future earnings, especially for disadvantaged children. For exam-ple, Currie and Thomas (2001) found that test scores at the age of seven are good predictors of test scores at the age of 16, and that the latter are good predictors of wages and employment at the age of 33. It is important to look beyond test scores when assessing the effects of Head Start, pre-K, and similar programs. For example,
Gormley and Gayer 553
19. While the positive impacts of the program are higher for minority and low-income children, one cannot rule out the possibility that having children with higher socioeconomic status in TPS pre-K contributes to these higher impacts through spillover effects. For empirical evidence of such spillover effects, see Hoxby (2000); Ludwig, Duncan, and Hirschfield (2001); Ludwig, Ladd, and Duncan (2001); and Sacerdote (2001). Of course, it is possible that children with higher socioeconomic status may experience negative spillover effects, in which case one would want to know whether the positive spillover effects for disadvantaged chil-dren outweigh the negative spillover effects for advantaged chilchil-dren.
20. Figures supplied by Barbara Whisenhunt, Director, Budget Office, Tulsa Public Schools, October 22, 2003.
Appendix A
Survey Instrument
Teacher Name School Test ID# (optional)
EARLY CHILDHOOD SKILLS INVENTORY SCORING SHEET
See “Guidelines for Administration” for item descriptions and complete scoring criteria.
TODAY’S DATE BIRTH DATE AGE MALE/FEMALE
CHECK IF COMPLETED:
VISION HEARING ECSI PARENT FORM IMMUNIZATION RECORD
SCORE ‘0’ OR ‘1’ FOR EACH ITEM
Total scores for each section are the sum of item scores in that section.
SOCIAL/EMOTIONAL
1. Separates from caregiver. . . YES NO NOT OBSERVED (Do not include in total Social/Emotional score)
2. Responds to greeting appropriately . . . . 3. Displays appropriate behavior for situation (Assess at end of test) . . . . . 4. Displays adequate attention span (Assess at end of test) . . . .
SOCIAL/EMOTIONAL SCORE /3
COGNITIVE/GENERAL KNOWLEDGE
1. Names basic colors (circle correct responses) . . .# correct Score (if>=6) Red Blue Green Yellow Orange Purple Black Brown
2. Names basic shapes (circle correct responses). . .# correct Score (if>=3) Circle Square Triangle Rectangle
3. Identifies numerals (circle correct responses) . . . # correct Score (if>=5)
8 5 7 1 3 10 9 2 4 6
4. Names objects and tells meaning of following words: Score (if>=7)
Name Meaning Apple
Book Pencil Car
5. Counts out 5 objects . . . Score (if=5) 6. Sorts pictures by category . . . Score (if all) 7. Recalls digit sets (circle each group child recalls correctly) . . Score (if>=6)
Practice Item Set 1: 2-9 4-6 3-1
5–3 Set 2: 3-8-6 6-1-2 4-1-7 Set 3: 8-2-4-1 5-3-7-2 6-9-3-1
ECSI SCORING SHEET
MOTOR SKILLS
Gross
1. Stands on one foot (for 5 seconds) . . . . 2. Hops on one foot (5 times without touching) . . . .
Fine
1. Copies . . . .O + ∇score (if>=3) 2. Colors circle with control . . . . 3. Prints first name . . . . 4. Uses scissors to cut on a straight line . . . .
RIGHT HANDED LEFT HANDED MOTOR SKILLS SCORE /6
LANGUAGE
1. When asked, “Do you see grown-ups reading at home?” child answers: No Yes (Do not include in total Language score)
2. States first and last name when asked . . . . 3. States age and birthday . . . . 4. Repeats an 8 word sentence . . . .
(Practice item:The bird sings.) The big dog barked at the gray cat.
5. Speaks in complete sentences when describing a picture . . . . 6. Able to follow a series of 3 directions after being told once . . . . 7. Letter recognition . . . R S T L E . . . Score (if>=4) 8. Demonstrates knowledge of books. Opens book in proper orientation Correctly identifies first word on page
9. Identifies rhyming words . . . Score (if all)
Practice: 1. fit—sit Cat—bat 2. glad—dog Sock—ball 3. honey—money
10. Produces rhyming words . . . .Score (if>=2)
Practice: nose 1. car 2. sing 3. tire
LANGUAGE SCORE /10
TOTAL SCORE /26
ADDITIONAL INFORMATION CHECK ANY THAT APPLY:
(Not Included in Total Score)
Gormley and Gayer 557
Appendix B
The Effect of Being Born Before Cut-Off Date on Test Scores:
Quadratic Parametric Fit
(Kindergarten Children are Conditional on Having Been in Tulsa Pre-kindergarten)
Total Soc/Emt Cog/Know Motor Language
1.994a −0.043 0.756a 0.413b 0.817a Margin <=1 Year (0.557) (0.082) (0.197) (0.175) (0.259)
N=2246 N=2286 N=2298 N=2283 N=2280
1.929a −0.011 0.750a 0.373c 0.724b Margin <=9 Months (0.647) (0.097) (0.229) (0.203) (0.301)
N=1633 N=1659 N=1674 N=1661 N=1660
2.192a 0.000 0.822a 0.455c 0.846b Margin <=6 Months (0.791) (0.124) (0.278) (0.249) (0.368)
N=1084 N=1099 N=1111 N=1102 N=1101
2.348b −0.039 1.050a 0.616 0.627
Margin <=3 Months (1.193) (0.194) (0.409) (0.377) (0.548)
N=559 N=568 N=578 N=572 N=572
Notes: Standard errors in parentheses. Each of the rows represents a different set of regressions, each taining to a different margin of the data, as indicated in the row headings. Statistical significance at the 1 per-cent, 5 perper-cent, and 10 percent levels (two-tailed) are denoted by “a,” “b,” and “c,” respectively.
References
Barnett, W. Steven. 1993. “Benefit-Cost Analysis of Preschool Education.” American Journal of Orthopsychiatry63:500–508.
Berls, Abbey, and Irene McEwen. 1999. “Battelle Development Inventory.” Physical Therapy
79:776–83.
Campbell, Frances, and Craig Ramey. 1995. “Cognitive and School Outcomes for High-Risk African-American Students at Middle Adolescence: Positive Effects of Early Intervention.”
American Educational Research Journal32(1):743–72.
Cochran, Moncrieff. 2002. “The Implementation of Universal Prekindergarten in an Urban, Upstate City.” Ithaca, N.Y.: Cornell University, Early Childhood Program. Unpublished. Cook, Thomas D., and Donald T. Campbell. 1979. Quasi-Experimentation: Design and
Analysis Issues for Field Settings.Boston: Houghton Mifflin Co.
Currie, Janet. 2001. “Early Childhood Education Programs,” Journal of Economic Perspectives15(2):213–38.
Currie, Janet, and Duncan Thomas. 2001. “Early Test Scores, School Quality and SES: Longrun Effects on Wage and Employment Outcomes.” Research in Labor Economics
20:103–32.
———. 1999. “Does Head Start Help Hispanic Children?” Journal of Public Economics
———. 1995. “Does Head Start Make a Difference?” American Economic Review85(3): 341–64.
Daleiden, Eric, and Steve DeBois. 2001. “School Readiness: Early Childhood Skills Inventory (ECSI) Validation Study Report.” Presented to the Community Service Council of Greater Tulsa. Tulsa: Department of Psychology, University of Tulsa, July 31.
Diamond, Laura. 2002. “Pre-K Plan Raises Issues.” Florida Times-Union,November 8, p. 1. Garces, Eliana, Duncan Thomas, and Janet Currie. 2002. “Longer Term Effects of Head
Start.” American EconomicReview 92(4):999–1012.
Gilliam, Walter, and Ed Zigler. 2001. “A Critical Meta-analysis of All Evaluations of State-Funded Preschool from 1977 to 1998: Implications for Policy, Service Delivery and Program Evaluation.” Early Childhood Research Quarterly15: 441–73.
Head Start Bureau. 2003. Statistical Fact Sheet for the Fiscal Year 2002. Washington, D.C.: Ad-ministration on Children and Families, U.S. Department of Health and Human Services, June 2. Henry, Gary, Craig Gordon, Andrew Mashburn, and Bentley Ponder. 2001. “Pre-K
Longitudinal Study: Findings from the 1999–2000 School Year.” Atlanta: Georgia State University, Applied Research Center.
Henry, Gary, Laura Henderson, Bentley Ponder, Craig Gordon, Andrew Mashburn, and Dana Rickman. 2003. “Report of the Findings from the Early Childhood Study: 2001–02.” Atlanta: Andrew Young School of Policy Studies, Georgia State University.
Hoxby, Caroline M. 2000. “The Effects of Class Size on Student Achievement: New Evidence from Population Variation.” Quarterly Journal of Economics115(4):1239–86.
Love, John. 2001. “Instrumentation for State Readiness Assessment: Issues in Measuring Children’s Early Development and Learning.” Paper presented at symposium on Assessing the State of State Assessments, Atlanta, Georgia, December 12–14. Available through www.mathematica-mpr.com/PDFs/assapaper.pdf.
Ludwig, Jens, G. J. Duncan, and P. Hirschfield. 2001. “Urban Poverty and Juvenile Crime: Evidence from a Randomized Housing-Mobility Experiment.” Quarterly Journal of Economics116(2):655–80.
Ludwig, Jens, H. F. Ladd, and G. J. Duncan. 2001. “Urban Poverty and Educational Outcomes.” Brookings-Wharton Papers on Urban Affairs.Washington, D.C.: The Brookings Institution. Lytal, Gary. Tulsa Public Schools. 2003. Telephone interview, March 17.
Magnuson, Katherine, Marcia Meyers, Christopher Ruhm, and Jane Waldfogel. 2004. “Inequality in Preschool Education and School Readiness.” American Educational Research Journal41(1):115–57.
Masse, Leonard, and W. Steven Barnett. 2003. “A Benefit Cost Analysis of the Abecedarian Early Childhood Intervention.” New Brunswick, N.J.: National Institute for Early Education Research. Unpublished.
McKey, Ruth, Larry Condell, Harriett Ganson, Barbara Barrett, Catherine McConkey, and Margaret Planz. 1985. “The Impact of Head Start on Children, Families and Communities: Final Report of the Head Start Evaluation, Synthesis and Utilization Project.” Washington, D.C.: CSR, Inc.
Reynolds, Arthur, Judy Temple, Dylan Robertson, and Emily Mann. 2001. “Long-term Effects of an Early Childhood Intervention on Educational Achievement and Juvenile Arrest,” Journal of the American Medical Association285 (May 9):2339–46.
Sacerdote, Bruce. 2001. “Peer Effects with Random Assignment: Results for Dartmouth Roommates.” Quarterly Journal of Economics116(2):681–704.
Wade, Linda. 2003. Tulsa Public Schools. Personal interview, March 13.
Wetzstein, Cheryl. 2002. “The Preschool Push.” Washington Times,November 26, p.2. Xiang, Zongping, and Lawrence Schweinhart. 2002. “Effects Five Years Later: The Michigan