1 HIGH IL-1RA PLASMA LEVEL AS PROTECTIVE FACTOR IN BALINESE
CHILDREN WITH IDIOPATHIC GENERALIZED EPILEPSY
1Anna Marita Gelgel., 2A.A.G.Sudewa Djelantik., 3Thomas Eko Purwata, 4Junita 1Department of Neurology Faculty of Medicine Udayana University,Bali-Indonesia
2Department of Clinical Pathology Faculty of Medicine Udayana University, Bali-Indonesia 3Department of Neurology Faculty of Medicine Udayana University,Bali-Indonesia
4Department of Biology Udayana University, Bali-Indonesia Abstract
Idiopathic generalized epilepsies (IGEs) are the commonest group of epilepsies in children and adolescents. Their type and characteristic of syndromes follow the classification of The International League Against Epilepsy (ILAE) 1989. (1) Seizures as the hallmark of the syndromes resulted from the imbalance between excitatory and inhibitory neurotransmitter.(2).
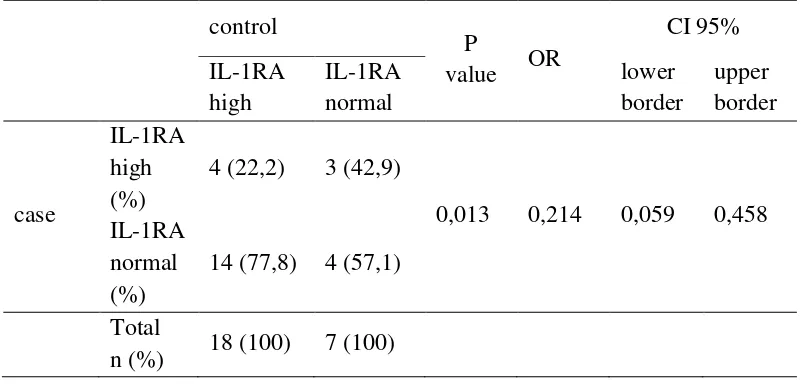
IL-1RA is an inhibitory neurotransmitter that counter act the function of IL-1 and stimulate after the expression of IL-1 plasma. This study was aimed to investigate the plasma level of IL-1RA using standard Elisa method in Balinese children with IGEs (25 pateinets) compare to Balinese children withou IGEs (25 helathy children). They were matched for age and sex and met inclusion and exclusion criterions. The results was (with Mc-Nemar test) high IL-1RA plasma level in Balinese children with IGEs have significantly relationship ( p=0,013) with OR 0,214 (CI 95%=0,059-0,458), and have protective factor of 0,214 times in prevention the development of seizures in Balinese children with IGEs.
2 Introduction
Idiopathic generalized epilepsies (IGEs) are a distinct group of epilepsies, clearly defined in the 1989 International Classification of Epileptic Syndromes and Epilepsies of International Legue Against Epilepsy. This classification established an important dichotomy between the idiopathic epilepsies on the one hand, and the symptomatic or cryptogenic epilepsies on the other1
Although it is now clearly understood that IGEs are primarily of genetic origin, the observations about this disorders still on progress. In the twentieth century, epileptologists all over the world have conducted many experiments with animal models of epilepsy and human specimens from temporal lobe epilepsy (TLE). They found that in epileptic events there are evidences of inflammation play an important role and some cytokines such as excitatory and inhibitory neurotransmitters significantly found in plasma in acute phase following seizures with greater level than normally situations.1,2
The IGEs constitute approximately 15–20% of all epilepsies. They affect all races equally and may have a slight predilection for women. Seizures usually, but not always, have an onset early in life, from childhood to early adulthood. In fact, IGEs are the most frequent group of epilepsies with an adolescent onset.2
3 IL-1RA is structurally related to IL-1α and IL-1β and competes with these molecules for occupation of IL1 cell surface receptors. The presence of the IL-1RA allele II was ascociated with enhanced IL-1β production in vitro. The results further suggest that the IL-1RA allele II as well as the increased production of IL-1β might play a role in preventing febrile convulsions.3
Study of IL-1RA where intrahippocampal application of recombinant IL-1RA or its selective endogenous overexpression in astrocytes under the control of glial acidic fibrillary protein promoter potentially inhibits motor and electroencephalographic seizures induced by bicuculline methiodide in mice. This resulys demonstrate that IL-1RA mediates potent anticonvulsant effects acting on IL-1R type I and suggest that the balance between brain IL-1β and IL-1RA represents a crucial mechanism to control seizure generalization.4
In the present study, we therefore aimed to determine whether IL-1RA high plasma level in Balinese children with IGE has protective factor.
Material and Methods.
Clnical Procedures
4 Sample collection
Venepuncture was performed to collect 3 ml peripheral blood from each subject into tubes and were left to clot in room temperature for about 30 minutes and then were centrifuged at 3000 RPM for 15 minutes. The level of IL-1RA was analysed using Elisa method in pg/ml. The cut off point for the highest level of IL-1RA was determined by using ROC curve since there has no data for IL-1RA level in Balinese children with IGE neither in Balinese healthy children.
Results
Twenty five Balinese children with IGE and twenty five healthy Balinese children were recruited and their characteristics were shown in table 1.
Table 1. The Characteristic of subjects
Characteristic Case (n= 25) control (n= 25)
Age (months) 101,04±47,99 105,12±52,34
Minimal (months) 10 12
Maximal (months) 204 204
Sex
Male 18 (72) 18 (72)
Female 7 (18) 7 (18)
Onset of seizure
> 4 days 19 (76) 0 (0)
< 4 days 6 (24) 0 (0)
No seizures 0 (0) 25 (100)
Family history
Aunty (mother)had seizure 1 (4) 0 (0)
Father had seizure 5 (20) 0 (0)
Mother had seizure 2 (8) 0 (0)
Aunty (father) had seizure 2 (8) 0 (0)
Grand mother had seizure 1 (4) 0 (0)
5 Each group consisted 18 males and 7 females with the rate of age in subjects group was 101,04±47,99 months with the youngest of 10 months and the oldest was 204 months versus in control group with the rate of age was 105,12±52,34 months with the youngest age was 12 months and the oldest was 204 months.
Abnormal distribution was found from case group which with onset of seizure to time of examination >4 days were 19 patients versus <4 days were 6 patients. None in of 25 control group were found to have seizures.
From family history with seizure, we found that 1 patient has seizure history from aunty (mother side) and 5 patients with history of father had seizure, while 2 patients have history of aunty (from father side) had history of seizures, 1 pateints with history of seizure from grandmother had seizure while other 14 with no history of seizures in family.
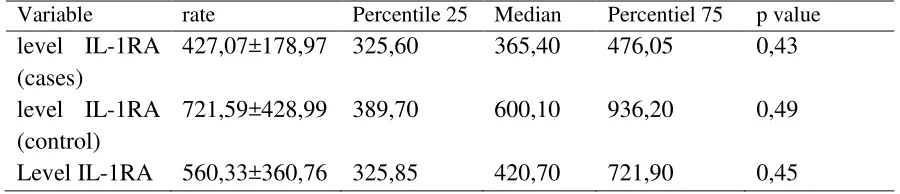
Table 2. the rate, level IL-1RA and data normality test.
Variable rate Percentile 25 Median Percentiel 75 p value
level IL-1RA (cases)
427,07±178,97 325,60 365,40 476,05 0,43 level IL-1RA
(control)
721,59±428,99 389,70 600,10 936,20 0,49 Level IL-1RA 560,33±360,76 325,85 420,70 721,90 0,45
6 Table 3. The relationship of IL-1RA between the two groups
Variable n rate±s.b. difference
rate±s.b. CI 95% P value
level IL-1RA (case)
25 427,07±178,97 294,52±197,32 89,25-260,57 0,007 level IL-1RA
(control)
25 721,59±428,99
[image:6.612.221.392.362.575.2]Table 3 showed the differences rate of IL-1RA level in two groups where in case group had higher IL-1RA level compare to case group. To evaluate the relationship between the rate of IL-1RA with the occurance of seizures we use pair T test and the result was found significantly different between two group (p=0,007). The next step we used ROC table to stated the optimal border value.
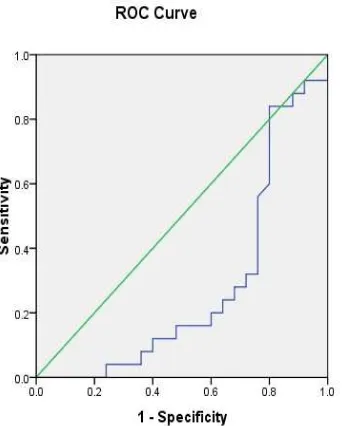
Fig.1 ROC of IL-1RA level.
7 to diagonal line, the worst the result. The best of the cut off point is the longest far left from normal line. The AUC value interpretation are; >50-60% very weak, >60-70% weak, >70-80% moderate, >80-90% fair, >90-100% good. From the ROC curve analysis we found that area under the curve the results of IL-1RA level was 0,278 (CI 95%; 0,130-0,426) with p value=0,007. Diagnostic examination with AUC was 0,278 which meant that if the examination was brought to 100 patients then will have the right conclusions in deciding whether there is a disease for only around 27,8%. Based on this, we found that 436,75 was the best cut off point for evaluation IL-1RA level in plasma with sensitivity 76% and spesifitivity 56%. Based on this optimum value border we divided the IL-1RA level into two groups of hingh level IL-1RA if the level was > 436,75 pg/ml and normal level was ≤ 436,75 pg/ml. we studied the relationship between two group with Mc-Nemar test and the result is shown in table 4. dihubungkan dengan kedua kelompok kasus dan kontrol. Hasilnya akan terlihat pada tabel berikut.
Table 4. cross tabulation between IL-1 RA levels of two groups control
P
value OR
CI 95% IL-1RA high IL-1RA normal lower border upper border case IL-1RA high (%)
4 (22,2) 3 (42,9)
0,013 0,214 0,059 0,458 IL-1RA
normal (%)
14 (77,8) 4 (57,1) Total
n (%) 18 (100) 7 (100)
8 Discussion
IGEs have cumulative incidence of approximately 0,7% in the general population; they account for about 40% of all epilepsies up to age 40 and have a general frequency of around 15-20% of all epilepsies.1 There is no data for the IGE incidence in Bali, but from age characteristic this study revealed that the youngest age was 10 months while the oldest was 18 years old. This study also showed that male (18 pateints/ 72%) more affected than female (7 patients/18%). For most but not all incidence studies, sex-specific differences in incidence are not statistically significant. 5
From the onset of seizures until patients seeking medical advice we divided into two groups; group with <4 days and group >4 days. It is based on the level of IL-1RA in plasma that reaches it”s highest level at 4th day of the seizure and will be dereased after 4th day. The expression of IL-1RA depends on the expression of IL-1 and maximum level of IL-1 is around the 4th day and tend to decrease after it.6
It has been estimated that genetic factors contribute to at least 40% of all epilepsies as mendelian modes of inheritance. Mothers transmitted the disorder to their offspring. In this study we found that 5 (20%) fathers had seizure versus 2 (8%) mothers had seizures; 2 (8%) aunties (from father’s side) and 1 (4%) aunty (from mother’s side), 1 (4%) grand mother has seizure and 14 (56%) patients IGEs without seizures.7
9 to control group. To see whether there was any difference between the two group, we made a pair t test as showed in table 3 that the differences rate of IL-1RA level in two groups where in case group it had higher IL-1RA level compare to the case group. To evaluate the relationship between the rate of IL-1RA with the occurance of seizures we use pair t test and the result was found significantly different between two group (p=0,007). The next step we used ROC table to stated the optimal border value. The set a cut off point in IL-1RA level, we used receiver operating characteristic (ROC) based on sensitivity and specificity value in a very optimal one based on ROC analysis. The ROC curve connected sensitivity value and 1-specificity. Area under curve is used to calculate diagnose accuracy. The diagonal line consists of sensitivity value=1-specificity. The closer the ROC curve to diagonal line, the worst the result. The best of the cut off point is the longest far left from normal line. The AUC value interpretation are; >50-60% very weak, >60-70% weak, >70-80% moderate, >80-90% fair, >90-100% good. From the ROC curve analysis we found that area under the curve the results of IL-1RA level was 0,278 (CI 95%; 0,130-0,426) with p value=0,007. Diagnostic examination with AUC was 0,278 which meant that if the examination was brought to 100 patients then will have the right conclusions in deciding whether there is a disease for only around 27,8%. Based on this, we found that 436,75 was the best cut off point for evaluation IL-1RA level in plasma with sensitivity 76% and spesifitivity 56%. Based on this optimum value border we divided the IL-1RA level into two groups of hingh level IL-1RA if the level was > 436,75 pg/ml and normal level was ≤ 436,75 pg/ml. we studied the relationship
10 effect of IL-1 . In some studies in different disease the researches also showed the same results. 8, 9,10
References
1.Guerrini R, Shorvon SD, Andermann F, Andermann E. 2011. Introduction to the concept of genetic epilepsy. In: Shorvon SD, Andermann F, Guerrini R. eds. The causes of epilepsy. Common and uncommon causes in adults and children. Cambridge university press.UK;43-58
2.Vezzani AM., Peltola J, Janigor D. Inflammation. 2008. In: Engel J, Pedley.T.eds. Epilepsy. A comprehensive Textbook. 2nd edition. Lippincott William & Wilkins. Philadelphia. 267-274
3. Jarrot B, Aprico A. 2010. Microglia: protective and pathogenic mediators.In: Kilpatrick T, Ransohoff RM, Wesselingh S.eds. Inflammatory diseases of the central nervous system. Cambridge Univ press.2010:21-24
3.Tsai FJ, Hsieh YY, chang CC, Lin CC, Tsai CH. 2002. Polymorphisms for interleukin 1b exon 5 and interleukin 1 recepyor antagonist in Taiwanese children with febrile convulsions. Arch Pediatr adolesc med.(156):545-8.
4.vezzani A, Moneta D, Conti M, Richichi C, Raviza T, Luigi AD, De simony MG, Sperks G, Jonsson J. 2000. Powerful anticonvulsant action of IL-1 receptor antagonist on intracerebral injection and astrocytic overexpression in mice. The Salk Institute for biological studies, La Jolla.
5.Banerjee PN, Hauser WA.2008. Incidence and prevalence.In; Engel J, Padley T. Engel J, Pedley.T.eds. Epilepsy. A comprehensive Textbook. 2nd edition. Lippincott William & Wilkins. Philadelphia; 39-43
6.Lukasiuk Lukasiuk K., , Dingledine R., Lowenstein DH., Pitkonen A. 2008;Gene Expression Underlying Changes in Network Excitability. In: Engel, J.ed. Epilepsy. A Comprehensive Textbook.2nd edition. Lippincott Williams & Wilkins. Philadelphia. 307-19
7. Berkovic S. Epilepsy Reseach Group. Clinical Genetic. Availb from;
www.austinmedicine.unimelb.edu.au/research/epilepsy. download April 22nd 2014.
8. Steinlein OK. 2001. Genes and mutations in idiopathic epilepsy. Am J Med. Genet, 106(2):139-45
9..McGeer PL, Schuizer M. McGeer EG. 1996. Arthritis and anti-inflammatory agents as possible
protective factors for Alzheimer’s disease. J Neurology vol 47:452-432
10.Touzani O, Boutin H, LeFeuvre R, Parker L, Miller A, Luheshi G, Rothwel N. 2002. Interleukin-1 influences ischemic brain damage in the mouse independentof the Interleukin-1 type receptor. J of neuroscience vol 22(1):38-43