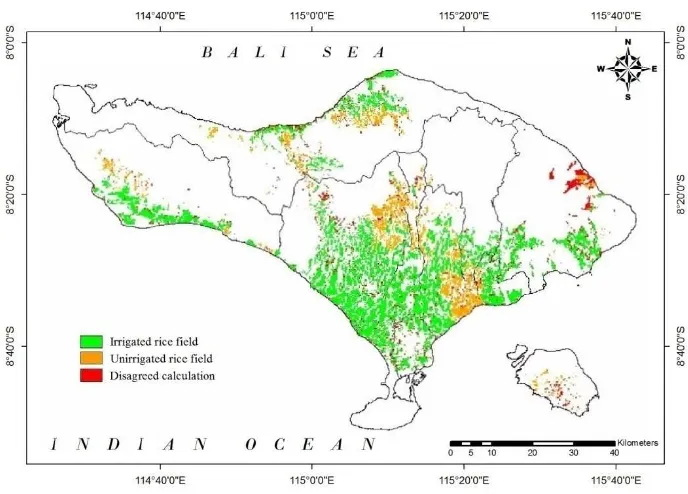
Multitemporal MODIS Data to Mapping Rice Field Distribution in Bali Province of Indonesia Based on the Temporal Dynamic Characteristics of the Rice Plant.
Teks penuh
Gambar


Dokumen terkait
[r]
Fig. 21 Structure of the integrated modelling system with indication of the interactions between the indi- vidual models.. A) MIKE SHE forms the core of the integrated modelling
KANTOR WILAYAH KEMENTERIAN HUKUM DAN HAM NUSA TENGGARA BARAT JALAN MAJAPAHIT NOMOR 44
Dengan demikian dapat disimpulkan secara statistic dengan derajat kepercayaan 95%, diyakini terdapat yang tidak signifikan antara usia kehamilan dengan pre eklampsi
Griffin (ed.), Women’s Employment, Women’s Studies, and Equal Opportunities 1945-2001: Report from Nine European Countries , Hull: University of Hull.. Groden, Michael dan
[r]
Dosen menyerahkan nilai akhir matakuliah kepada
Besarnya nilai R square (r 2 ) adalah 0.825, nilai tersebut digunakan untuk melihat besarnya pengaruh variabel Perceived Usefulness (PU) dan Attitude Toward Using (ATU)
