NON-GOVERNMENTAL INVOLVEMENT IN EDUCATIONAL SERVICES IN INDONESIA: THE CASE OF SIX LOCALITIES1
By Hefrizal Handra
Lecturer at Faculty of Economics, Andalas University, E-mail: [email protected]
ABSTRACT
The involvement of non-governmental sector (NGS), either private (commercial) or social (non-profit) sector, in the provision educational services is quite significant in Indonesia. The establishment of non-public schools in Indonesia is facilitated by the possibility to levy charges for services and subsidies from the Government. Yet, since there is no clear policy about the way in which the Government subsidises non-public schools they are likely to be located in urban and rich localities where reasonable charges or higher subsidies from local governments are possible. Since the level of educational services in cities have been generally higher than in regencies, the NGS involvement in the provision of educational services is potential to increase inequality in the level of services between cities and regencies as well as between rich and poor localities.
Key words: Inequality, Educational Services, Non-Government, Locality, Indonesia.
Introduction
The involvement of non-governmental sector (NGS), either private (commercial) or social (non-profit) sector, in the provision educational services is quite significant in Indonesia. It is expected to increase in Indonesia in line with the new paradigm in public sector management which shifts the role of government from a sole provider of public service to a regulator and an enabler of the NGS involvement.
Moreover, the financial problem faced by the Government of Indonesia since the economic crisis in 1997, an attempt to encourage a more NGS involvement is becoming more relevant. This paper focuses more specifically on analysing the implication of the NGS involvement on the level of educational services in Indonesia. Using the case of six localities (cities/regencies2), this paper argues that the NGS involvement in educational service in
Indonesia is potential to increase inequality in the level of services between localities.
This argument is placed in context of a newly decentralised Indonesia. The decentralisation program which began in 2001 has shifted the Central Government budget allocation from a sectoral approach to a more regionally oriented allocation. Previously, many local services were financed through various kinds of grants for specified activities and central government's sectoral budget allocation, including the salary of most local government officials. Some services were financed directly by the central government through its agencies at the provincial and local level, such as secondary schools, family planning programs and particular health services. Since decentralisation, most local functions have been transferred to local governments. The provision of primary and secondary schools is one of them.
This paper is organised into four sections including this introduction. In the next section, it describes the inequality in the level of educational services between localities in Indonesia shortly after decentralisation. Then, it discusses the NGS involvement in the provision of educational services. It ends with a conclusion and its implication.
Inequality in the Level of Educational Services Between Localities
1 This paper has been presented at the 2nd International Conference of the Asian Academy of Applied Business, Padang 27-29 July 2005.
Indonesia's public services have been noted by a significant degree of inequality between regions (Hill, 2000). Although Hill(2000) suggested that there was a reduction of inequality in education services during the New Order Period3, the disparities were still prevailed
shortly after the implementation of decentralisation law (Law 22/1999 and Law 25/1999) in 2001. The data in six localities in Indonesia (three cities and three regencies) will be presented to show variations.
Table 1 shows variations in the coverage of educational services measured by the Gross Enrolment Ratio4 (GER) and Net Enrolment Ratio5 (NER). In the Indonesian context, these two
indicators reflect the progress of nine years compulsory educational policy announced by the Government in 1996. The Gross Enrolment Ratio (GER) for primary school level in all six localities is above 100 which means that the number of pupils is higher than the number people in the population aged 7-12. Nonetheless, this does not mean that all children aged 7-12 attend primary school. The Net Enrolment Ratio (NER) could tell us more about the percentage of children aged 7-12 not attending primary school. For example, in Sambas, the NER in 2001 is 92.17. This means that about 7.83% of the population, which were about 5,153 children aged 7-12 do not attend primary school. In Indramayu, with an NER of 91.5 in 2001, the number of children aged 7-12 not attending primary school was about 18,200. Some of them may come to the primary school after 7, some may never attend the school, some may have quit school.
Bandung has the highest enrolment rate among the case study localities for both indicators. The NER for Primary School (PS) is higher than 100. This does not necessary mean that all children aged 7-12 were in school since the pupils in Bandung may come from neighbour localities. Educational services do not only enjoy by the city population but also by the population of localities around the city. Nevertheless, the indicator shows that the primary educational services in Bandung city have been sufficient for the city population.
As a whole, the GER data in those six localities at the primary school level, which was higher than 100, shows that the coverage of educational services was already sufficient for entire population aged 7-12. Concern may need to be paid on those aged 7-12 who are not yet in primary school as indicated by the NER. A Low NER for some localities may result from various factors other than available seats at primary schools.
TABLE 1. Comparison of Gross Enrolment Ratio (GER) and Net Enrolment Ratio (NER) in Six Localities in 2000/2001
Localities Primary School Junior Secondary School
GER NER GER NER
Regency of Sambas (2001) 112.6 92.2 53.4 39.0 Regency of Bengkalis (2000) 109.1 96.6 68.7 60.2 Regency of Indramayu (2001) 106.1 91.5 67.8 52.5 The City of Bandung (2001) 130.9 109.7 98.0 77.7 The City of Pontianak (2000/2001) 114.2 93.2 106.6 73.2 The City of Pekanbaru (2000) 117.3 97.7 79.0 55.8 National Average (1999/2000) 111.9 94.5 71.7 55.7 National Minimum Target 2004 115.2 n.a. 81.4 n.a. Sources: Education Office of each local government and Ministry of National Education, Available at http://www.depdiknas.go.id/
3 The New Order Period was from 1966 to 1998 when Suharto was in power.
4 For the primary school level, the GER is the ratio between the number of pupils and the number of people aged 7-12 in the population. for the junior secondary school level, the GER is the ratio between the number of pupils and the number of people aged 13-15 in the population
Regarding the coverage of educational services, the main concern is at the level of Junior Secondary School (JSS) after the six years of primary school (PS). The JSS comprising three years of schooling is now regarded as part of the nine years of primary education since the Government announced the nine years compulsory education for Indonesian in 1996. A problem faced by some localities is the availability of seats at the JSS for graduates of PS.
The coverage of JSS was much lower in regencies than in cities. This can be seen from the GER of the three cities, which were all higher than the national average. Comparing three regencies, Bengkalis was still better then other two regencies (Sambas and Indramayu). The enrolment ratio in two regencies – Sambas and Indramayu – was much lower than the national average and the national minimum target in 2004. These two regencies need a big jump to achieve the national minimum enrolment target in 2004. Whether these regencies are able to achieve the target remains uncertain.
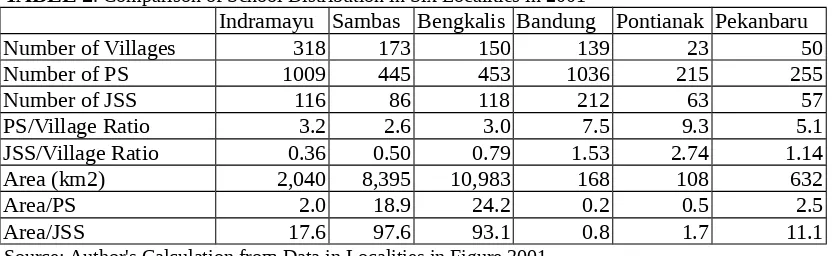
Assessing the reasons behind the low enrolment rates, a possible answer relates to the school distribution in the locality. In Sambas, the number of Junior Secondary School (JSS) in 2001 was only half the number of villages. This means that there was only 1 JSS available for 2 villages. In terms of area, in every 97.6 km2 there was 1 JSS. This ratio was much higher than for Bandung, Pontianak and Pekanbaru.
TABLE 2. Comparison of School Distribution in Six Localities in 2001
Indramayu Sambas Bengkalis Bandung Pontianak Pekanbaru
Number of Villages 318 173 150 139 23 50
Number of PS 1009 445 453 1036 215 255
Number of JSS 116 86 118 212 63 57
PS/Village Ratio 3.2 2.6 3.0 7.5 9.3 5.1
JSS/Village Ratio 0.36 0.50 0.79 1.53 2.74 1.14
Area (km2) 2,040 8,395 10,983 168 108 632
Area/PS 2.0 18.9 24.2 0.2 0.5 2.5
Area/JSS 17.6 97.6 93.1 0.8 1.7 11.1
Source: Author's Calculation from Data in Localities in Figure 2001.
The distribution of PS in those six localities was likely to be adequate, while the availability of JSS in three regencies was insufficient. Looking at table 2, the distribution of PS ranged from at least two PSs for each village in Sambas to nine PSs for each village in Pontianak. In regencies, a village usually represents a concentration of population. Therefore, the availability of one school for one village is likely to be essential. Although a village sometimes covers quite a large area, the population is usually concentrated in a particular residential area. According to the educational officer of those three regencies, currently, each village already has at least one PS. Even in the remote and isolated village in Sambas6, there has been at least one
PS, but not for JSS.
In terms of distribution of PSs, in Bandung, the primary schools exist on average in every 0.2 km2 area, while in Bengkalis there is a primary school in every 24.2 km2 area. In Indramayu, the PS and JSS distribution (in terms of school-village ratio) is almost similar to those in Sambas and in Bengkalis. But, the area-school ratio (km2/school), is relatively lower. This means that the location of schools in Indramayu is more accessible for the population than in Sambas and Bengkalis (the Area/school in Indramayu was 17.6 km2/school for JSS, while it was 97.6 in Sambas and 93.1 in Bengkalis). Therefore, school distribution is likely to be one influential factor for the lower enrolment rate of JSS in Sambas and Bengkalis, but unlikely for Indramayu.
In addition, in the case of Sambas, an officer in education office (Dinas Pendidikan) as well as an officer in local planning agency (Bappeda) in Sambas7 mentioned the possible factors
for a low enrolment rate at JSS level in Sambas as follows:
- The family economic condition forces the children to be involved in helping their parent to raise the income for family. Having finished the PS, they would try to go abroad (primarily to Malaysia) as workers.
- School distribution to the population. Many pupils have to travel several kilometres to their school, which is not supported by the availability of public transportation8 in the region.
- Limited JSS in Sambas forces the children to stop their study after PS. The available seats in JSS is not sufficient for all PS graduates. Only 44% of seats are available at the JSS for PS graduates.
Similar possible factors, as mentioned above, were also found in Indramayu9 but not for
school distribution. For Indramayu, the JSS needs to provide more seats for the PS graduates to facilitate 9 years compulsory education. Nevertheless, economic problems are more dominant in Indramayu. Many children leave the PS for jobs to support the family.
To summarise, the inequality in the level of educational services between six localities at the beginning of decentralisation program was significant. The coverage indicators show that three cities – Bandung, Pontianak and Pekanbaru – had relatively greater coverage of nine years primary educational services than three regencies -Bengkalis, Sambas and Indramayu. The latter (three regencies) had very low levels of service coverage at the JSS level of education. The lack of availability of schools in localities was a dominant factor behind the lower coverage of services despite social and economic factors forcing students to leave school after graduating from primary school.
Non-Government Involvement in Educational Service Provision
Public services in Indonesia can also be provided by non-governmental organisations either by the private/commercial sector or by social/community organisations. Non-governmental involvement in the provision of public services is possible for services for which users could be charged. Educational services are among those services. The main question is that what is the implication of non-governmental involvement on the inequality in the level of educational services between localities?
The involvement of non-governmental sector (NGS), either private (commercial) or social (non-profit) sector, in the provision educational services is quite significant in Indonesia. In 2001/2002, the total number of students in private schools10 was about 20% of total students
in all level of schools (see Table 3). That figure did not include the number of students in public or private religious schools. It could be higher than 20% if the religious sector was included since the number of private madrasyah ibtidaiyah (MI) was about 90% of the total MI in 200111.
The total MI students was about 15% of total primary school students.
The involvement of NGS in educational services in Indonesia is likely to be influenced by the types and the levels of schools. Looking at Table 3, concerning the level of primary schools, more than 90% of students were in public schools, while at the vocational level only about 30% of students were in the state schools. It seems that the higher the level of education and the more specialist the education, the higher the likelihood of non-governmental involvement in education provision. This trend is closely related by the possibility of levying reasonable charges for the students. Reasonable charges were likely for more specialist schools and higher education. Meanwhile, the domination of public schools at the PS level was a result
7 In an interview at 27 January 2003.
8 When I was there for fieldwork on January 2003, I found that ,many JSS students had to catch the inter-city Bus to their schools.
9 In an interview with the head of education office at 14 January 2003.
10 The term "private school", here, is interchangeably with the term public school" or "non-governmental school".
of the national policy of six years compulsory education announced in 1980's. The primary school has been extensively provided through out the regions since then.
TABLE 3. Comparison of The Number of Students of Public and Non-Public Schools in Indonesia in 2001/2002
No. Level of Schools Number of Students 2001/2002 Public Schools Non-Public Schools Total 1 Pre-Schools/Kindergarten 20,242 1.2% 1,731,067 98.8% 1,751,309 2 Primary School 24,016,449 92.9% 1,834,400 7.1% 25,850,849 3 Junior Secondary School 5,493,624 73.6% 1,972,834 26.4% 7,466,458 4 High School12 1,791,935 59.3% 1,232,241 40.7% 3,024,176
5 Vocational School13 596,147 29.4% 1,431,317 70.6% 2,027,464
Total 31,918,397 79.6% 8,201,859 20.4% 40,120,256 Source: Ministry of National Education, available at http://www.depdiknas.go.id/
Note: The number of religious schools' students is excluded.
The data in Table 3 also shows that the number of students at the level of JSS is much lower than that at the level of PS. The comparison of the student number was about 1 for the JSS and 3.5 for the PS. The ideal comparison for the nine years school compulsory policy was 1 for the JSS and 2 for the PS, since the PS is six years school and the JSS is three years school. Regardless of the level of non-governmental contribution at the JSS level, the data indicates that the total national provision for the JSS level was still significantly inadequate for the nine years schooling policies.
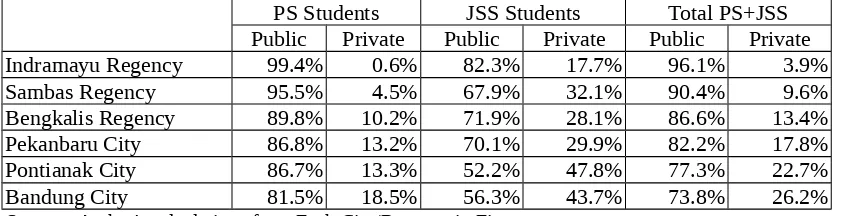
TABLE 4. Comparison of the Number of Students of Public and Private Schools in Six Localities in 2001
PS Students JSS Students Total PS+JSS Public Private Public Private Public Private Indramayu Regency 99.4% 0.6% 82.3% 17.7% 96.1% 3.9% Sambas Regency 95.5% 4.5% 67.9% 32.1% 90.4% 9.6% Bengkalis Regency 89.8% 10.2% 71.9% 28.1% 86.6% 13.4% Pekanbaru City 86.8% 13.2% 70.1% 29.9% 82.2% 17.8% Pontianak City 86.7% 13.3% 52.2% 47.8% 77.3% 22.7% Bandung City 81.5% 18.5% 56.3% 43.7% 73.8% 26.2% Sources: Author's calculations from Each City/Regency in Figure.
Turning to the case of the six localities, the same pattern of non-governmental involvement in education is also seen as given by Table 4. In all six localities, public provision at the PS level was very high ranging from 82% in Bandung to 99% in Indramayu. Meanwhile, public provision at the JSS level is lower than that at the PS level. The involvement of NGS in all six localities at the JSS level ranged from 18% in Indramayu to 48% in Bandung14.
On average, the involvement of NGS in the provision of the PS and the JSS in the cities (Bandung, Pekanbaru, and Pontianak) is relatively higher than in the regencies (Indramayu, Sambas and Bengkalis). Table 4, at the last column, clearly shows such a trend. The percentage
12 High School is referred to "Sekolah Menengah Umum" (SMU) in Indonesia which is the three years general school after the Junior Secondary School (SLTP).
13 Vocational Schools is referred to "Sekolah Menegah Ketrampilan" (SMK) in Indonesia which is the technical secondary schools. This is a choice for the graduate of JSS to continue their study.
of students at the PS and JSS private schools in regencies ranged from the lowest 3.9% in Indramayu to 13.4% in Bengkalis. Meanwhile, in cities, it ranged from 17.8% in Pekanbaru to 26.2% in Bandung.
The data presented above shows that non-governmental involvement in school provision in cities is more promising than in regencies. An economic reason lies behind this phenomenon. There is a possibility for private schools (1) to get a reasonable number of students in cities than in regencies and (2) to levy higher charges in cities than in regencies. Even in regencies, private schools tend to concentrate on the densely populated areas such as in the central town of the regency or sub-districts15.
Non-governmental provision is partly subsidised by the government of both central and local governments. Central Government provided various types of subsidies directly for private schools such as a capita grant for building new classrooms and operational grants to pay the casual teachers. Local governments also provide various subsidies for private schools such as salaries for teachers with civil servant status assigned to such schools, and grants for building new classrooms. The Central Government subsidies for private schools is a program clearly stated in the national development program (propenas) 2000-2004 in field of education16.
Meanwhile, the grant from local governments to private schools is a matter of local programs. There is nothing wrong with a subsidy from the central government to private schools especially at the primary and secondary school level. It could encourage the involvement of non-governmental in primary education, which in turn strengthens government programs to facilitate the compulsory education policy. The problem is that a direct subsidy from Central Government to private schools, without considering the locality in which the schools are located, could contribute to inequality. Considering higher numbers of private schools in cities than in regencies, a direct subsidy from Central Government to private schools benefited cities more than regencies. Cities, which on average had higher level of services, would benefit more from the NGO involvement and implicitly received higher levels of subsidy from the Central Government.
TABLE 5. Comparison of Revenues Per Capita of Six Local Governments in Fiscal Year 2001 Regencies Municipalities
Indramayu Sambas Bengkalis Pontianak Bandung Pekanbaru
Revenue 100 246 991 262 187 298
Sources: Author's calculation from Data provided by the Financial Unit of each locality.
Note: Fiscal Year 2000 was only 9 months, for analysis purposes the data was adjusted to 12 months.
Moreover, a central government policy to encourage private involvement could also disadvantage poor localities like Indramayu and Sambas. The rich localities could facilitate more private schools to gain more from Central Government direct subsidy to non-public schools regardless of the locality. Bengkalis is an example of rich localities. Among those six localities, Bengkalis is the richest. As a comparison, in 2001, the revenue per capita of Bengkalis Regency was 10 times the revenue per capita of Indramayu (see Table 5, the first row). Bengkalis has already had higher NGS involvement than Indramayu and Sambas (see Table 4). With its financial power, Bengkalis provided additional subsidies to non-public schools. With such a difference, the level of educational services between Bengkalis and Indramayu could be even higher in the future.
Conclusion and Implication
To summarise, the level of educational services varied from locality to locality shown by several coverage indicators. The level of educational services in cities (urban localities) is
15 This information was confirmed by the education officer of Sambas and Indramayu in an interview on January 2003.
generally better than in regencies (rural localities). One explanation for such condition is that the involvement of NGS in educational services in cities is higher than in regencies.
The inequality in level of educational services between cities and regencies as well as between rich and poor localities could be even higher in the future since the NGS tends to choose cities and rich localities to involve in school provision since in those localities reasonable charges are possible. Such choice is supported by the government policy which provides subsidies to non-public schools regardless of localities. Moreover, the rich localities could invite more NGS involvement by providing higher subsidies for non-public schools.
Such conclusion suggests that the Government should seriously consider the implication of NGS involvement on inequality in the level of local services between localities. The Government should also encourage the NGS involvement in educational services in rural/poor localities by providing specific grants to such localities.
The NGS involvement is expected to rise in the future in line with the new paradigm in the public sector management which shifts the role of public sector from a sole provider of public services to a regulator and an enabler for the NGS involvement. In relation to the Asian Integrated Market (AIM), it offers a potential for higher involvement of private sector in the provision of public services including in education through various schemes such as such as Public Private Partnership (PPP), Private Finance Initiative (PFI) and Privatisation. The AIM facilitates the flow of capita to Indonesia from countries in Asia and even from other parts of the world. The AIM can be seen as an opportunity for the Government of Indonesia, to gain from and to facilitate the involvement of NGS in public services.
References:
BPS, 2002, Bandung Dalam Angka 2001 (Bandung in Figure 2001). BPS, 2001, Pekanbaru Dalam Angka 2000 (Pekanbaru in Figure 2000). BPS, 2002, Pontianak Dalam Angka 2001 (Pontianak in Figure 2001). BPS, 2001, Bengkalis Dalam Angka 2000 (Bengkalis in Figure 2000). BPS, 2002, Indramayu Dalam Angka 2001 (Indramayu in Figure 2001). BPS, 2002, Sambas Dalam Angka 2001 (Sambas in Figure 2001).
Departement Pendidikan Nasional, Program Pembangunan Nasional (Propenas) 2000-2004 Bidang Pendidikan, available at the official web site of Ministry of National Education, http://www.pdk.go.id/ (the program).