Measuring Customer Based Brand Equity:
Empirical Evidence from the Sportswear Market in China
Xiao Tong, Ph.D
University of Alabama-Birmingham Jana M. Hawley, Ph.D. Kansas State University
Abstract
Purpose - This study seeks to examine the practicality and applications of a customer-based brand equity model in the Chinese sportswear market.
Design/methodology/approach - Based on Aaker’s well-known conceptual framework of brand equity, this study employed structural equation modeling to investigate the causal relationships among the four dimensions of brand equity and overall brand equity in the sportswear industry. The present study used a sample of 304 actual consumers from China’s two largest cities, Beijing and Shanghai.
Findings - The findings conclude that brand association and brand loyalty are influential dimensions of brand equity. Weak support was found for the perceived quality and brand awareness dimensions.
Research limitations/implications - Future research needs to be done if the results are to be expanded into other regional Chinese markets in light of the significant gaps between
different regions. Further research also could strengthen this analysis by adding performance measurement into the model.
Practical implications - The paper shows that sportswear brand managers and marketing planners should consider the relative importance of brand equity in their overall brand equity evaluation, and should concentrate their efforts primarily on building brand loyalty and image.
Originality/value - This study contributes to the scant literature testing the applicability of consumer-based brand equity in the sportswear industry. Since China is the world’s
fastest-growing market for sportswear products, this study also provides important insights about the understanding of Chinese consumers’ perceptions of overall brand equity and its dimensions.
Article type: Research paper
This article was published as:
INTRODUCTION
The active sportswear and athletic footwear product group is one of the most heavily branded areas in the global apparel market. Estimates hold that over three-quarters of the total active sportswear market, and nearly 80 percent of authentic footwear, are branded. According to Just-style, three global sportswear brands, Nike, Adidas, and Reebok, had 33 percent of the global active sportswear and athletic footwear market in 2007 (Newbery, 2008). Branding remains the industry’s largest source of competitive advantage. This is an area of clothing in which customers’ purchasing choices are frequently determined by the sports figures they admire, or the teams they follow, and the brands they aspire to wear (Newbery, 2008). Therefore, brand equity plays a strategic role in helping sportswear brand managers gain competitive advantage and make wise management decisions. When correctly measured, it is the appropriate metric for evaluating the long-term impact of marketing decisions (Simon and Sullivan, 1993).
Although the literature identifies several dimensions of brand equity from other
To accomplish the above stated goals, this paper offers a brief introduction to China’s sportswear market, followed by a review of relevant theoretical literature and a description of the hypotheses of the study. Next, it describes the methodology and rationale for measuring customer-based brand equity. Conclusions and managerial implications follow.
LITERATURE REVIEW
Brand Building in the Chinese Sportswear Market
With 1.3 billion consumers, the encouragement of an optimistic economy, rising disposable incomes, and a growing interest in sports among its consumers, China is seeing its sportswear market burgeoning (Asiamoney, 2006). The China Sporting Goods Industry Report
2006-2007 indicated that annual sales revenues of China’s sporting goods in 2006 were RMB 30-40 billion, and that the country’s sporting goods market had posted an annual growth rate of 10 percent in recent years (Business Wire, 2007). Both the Nike and Adidas brands believe that by 2010, China will become their second-largest sportswear market in the world, just after the United States (Griffin, 2007).
Research consistently shows that rising wealth leads to greater interest in sports, leisure activities, and brands that reflect self-expression in China (Bashford, 2003). First, the
healthier lifestyle, leisure-time sports has become a fashion among the more affluent Chinese (Brand Strategy, 2006). According to the General Administration of Sport in China, by the end of 2005, 37 percent of China's total population had taken part in regular physical exercise, and it was estimated that by 2010 more than 40 percent of the population (about half a billion people) would become active sports participants (China Internet Information Center, 2006). Furthermore, sport in China is more than just a game. It is also about national pride and achievement, and is intimately connected with China’s growing economic power and its emergence onto the world stage (Brand Strategy, 2006). Along with the rise of Chinese athletes on the international stage, such as NBA basketball player Yao Ming, the 2008 Beijing Summer Olympics has also significantly increased interest in sports in China (The Economist, 2003).
Sports styles and the growing population of those who follow and participate in sports have a growing influence in the clothing and footwear market in China. The recent strong growth of sportswear subcategories such as hiking and mountain climbing lifestyle apparel has proved this (Chan, et al., 2007). The 2008 Beijing Summer Olympics was expected to further expand China’s sportswear market by more than 25 percent a year (The Economist, 2003). Nike’s sales in China surged 35 percent in 2007 over the previous year (Barris and Cheng, 2007), and Li-Ning, the mainland’s biggest sportswear company, added 936 brand stores in 2007 to expand its network to 5,233 outlets as it set out to capture the marketing opportunity presented by the Olympics (Li Ning Co. Ltd., 2008).
enjoying strong sales growth in the Chinese market, and they are especially popular among young Chinese consumers because of their reputation, fashion status, comfort, and premium quality (Urbanowicz, et al., 2008). Nike, Adidas, Reebok, Puma, and Fila are the favorite brands, with Nike remaining in the number one spot (Brand Strategy, 2006). An increasingly sophisticated and wealthy customer base and more international brands entering China after the country’s entry into the WTO have resulted in a highly competitive sportswear market. Branding and product images are becoming increasingly important to Chinese consumers, just as they are to those in Europe and the U.S. (Datamonitor, 2005). The competition in China’s sportswear market is now shifting from price to brand building, especially in the medium and premium segments, and branding and product image are becoming increasingly important to Chinese consumers in these segments (The Economist, 2003).
Customer-based Brand Equity (CBBE)
Since the term “brand equity” emerged in the 1980s, there has been a growing interest in the subject among marketing academicians and practitioners (Cobb-Walgren, et al., 1995). The meaning of the term brand equity has been debated in a number of different ways and for a number of different purposes (Keller, 2002). Brand equity is the added value endowed by the brand name (Farquhar, et al., 1991); it is the difference between overall brand preference and multi-attributed preference based on objectively measured attribute levels (Park and
service to a firm and/or that firm's customers.
Compared to the definition of brand equity from a financial perspective as the total value of the brand that is a separable asset when it is sold or included in a balance sheet (Feldwick, 1996), customer-based brand equity is defined from the perspective of the customer and is based on consumer knowledge, familiarity, and associations with respect to the brand (Washburn and Plank, 2002). Proponents contend that for a brand to have value, it must be valued by the customer. If the brand has no meaning to the customer, none of the other definitions is meaningful (Cobb-Walgren et al., 1995; Keller, 1993). Keller (1993, p.2) coined the customer-based definition of brand equity (CBBE) as “the differential effect of brand knowledge on consumer response to the marketing of the brand.”
A thorough understanding of brand equity from the customer’s point of view is essential for successful brand management. As Keller (1993, p.8) explains, positive customer-based brand equity “can lead to greater revenue, lower cost, and higher profit; it has direct
implications for the firm’s ability to command higher prices, a customer’s willingness to seek out new distribution channels, the effectiveness of marketing communications, and the success of brand extensions and licensing opportunities.”
CONCEPTUAL FRAMEWORK AND RESEARCH HYPOTHESES
Conceptual Framework
the firm’s marketing program. The implications of customer-based research suggest that measures of customers’ brand perceptions are accurate reflections of brand performance in the marketplace. Strong, positive customer-based brand equity has a significant influence on the financial performance of the firms (Kim and Kim, 2004).
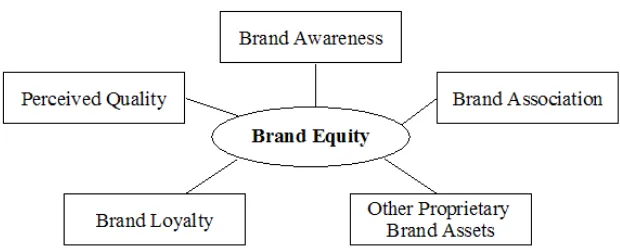
Brand equity is a multidimensional concept and a complex phenomenon. Keller (2002) separated it into two components: awareness and association. Aaker (1991, 1996) grouped it into five categories: perceived quality, brand loyalty, brand awareness, brand association, and other proprietary brand assets such as patents, trademarks, and channel relationships. Among these five brand equity dimensions, the first four represent customers’ evaluations and reactions to the brand that can be readily understood by consumers (Barwise, 1993; Yoo and Donthu, 2001), so they have been widely adopted to measure customer-based brand equity in previous studies. In summary, strong brand equity means that customers have high
brand-name awareness, maintain a favorable brand image, perceive that the brand is of high quality, and are loyal to the brand.
Figure 1 A conceptual framework for brand equity (source: Aaker, 1991)
The Relationship between Brand Equity and Brand Equity Dimensions
Perceived quality. Perceived quality is the “core/primary” facet across the CBBE framework (Aaker, 1996; Farquhar, 1989). It is not the real quality of the product but the customer’s perception of the overall quality or superiority of the product (or service) with respect to its intended purpose, relative to alternatives (Zeithaml, 1988). Perceived quality lends value to a brand in several ways: high quality gives consumers a good reason to buy the brand and allows the brand to differentiate itself from its competitors, to charge a premium price, and to have a strong basis for the brand extension (Aaker, 1991). Marketers across all product and service categories have increasingly recognized the importance of perceived quality in brand decisions (Morton, 1994). Kotler (1991) notes the intimate connection among product and service quality, customer satisfaction, and company profitability.
Based on the above definition and the suggested relationship of perceived quality and brand equity in the literature, the following hypothesis is formulated:
H1: Perceived quality has a significant positive direct effect on brand equity.
Bra e
t
category (Aaker, 1991). According to Keller (1993), brand awareness consists of two sub-dimensions: brand recall and recognition. Brand recognition is the basic first step in the task of brand communication, whereby a firm communicates the product’s attributes until a brand name is established with which to associate them. Brand awareness can be a sign of quality and commitment, letting consumers become familiar with a brand and helping them consider it at the point of purchase (Aaker, 1991). Thus, the following hypothesis is posited:
H2: Brand awareness has a significant positive direct effect on brand equity.
Brand association. Brand association is anything "linked" in memory to a brand (Aaker, 1991). It is believed to contain the meaning of the brand for consumers. Brand association can be seen in all forms and reflects features of the product or aspects
independent of the product itself (Chen, 2001). A set of associations, usually organized in some meaningful way, forms a brand image. Brand associations create value for the firm and its customers by helping to process/retrieve information, differentiate the brand, create positive attitudes or feelings, provide a reason to buy, and provide a basis for extensions (Aaker, 1991). Customer-based brand equity occurs when consumers have a high level of awareness and hold some strong, favorable, and unique brand associations in their memories. Based on this, then, the following hypothesis is posited:
H3: Brand association has a significant positive direct effect on brand equity.
Brand loyalty. Brand loyalty is at the heart of brand equity. It is the major component (Aaker, 1991). Researchers have been challenged to define and measure brand loyalty. From a behavioral perspective, it is defined as the degree to which a buying unit, such as a
category (Schoell and Guiltinan, 1990). From an attitudinal perspective, brand loyalty is defined as “the tendency to be loyal to a focal brand as demonstrated by the intention to buy it as a primary choice” (Oliver, 1997). This study conceptualizes brand loyalty not on the basis of consumer behavior but rather on the basis of consumer perception. According to Aaker (1991), brand loyalty adds considerable value to a brand and/or its firm because it provides a set of habitual buyers for a long period of time. Loyal customers are less likely to switch to a competitor solely because of price; they also make more frequent purchases than comparable non-loyal customers (Bowen and Shoemaker, 1998). Hence, the following hypothesis of the relationship between brand loyalty and brand equity is proposed:
H4: Brand loyalty has a significant positive direct effect on brand equity.
METHODOLOGY
A research framework was designed to test the above-hypothesized relationships in the sportswear industry in China. For this purpose, the sports shoe market was targeted. This consideration was based on the fact that China is the world’s fastest-growing market for sportswear products, and young Chinese consumers, especially urban youth, are increasingly attracted to branded sportswear (Urbanowicz et al., 2008).
Sample and Data Collection
segments for foreign apparel retailers in China (Kwan, Yeung, and Au, 2003).
Shopping center intercept surveys were employed to collect consumer perceptions. Six shopping centers were chosen based on market investigations in Beijing and Shanghai (three in each city). Local graduate students administered the surveys in the selected areas.
Consumers who were visually estimated to be 18 to 39 years old were approached and asked to respond to the questions. A small gift incentive was offered with each questionnaire in order to increase the response rate, but participation was entirely voluntary.
Product Stimuli
Four sports shoe brands—Nike, Adidas, Reebok, and Puma—were selected as stimuli in the study. As the leading sportswear brands among China’s teen and young adult consumers (Brand Strategy, 2006), they represent different combinations of market factors, such as price, market share, marketing strategies, brand/corporation reputation, and country of origin. From the four listed brands, respondents were first asked to choose the one they were most familiar with, then to respond to all the statements in the questionnaire for that specific brand.
Instrument and Measures
conceptual equivalence, the questionnaire was pretested in the U.S. on a sample of bilingual Chinese graduate students from a Midwestern American university and later pretested in China.
The survey questionnaire consisted of items for measuring the dimensions of brand equity, and overall brand equity, as well as demographic questions. Brand equity items were developed from existing scales to measure the five constructs on a five-point Likert scale (1 = strongly disagree to 5 = strongly agree).
Exogenous factors. As previously discussed, four brand equity dimensions—perceived quality, brand awareness, brand association, and brand loyalty—were considered in the customer-based brand equity measure of this study. The scales of brand equity dimensions came primarily from previous research, with some adoptions. Perceived quality measured consumers' subjective judgments about a brand's overall excellence or superiority, using three items adopted from Aaker (1991) and Pappu, Quester, and Cooksey (2005). Measures for brand awareness were adopted from Aaker (1991) and Yoo et al. (2000), with four items measuring the strength of the brand in a consumer’s memory as reflected by the consumer’s ability to identify various elements of it. Brand personality (uniqueness and favorableness) and organizational associations were used as measures for brand association, five items for which were developed based on Aaker (1996), Keller (1993), and Pappu et al. (2005).
Borrowed from Yoo et al. (2000) and Pappu et al. (2005), five items were used to capture the consumer’s overall commitment to being loyal to a specific brand.
examining consumers’ overall attitudes toward the focal brand and their intention to select the brand against its counterpart. An example of the four items developed was “If another brand is not different from X in any way, it seems smarter to purchase X” and “X is more than a product to me.”
Data Analysis
Of the total surveys collected, 304 were considered valid and were used in the final analysis. Twenty-six were eliminated either because they were incomplete or because the respondents did not meet the target age range (18-39 years old).
Structural equation modeling was employed for confirmatory factor analysis and path analyses. We followed the two-step approach recommended by Anderson and Gerbing (1988). In the first stage, the measurement model was analyzed to ensure sufficient reliability and validity of the constructs. In the second stage, the hypotheses of the relationships between constructs were tested. Model fit criteria suggested by Hu and Bentler (1999) were used for both the measurement and the structural model: (χ2)/df, goodness of fit (GFI), adjusted goodness of fit (AGFI), comparative fit index (CFI), root mean square residual (RMR), and root mean square error of approximation (RMSEA). Acceptable models should have (χ2)/df ≤ 3, AGFI ≥ .80, RMR ≤ 0.1, RMSEA ≤ 1.0, and GFI and CFI greater than 0.90.
RESULTS
Demographic Characteristics
to be young, highly educated, single, and with moderate to high incomes. Among the 304 respondents, 69 percent were male (n=210) and 31 percent were female (n=94). More than 80 percent (n=252) were under 30 years of age, 58 percent (n=175) had a college degree, 87 percent (n=264) were single, and approximately 30 percent (n=94) reported household annual income of more than $6,000. The ratio of respondents to the selected four brands was: 47 percent for Nike, 32 percent for Adidas, 12 percent for Puma, and 9 percent for Reebok, which roughly reflect the four brands’ current positions in terms of market share in the Chinese market (China Daily, 2007).
Reliability and Validity of Measures
First, Cronbach’s alpha coefficients were used to examine the internal consistency of the items, and items with adequate Cronbach’s alphas were retained for the scales. The result was that one brand awareness statement, one brand association statement, and one overall brand equity statement were excluded from the final scale due to a low item-total correlation. The value of Cronbach’s alpha for “Brand Awareness” was calculated as a score of 0.68, which was very close to the traditional acceptable value of 0.70. Four other constructs met the recommended cut-off value. As a result, all of the constructs were acceptable and a total of eighteen items were retained for the five constructs in the study.
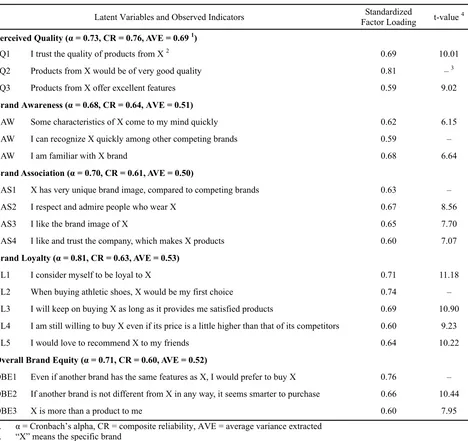
Table 1. Confirmatory factor analysis for the constructs
Latent Variables and Observed Indicators Factor Loading Standardized t-value 4
Perceived Quality (α = 0.73, CR = 0.76, AVE = 0.69 1)
PQ1 I trust the quality of products from X 2 0.69 10.01
PQ2 Products from X would be of very good quality 0.81 – 3
PQ3 Products from X offer excellent features 0.59 9.02
Brand Awareness (α = 0.68, CR = 0.64, AVE = 0.51)
BAW Some characteristics of X come to my mind quickly 0.62 6.15
BAW I can recognize X quickly among other competing brands 0.59 –
BAW I am familiar with X brand 0.68 6.64
Brand Association (α = 0.70, CR = 0.61, AVE = 0.50)
BAS1 X has very unique brand image, compared to competing brands 0.63 –
BAS2 I respect and admire people who wear X 0.67 8.56
BAS3 I like the brand image of X 0.65 7.70
BAS4 I like and trust the company, which makes X products 0.60 7.07
Brand Loyalty (α = 0.81, CR = 0.63, AVE = 0.53)
BL1 I consider myself to be loyal to X 0.71 11.18
BL2 When buying athletic shoes, X would be my first choice 0.74 –
BL3 I will keep on buying X as long as it provides me satisfied products 0.69 10.90 BL4 I am still willing to buy X even if its price is a little higher than that of its competitors 0.60 9.23
BL5 I would love to recommend X to my friends 0.64 10.22
Overall Brand Equity (α = 0.71, CR = 0.60, AVE = 0.52)
OBE1 Even if another brand has the same features as X, I would prefer to buy X 0.76 – OBE2 If another brand is not different from X in any way, it seems smarter to purchase 0.66 10.44
OBE3 X is more than a product to me 0.60 7.95
1. α = Cronbach’s alpha, CR = composite reliability, AVE = average variance extracted 2. “X” meansthe specific brand
3. “–” means the path parameter was set to 1, therefore, no t-value was given 4. All loadings are significant at 0.001 level
All factor loadings were significant, and varied from 0.59 to 0.81, satisfying the convergent validity criteria (Bagozzi, Yi, and Phillips, 1991). Unidimensionality and
reliability, and average variance extracted. In addition, the discriminant validity of the scales evaluated for all possible paired combinations of the constructs and allχ2 differences were significant, demonstrating good discriminant validity of all scales.
Structural Model
According to our hypotheses, a structural equation modeling was developed to assess the statistical significance of the proposed relationships between overall brand equity and its dimensions (see Figure 2). Perceived quality, brand awareness, brand association, and brand loyalty were all taken as the exogenous variables, and brand equity was the endogenous variable. Here, all of the four exogenous variables were proposed to be intercorrelated.
Figure 2 Relationships between four dimensions of brand equity and overall brand equity
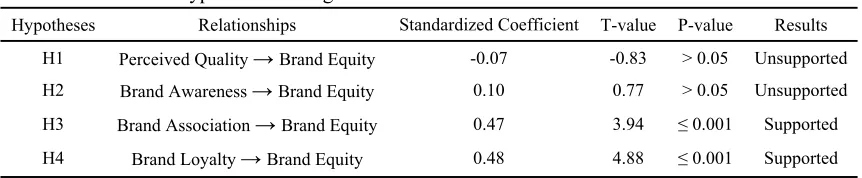
The results provided strong support for H3 and H4, which indicated the positive and direct role of brand association (β = 0.47, t = 3.94) and brand loyalty (β = 0.48, t = 4.88) in
affecting brand equity. However, both perceived quality (β = - 0.07, t = -0.83) and brand awareness (β = 0.10, t = 0.77) were found to have either very low or negative parameter estimates. Therefore, its was concluded that they did not have a direct significant influence on brand equity (see Table 2).
Table 2. Results of hypotheses testing
Hypotheses Relationships Standardized Coefficient T-value P-value Results
H1 Perceived Quality →Brand Equity -0.07 -0.83 > 0.05 Unsupported
H2 Brand Awareness → Brand Equity 0.10 0.77 > 0.05 Unsupported
H3 Brand Association → Brand Equity 0.47 3.94 ≤ 0.001 Supported
H4 Brand Loyalty →Brand Equity 0.48 4.88 ≤ 0.001 Supported
Explained variance (R2) = 0.80
DISCUSSION AND MANAGERIAL IMPLICATIONS
common conceptual framework for the measurement of customer-based brand equity, on the sportswear industry in a representative Chinese sample.
Although these findings do not completely support all of Aaker’s brand dimensions, we found that both brand associations and brand loyalty had a significant effect on band equity. Loyalty demonstrated the strongest impact, indicating the essential role of developing brand loyalty in building brand equity in the Chinese sportswear market. This result confirms other research findings, such as Yoo et al. (2000) and Kim and Kim (2004). In addition, the results show that brand association is positively related to brand equity. This means that, consistent with previous studies, strong associations that support a competitively attractive and distinct brand position could create a favorable feeling and behavior toward the brand and lead to a strong sportswear brand in China (Kim and Kim, 2004; Yoo et al., 2000).
The empirical data and statistical tests in this study did not provide enough support for the positive and direct relationship between perceived quality and brand awareness and brand equity, indicating that having high quality or having a brand name alone is not a guarantee of a successful brand in the sportswear industry. This result is also in line with some earlier studies (e.g., Swait, et al., 1993; Yoo et al., 2000).
Many previous studies also suggested a potential casual order might exist among the brand equity dimensions (Oliver, 1997; Yoo et al., 2000).
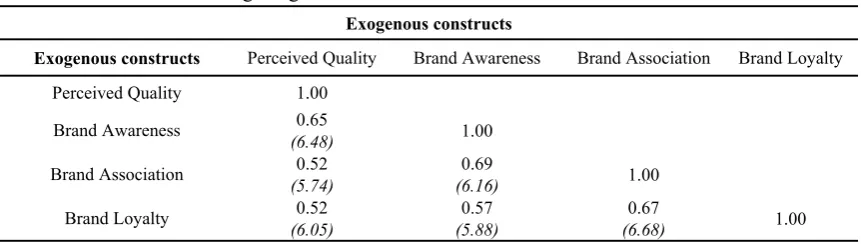
Table 3. Correlations among exogenous constructs
Exogenous constructs
Exogenous constructs Perceived Quality Brand Awareness Brand Association Brand Loyalty Perceived Quality 1.00
Note: t values are in parentheses; All correlations are significant at 0.001 levels
Although these findings are based on the evidence from the sportswear industry in China, they are helpful in other clothing-related industries as well, such as general clothing, footwear, fashion accessories, and cosmetics. They suggest that different brand equity dimensions contribute to overall equity in different ways, and that an order exists among the four
dimensions. Since marketing/brand managers often have limited resources (e.g. money, time, and manpower) to implement branding strategies, these findings can help them prioritize and allocate resources across the dimensions.
Two implications can be derived here. The first is that managers should concentrate their efforts primarily on brand loyalty and brand image, which have high importance in the
strong brand image and brand loyalty (Aaker, 1991; Cobb-Walgren et al., 1995; Fan and Pfitzenmaier, 2002; Keller, 2002; Yoo et al., 2000).
The second implication is that marketing/brand managers should consider the
intercorrelations among the four dimensions of brand equity, especially the relationship of perceived quality to brand association and brand loyalty, and the relationship of brand awareness to brand association and brand loyalty. While brand awareness serves as a
foundation for brand image and brand loyalty, high quality enables consumers to recognize a brand’s distinctiveness and superiority and leads to consumer satisfaction and loyalty (Aaker, 1991; Oliver, 1997). As a result, we suggest that when concentrating on creating brand association and brand loyalty, managers should not undervalue the effects of perceived quality and brand awareness.
LIMITATIONS
This study has two major limitations. First, it is limited to the sportswear market in China and focuses on only the two largest cities, Beijing and Shanghai. Thus, future research needs to be done if the results are to be expanded into other regional Chinese markets in light of
REFERENCES
Aaker, D.A. (1991), Managing Brand Equity, Free Press, New York, NY.
Aaker, D.A. (1996), Measuring Brand Equity Across Products and Markets, Free Press, New York, NY.
Agarwal, M.K., and Rao, V. (1996), “An empirical comparison of consumer based measures of brand equity”, Marketing Letters, Vol. 7, No. 3, pp. 237-247.
Anderson, J.C. and Gerbing, D.W. (1988), “Structural equation modeling in practice: A review and recommended two-step approach”, Psychological Bulletin, Vol. 103, No. 3, pp. 411-423.
Asiamoney (2006), “League tables - narrowing the consumer focus in China”, June, p. 1. Atilgan, E., Aksoy, S., and Akinci, S. (2005), “Determinants of the brand equity: A
verification approach in the beverage industry in Turkey”, Marketing Intelligence and Planning, Vol. 23, No. 2/3, pp. 237-248.
Bagozzi, R. and Yi, T. (1988), “On the evaluation of structural equation models”, Journal of the Academy of Marketing Science, Vol. 16, No. 1, pp. 74-94.
Bashford, S. (2003), “Beware piracy if you’re breaking China”, Promotions and Incentives, September, pp. 15-16.
Barris, M. and Cheng, A. (2007), “Earnings digest: Nike, paced by sales abroad, expects more gains”, Wall Street Journal, 20 December, pp. C.7.
Barwise, P. (1993), “Brand equity: Snark or boojum?” International Journal of Research in Marketing, Vol. 10, No. 1, pp. 93-104.
and Restaurant Administration Quarterly, Vol. 39, No.1, pp.12-25.
Brand Strategy (2006), “Chinese sports: China flexes its muscles”, September 14, pp. 40. Brisling, R.W., Lonner, W.J., and Robert, M. (1973), Cross-cultural Research Methods, John
Wiley and Sons, New York, NY.
Business Wire (2007), “China sporting goods industry report 2006-2007 out now”, September 20.
Chan, W., Cheung, R., and Tse, A. (2007), “China: Small budgets, small wardrobes”, The McKinsey Quarterly, November, pp. 1-3.
Chen, C. (2001), “Using free association to examine the relationship between the characteristics of brand associations and brand equity”, The Journal of Product and Brand Management, Vol.10, No. 6/7, pp. 439-451.
China Internet Information Center (2006), “Nationwide physical fitness program retrieved”, available at: http://www.china.org.cn/archive/2006-12/27/content_1193374.htm (assessed 10 May 2008).
China Internet Information Center (2007), “Olympics a golden opportunity for sportswear firms”, available at: http://www.china.org.cn/english/olympic/205276.htm (assessed 1 August 2008).
Cobb-Walgren, C.J., Beal, C., and Donthu, N. (1995), “Brand equity, brand preferences, and purchase intent”, Journal of Advertising, Vol. 24, No. 3, pp. 25-40.
Datamonitor (2005), “Footwear in China: industry profile”, available at: Business Source Complete Database (assessed 6 February 2008).
consumer market segments for foreign apparel products”, The Journal of Consumer Marketing, Vol. 21, No. 4/5, pp. 301-315.
Fan, Y., and Pfitzenmaier, N. (2002), “Event sponsorship in China”, Corporate
Communications, Vol. 7, No. 2, pp. 110-116.
Farquhar, P. H. (1989), “Managing brand equity”, Marketing Research, Vol.1, No. 9, pp. 24-33.
Farquhar, P.H., Han, J.Y. and Ijiri, Y. (1991), “Recognizing and measuring brand assets marketing science institute working paper series”, working paper (report No. 91-119),
Marketing Science Institute, Cambridge, MA.
Feldwick, P. (1996), “What is brand equity anyway, and how do you measure it?”, Journal of the Market Research Society, Vol. 38, No. 2, pp. 85-104.
Griffin, C. (2007), “The race is on”, SGB, Vol. 40, No. 11, pp. 12-13.
Hair, J.F., Jr., Anderson, R.E., Tatham, R.L., and Black, W.C. (1998), Multivariate Data
Analysis(5th edition), Prentice Hall, Upper Saddle River, NJ.
Hu, L. and Bentler, P. M. (1999), “Cutoff criteria for fit indexes in covariance structure analysis: Conventional criteria versus new alternatives”, Structural Equation Modeling, Vol. 6, pp. 1-55.
Keller, K.L. (1993), “Conceptualizing, measuring, and managing customer-based brand equity”, Journal of Marketing, Vol. 57, No. 1, pp. 1-22.
Keller, K.L. (2002), Strategic Brand Management: Building, Measuring, and Management Brand Equity (Second Edition), Pearson Education, Upper Saddle River, NJ.
Investigating the relationship between brand equity and firms' performance”, Cornell Hotel and Restaurant Administration Quarterly, Vol. 45, No. 2, pp. 115-131.
Kotler, P. (1991), Marketing Management: Analysis, Planning Implementation and Control
(7th edition), Prentice Hall, Upper Saddle River, NJ.
Kwan, C.Y., Yeung, K.W., and Au, K.F. (2003), “A statistical investigation of the changing apparel retailing environment in China”, Journal of Fashion Marketing and Management, Vol. 7, No. 1, pp. 87 -100.
Mitchell, R.J. (1993), “Path analysis: pollination”, in Schneider, S. M. and Gurevitch, J. (Ed.),
Design and Analysis of Ecological Experiments, Chapman and Hall, New York, NY, pp. 211-231.
Morton, J. (1994), “Predicating brand preference”, Marketing Management, Vol. 2, No. 4, pp. 32-44.
Newbery, M. (2008), Global Market Review of Active Sportswear and Athletic Footwear -
Forecasts to 2014: 2008 Edition, Just-style.com, Bromsgrove, Worcs, UK.
Oliver, R.L. (1997), Satisfaction: A Behavioral Perspective on The Consumer, McGraw Hill, New York, NY.
Park, C.S. and Srinivasan, V. (1994), “A survey-based method for measuring and
understanding brand equity and its extendibility, Journal of Marketing Research, Vol. 31, pp. 271-288.
Schoell, W.F., and Guiltinan, J.P. (1990), Marketing Contemporary Concepts and Practices, Allyn and Bacon, Boston, MA.
Simon, C.J., and Sullivan, M.W. (1993), “The measurement and determinants of brand equity: a financial approach”, Marketing Science, Vol. 12, No.1, pp.28-53.
Singh, J. (1995), “Measurement issues in cross-national research”, Journal of International Business Studies, Vol. 26, No. 3, pp. 573-596.
Swait, J., Erdem, T., Louviere, J., Dubelaar, C. (1993), “The equalization price: A measure of consumer-perceived brand equity”, International Journal of Research in Marketing, Vol. 10, No. 1, pp. 23-45.
Tepeci, M. (1999), “Increasing brand loyalty in the hospitality industry”, International Journal of Contemporary Hospitality Management, Vol. 11, No. 5, pp. 223-229.
The Economist (2003), “Business: "Just do it" Chinese-style; China and brands”, Vol. 368, No. 8335, pp. 67.
Urbanowicz, N., Murphy, R., and Ernst, J. (2008), “Taking stock the bottom line on the shoe biz”, Footwear News, April 28, pp. 20.
Washburn, J. and Plank, R. (2002), “Measuring brand equity: An evaluation of a consumer-based brand equity scale”, Journal of Marketing Theory and Practice, Vol. 10, No. 1, pp. 46-62.
Yoo, B., Donthu, N., and Lee, S. (2000), “An examination of selected marketing mix elements and brand equity”, Academy of Marketing Science, Vol. 28, No. 2, pp. 195-212.