40
This chapter discussed about the research finding and discussion. Research finding in this case consisted of description of the data of the third students TBI of IAIN Palangka Raya and the result of the data analyze (testing hypothesis using manual calculations and testing hypothesis using SPSS 16 program).
A. Research Finding
In this section would be describe the obtained data of vocabulary mastery of the third semester students of English education study program of IAIN Palangka Raya. The presented consisted of Mean, Median, Modus, Standard Deviation, Testing Validity and Reliability, Testing Normality, Index of Difficulties, Data Interpretation, and The Result of Analyze.
B. Description of The Data and Data Presentation
students did not following the vocabulary mastery level of the third semester students of English education study program of IAIN Palangka Raya. The presented data consisted of the score test score. The components below such as noun, verb, and adjective. From the table above it can be seen where the highest score and the lowest score.
The data presentation of the score of the third semester students shown in the table frequency distribution, the chart of frequency distribution, the measurement of central tendency (mean, median, and modus) and the measurement of standard deviation.
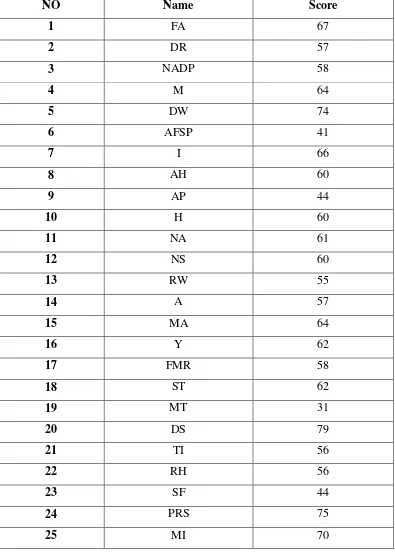
Based on the items of the test in vocabulary mastery level of third semester students of English education study program of IAIN Palangka Raya, the writer constructed the description the students score of research class.
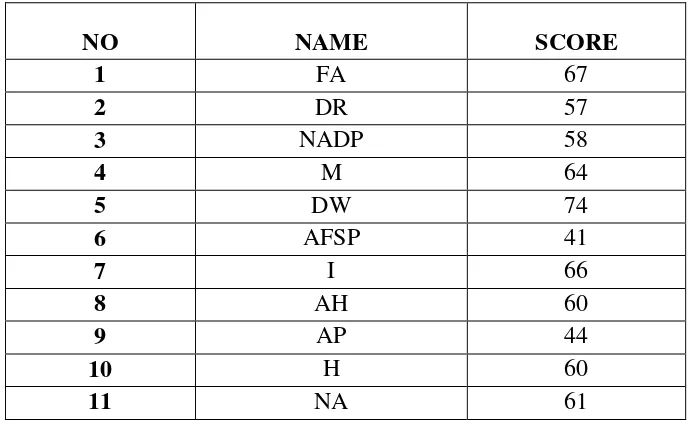
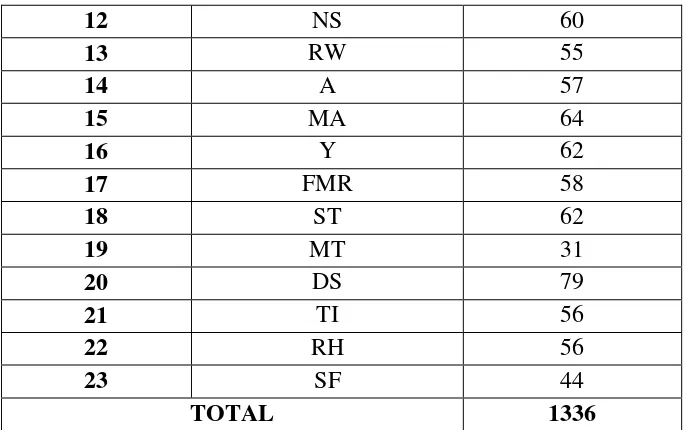
Table 4.1
The Description of Students’ Score Test
Based on the Vocabulary Mastery Level of Third Semester A Class
12 NS 60
Based on the study data above, there was 3 student’s absent, it can be
seen the student’s there was 2 student’s interpretation good, there was 10
student’s interpretation fair, there was 7 student’s interpretation poor, and
there was 4 student’s interpretation very poor.
Table 4.2
Data Interpretation A Class
NO Student’s Interpretation Value
1 0 Very Good A
2 2 Good B
3 10 Fair C
4 7 Poor D
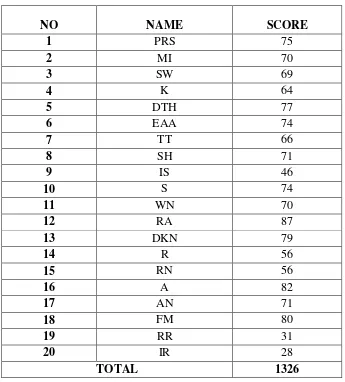
Table 4.3
The Description of Students’ Score Test
Based on the Vocabulary Mastery Level of Third Semester B Class
NO NAME SCORE
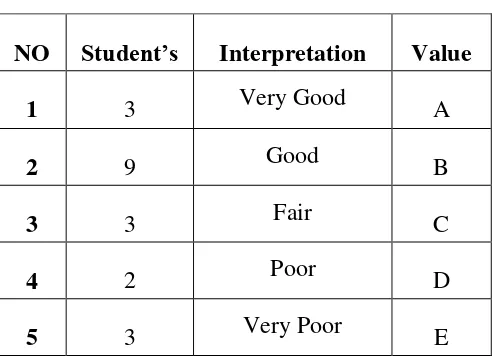
can be seen the student’s there was 3 student’s interpretation very good,
there was 9 student’s interpretation good, there was 3 student’s
interpretation fair, there was 2 student’s interpretation poor, and there
Table 4.4
Data Interpretation B Class
NO Student’s Interpretation Value
1 3 Very Good A
The Description of Students’ Score Test
Based on the Vocabulary Mastery Level of Third Semester C Class
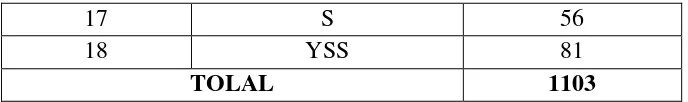
17 S 56
18 YSS 81
TOLAL 1103
Based on the study data above, there was 4 student’s absent, it
can be seen the student’s there was 2 student’s interpretation very good,
there was 4 student’s interpretation good, there was 5 student’s
interpretation fair, there was 4 student’s interpretation poor, and there
was 3 student’s interpretation very poor.
Table 4.6
Data Interpretation C Class
NO Student’s Interpretation Value
1 2 Very Good A
2 4 Good B
3 5 Fair C
4 4 Poor D
Table 4.7
The Description of Students’ Score Test Based on the Vocabulary Mastery Level of Third Semester
56 RJ 29
57 RAA 73
58 SF 82
59 SP 56
60 S 56
61 YSS 81
Based on the study all of the data above, it can be seen student’s highest score was 87 and the student’s lowest score was 28. To determine range of the score, the calss interval, and interval of temporary, the writer calculated using formula as follows:
The Highest Score (H) : 87
The Lowest Score (L) : 28
The Range of Score (R) : H – L + 1
: 87- 28 + 1
: 60
The Class Interval (K) : 1 + (3.3) x Log n
: 1 + (3.3) x log 61
: 1 + (3.3) x 1.78
: 1 + 5.89
Interval of Temporary (I) : 𝑅
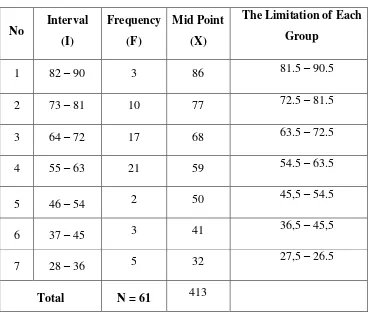
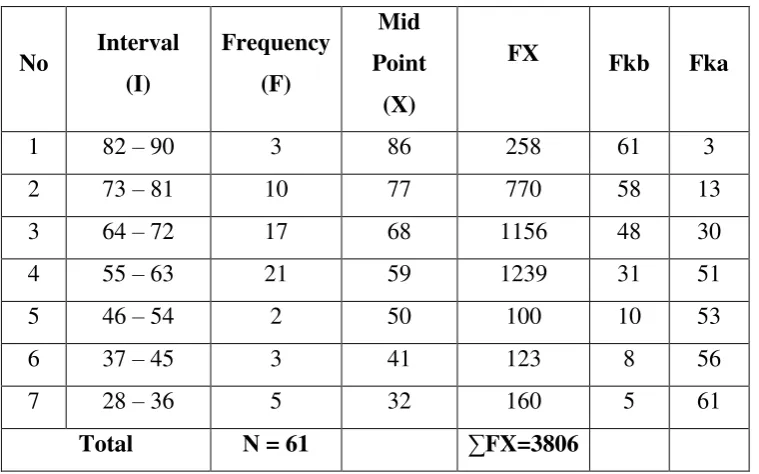
Frequency Distribution of Students
No Interval
0
Frequency Mid point Limitation of each Group
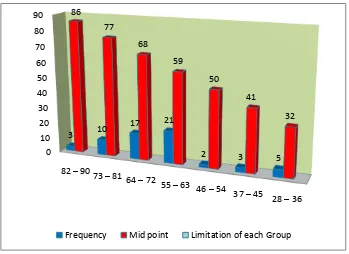
The distribution of the score students can also be seen in the following chart:
Table 4.9
Figure of Interval, Frequency, and Mid Point
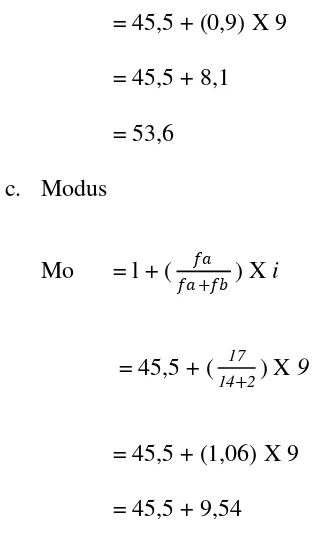
is, the writer tabulated the scores into table for the calculating of mean, median and modus as follows:
Table 4.10
The Calculation Mean, Median, Modus
= 45,5 + (0,9) X 9 score into table of standard deviation as follows:
Table. 4.11
The Calculation of Standard Deviation
SD = Σ𝑓𝑥
2
𝑁
= 246211 61
= 63.53
From the calculation above, the result of standard deviation of the students was 63.53.
C. Testing Validity and Reliability
The writer tabulated the score into table of the Coefision correlation Pearson product. Totally responden of students were 61. The total score of third semester students in A class was 1232, B class was 3123 and C class was 1103 (see in appendix 15) the writer used SPSS 16 to prove the calculation, as following table.
Table 4.12
Level of Significance of Reliability Test Correlations
A B C
A Pearson Correlation 1 .198 .339
Sig. (2-tailed) .402 .168
N 23 20 18
B Pearson Correlation .198 1 -.255
Sig. (2-tailed) .402 .308
C Pearson Correlation .339 -.255 1 Sig. (2-tailed) .168 .308
N 18 18 18
From the table above it can be seen the level of significance was 0.402. the test can be said reliable, if the probability was higher than 0.05. So, it can be conclude that the level of significance 0.402 was higher than 0.05 and it can be stated that the test was reliable.
D. Testing Normalitas
Normality test is used to know the normality of the data, whether both groups have normal distribution or not. In this case, the SPSS program 16 was applied. It can be seen in the following table.
Table 4.13
The Level Significance of the Normality Test One-Sample Kolmogorov-Smirnov Test
A B C
N 23 20 18
Normal Parametersa Mean 58.09 66.30 61.28
Std. Deviation 10.436 15.818 13.999 Most Extreme
Differences
Absolute .210 .218 .160
Negative -.210 -.218 -.160
Kolmogorov-Smirnov Z 1.006 .974 .680
Asymp. Sig. (2-tailed) .264 .299 .744
a. Test distribution is Normal.
From the table above, level of significance class A was 0.264, class B was 0.299 and class C was 0.744. The data were normal if the value of the probability was higher than 0.05. It can be said that the data were normal, because the significance of class A was 0.264, class B was 0.299 and class C was 0.744 was higher than 0.05. Then it can be concluded test distribution is normal.
E. Index of Difficulties
F. Data Interpretation
Finding the average score of the students’ vocabulary mastery, the formula is:
Table 4.14
Distribution Frequency and Presentation Score of the Students’ Mastery Level in Vocabulary Size of IAIN Palangka Raya
No Level Interpretation Letter Value
1 80 – 100 Very good A
2 70 - < 80 Good B
3 60 - < 70 Fair C
4 50 - < 60 Poor D
5 0 - < 50 Very poor E
S
=
RN
=
376561
=
61.72
Notes:
It can be seen from the table above, the interpretation of students vocabulary mastery was fair, based on the result above, the average score of
students’ mastery was 61.72 G. The Result of Data Analyze
The result of data analysis showed that the interpretation of students’ vocabulary mastery was fair. It based on the result of the average score (61.72). It could be proved from the result of the scores. Then it was found
the mean of the students’ vocabulary mastery 62.39 and the deviation
standard was 63.53. Futhermore, to prove the test was reliable or unreliable, the writer used spss 16 to prove it, and the result stated that the test was reliable based on the level of significance (0.402). It stated that the level significance was higher than 0.05.