How to cite:
Utami S, Widyastuti U, Utami DW et al. (2017) Molecular Marker-Assisted Selection of Rice Grain Quality on Rice (Oryza sativa L.) Lines Tolerant to Fe Toxicity Stress. J. Trop. Life.
– *Corresponding author:
Dwinita Wikan Utami ICABIOGRD
Jalan Tentara Pelajar No. 3A, Bogor, Indonesia 16114
Molecular Marker-Assisted Selection of Rice Grain Quality on Rice (
Oryza sativa
L.) Lines
Tolerant to Fe Toxicity Stress
Silvia Utami 1, Utut Widyastuti 1, Dwinita Wikan Utami 2*, Ida Rosdianti 3, Puji Lestari 2
1 Department of Biology, Faculty of Mathematics and Natural Sciences, Bogor Agricultural University, Bogor, Indonesia 2 Indonesian Center for Agricultural Biotechnology and Genetic Resources Research and Development (ICABIOGRD),
Bogor, Indonesia
3 Agricultural Development Studies. Graduate School for Agriculture and Life Sciences, University of Tokyo, Tokyo, Japan
ABSTRACT
The elite rice has been produced, including iron (Fe) tolerant varieties. To get the appropriate rice lines which superior not only Fe tolerant but also have good grain quality needs to be developed selection system, especially in the use of molecular markers. This study was aimed to develop molecular markers for selection the rice grain quality characters of selected rice lines Fe tolerant. A total of 30 selected Fe tolerant rice lines and 5 parents as control lines were used in this research. Characterization of grain quality were quantitatively using the standard. While for gen-otyping analysis used 19 molecular markers of STS, SSR, Indel and SNP. This study showed that 14 of 19 markers result polymorphic DNA band (DNA markers). Association analysis of genotype and phenotype showed that 10 of 14 markers were significantly (p < 0.05) related to high quality of rice grain. Among four types of markers used in this study, STS was the most widely associated significantly with four characters of rice quality. The phenotyping analysis showed that the physical grain and palatability quality which obtained from the total mean of 30 rice lines
tested tend to nearly with the parent’s value as controls lines. The most of these lines were included in the group
IV of National Rice Grain Quality Standard (SNI). The amylose content (AC) showed that the texture was varied from firm and dry (high AC) to soft and sticky (low AC). The association results showed that there were significant
(p ≤0.05) markers related with the biosynthesis starch genes, i.e: sbe1, ss1, ssiia, gpa, pul and s3cl which contributed
on the character of rice palatability. These selected significant markers could be useful for screening of other popu-lation with Fe tolerant and/ or other desired morpho-agronomical traits in support of rice breeding program in Indonesia.
Keywords: Fe-tolerant rice lines, molecular marker, rice grain quality INTRODUCTION
Rice (Oryza sativa L.) as a staple food is consumed
by more than half the world's population and is the most dominant crop in Indonesia. Rice consumption accounts for 60% of carbohydrates intake [1]. Paddy requires es-sential micro-nutrients to support electron transport for photosynthesis, such as ferrum or iron (Fe). The nutri-ent serves as an electron acceptor which is important in the reaction of reduction-oxidation and as an activator of several important enzymes in the metabolic processes of plants [2]. Plants need Fe in small amounts, and in
excessive amount it potentially causes plant toxicity, leading to nutrient deficiency, cell damage and water de-ficiency, thus inhibiting the growth of plants [3].
Various rice lines that are tolerant to environmental stress in both biotic and abiotic have been scrutinized, including Fe-tolerant rice [3]. These rice lines are from multi-crossing population. However, the rice grain qual-ity still needs to be improved, thus it can be an im-portant consideration for consumers as well as for breed-ers [4]. Breeding is generally intended to improve yield, but on the other hand the obtained varieties are often less acceptable to both farmers and consumers because of undesirable seed quality [5].
High seed quality can be characterized from its physicochemical aspects that include size, shape, texture, color, aroma and taste [6]. The physicochemical is influ-enced by starch content in the endosperm which is de-termined by amylose content (AC) and gel consistency (GC) [7]. Molecular markers for selection of high qual-ity seed have been developed by many researchers. Sim-ple sequence repeat markers (SSR), sequence tagged site (STS), and single nucleotide polymorphism (SNP) are common DNA markers for analysis of rice taste and physicochemical properties [6].
Functional markers such as SSR, STS or SNP asso-ciated with genes related to the physicochemical proper-ties of rice have been established [6, 7, 8]. Markers used
previous studies are s3cl, sbe1, ss1, ssiia, gpa, gbss1, pul
and ams [7]. The markers can be used to assist in
select-ing rice seed under Fe toxicity. This research was aimed to develop molecular markers for selection the rice grain quality characters of selected rice lines Fe tolerant.
MATERIALS AND METHODS Plant materials
Paddy from multi crossing population(30 rice lines)
was selected for its tolerant to Fe toxicity and 5 parents as control lines. Thirty rice lines tolerant to Fe (bronzing
score ≤5) [6] and 5 parents as control i.e. IR64 (sticky
rice), Inpara 3 (firm rice), Inpara 2 (sticky rice), IR42 (firm rice), and Mashuri (sticky rice) are used for phe-notyping analysis of rice physical quality,
physicochem-ical and organoleptic. The sameplant materials were
an-alyzed using 19 markers of SSR, STS, SNP, and Indel.
Molecular Marker
Theplant material was analyzed by using 19
mark-ers of rice grain qualityfrom 4 markers type including
SSR, STS, Indel and SNP (Table 1).
DNA isolation
The DNA isolation was performed using the CTAB method according to Doyle [8]. Plant leaves were grou-
nd in liquid nitrogen by tissue lyser. A sample was added
with 750 μL Cetyltrimethyl Ammonium Bromide
(CTAB) buffer and incubated in 65oC for 30 min. This
suspension was then added with 750 μL CI (chloroform
: isoamil alcohol = 24 : 1) and centrifuged at 10,000 rpm for 15 minutes. The Supernatant was moved to a new
tube and then was added with 50 μL Na acetate 2M pH
5.2 and 1 mL absolute ethanol and incubate overnight
at -20oC. After freezing overnight, it was centrifuged at
10,000 rpm for 15 minutes. A pellet was washed with
500 μL 70% alcohol and centrifuged at 10,000 rpm for
5 minutes. A dried pellet was added with 50 μL 1× TE
and 10 μL 10 ng/μL RNase and incubated at 37oC for
one hour. Inactivation of RNase was performed by
in-cubation in 65oC for 15 minutes. DNA quality was
tested by electrophoresis on 0.8% agarose gel in 1× TAE buffer at 100 volts for 60 minutes, then visualized using UV light (BioRad, USA). DNA quantity is determined using the Nano Drop 2000c Spectrophotometer (Thermo Scientific, USA).
PCR analysis
PCR analysis included markers selection and ampli-fication of DNA fragment. In markers selection, PCR
analysis was performed in a total volume of 10 μL
con-taining 4 μL DNA (10 ng), 0.5 μL primers-F 2.5 pmol,
0.5 μL primers-R 2.5 pmol, 5 μL of KAPA. PCR
condi-tions were pre-PCR 94°C for 5 minutes, denaturation 94°C for 45 seconds, annealing 55°C for 1 minute, elon-gation 72°C for a minute, post-PCR 72°C for 7 minutes. PCR was performed for 35 cycles. PCR products were analyzed using electrophoresis on agarose gel 2% in a buffer solution 1× TAE buffer (40 mM Tris-acetate, 1 mM EDTA) at 50 volts for 60 minutes. DNA bands in agarose were visualized with UV light. DNA fragments of selected Fe-tolerant rice (41 populations) were ampli-fied using 14 selected primers related to rice grain qual-ity. PCR reactions were conducted in same procedure as in markers selection, but annealing temperature was ad-justed to optimization temperature of each primer for 1 minute. DNA visualization was subsequently measured by GelQuant.NET 3.5 to determine the size of the base of each DNA band
Seed quality
Physical quality of grain and rice was analyzed
based on Wibowo et al. 2006 [10], modified with SNI
lists and assessed according to glossiness, color, aroma, stickiness (level of waxy), and taste. Organoleptic score was presented using ranking (order) to determine the differences and changes in taste or quality of the rice palatability. The ranked average was the average value scored by 30 panelists.
Data analysis
The genotype and phenotype data obtained were used in association analysis using software of Tassel 2.0. Molecular markers (genotype) associated significantly with p < 0.05 indicated that the markers were associated with the phenotype.
Markers associated with phenotype response (p < 0.05) showed that the markers were associated with genes in the rice grain quality on selected Fe tolerant rice lines. Physical quality of grain and rice was analyzed
based on Wibowo et al. 2006 [10] but it modified with
SNI 01-6128-1999 [11] and IRRI in 1996 [12]. Cooked
rice quality was analyzed using AOAC 1984 [13] and
Juliano 1985 et al. [14].
RESULTS AND DISCUSSION Character of rice grain quality
Rice grain quality was determined by (1) physical and milling properties, (2) eating and cooking quality and, (3) nutritional quality [17].
Physical and milling rice
According to SNI, maximum moisture content of rice grain is 14%. The moisture content is the ratio of water in the sample to initial sample weight [16]. It is significantly associated with a shelf life of grain which in turn affects the growing of grain. A high 1,000 grains weight is associated with 30 g, while low weight is asso-ciated with below 30 g. A 1,000 grains weight is the ratio of the 1000 grain produced by a strain or variety, which is applicable for determination of seed required in
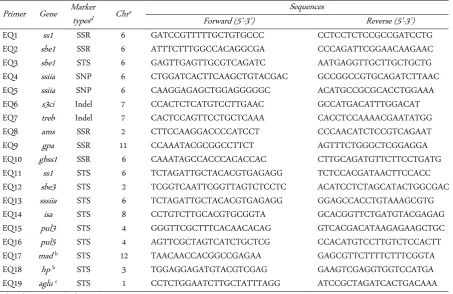
Table 1. A list of previously reported markers and their chromosomal location developed in this study for the evaluation of eating quality on rice indica
Primer Gene Marker typesd Chr
a Sequences
Forward (5’-3’) Reverse (5’-3’)
EQ1 ss1 SSR 6 GATCCGTTTTTGCTGTGCCC CCTCCTCTCCGCCGATCCTG
EQ2 sbe1 SSR 6 ATTTCTTTGGCCACAGGCGA CCCAGATTCGGAACAAGAAC
EQ3 sbe1 STS 6 GAGTTGAGTTGCGTCAGATC AATGAGGTTGCTTGCTGCTG
EQ4 ssiia SNP 6 CTGGATCACTTCAAGCTGTACGAC GCCGGCCGTGCAGATCTTAAC
EQ5 ssiia SNP 6 CAAGGAGAGCTGGAGGGGGC ACATGCCGCGCACCTGGAAA
EQ6 s3ci Indel 7 CCACTCTCATGTCCTTGAAC GCCATGACATTTGGACAT
EQ7 treb Indel 7 CACTCCAGTTCCTGCTCAAA CACCTCCAAAACGAATATGG
EQ8 ams SSR 2 CTTCCAAGGACCCCATCCT CCCAACATCTCCGTCAGAAT
EQ9 gpa SSR 11 CCAAATACGCGGCCTTCT AGTTTCTGGGCTCGGAGGA
EQ10 gbss1 SSR 6 CAAATAGCCACCCACACCAC CTTGCAGATGTTCTTCCTGATG
EQ11 ss1 STS 6 TCTAGATTGCTACACGTGAGAGG TCTCCACGATAACTTCCACC
EQ12 sbe3 STS 2 TCGGTCAATTCGGTTAGTCTCCTC ACATCCTCTAGCATACTGGCGACTC
EQ13 sssiia STS 6 TCTAGATTGCTACACGTGAGAGG GGAGCCACCTGTAAAGCGTG
EQ14 isa STS 8 CCTGTCTTGCACGTGCGGTA GCACGGTTCTGATGTACGAGAG
EQ15 pul3 STS 4 GGGTTCGCTTTCACAACACAG GTCACGACATAAGAGAAGCTGC
EQ16 pul5 STS 4 AGTTCGCTAGTCATCTGCTCG CCACATGTCCTTGTCTCCACTT
EQ17 mad b STS 12 TAACAACCACGGCCGAGAA GAGCGTTCTTTTCTTTCGGTA
EQ18 hp b STS 3 TGGAGGAGATGTACGTCGAG GAAGTCGAGGTGGTCCATGA
EQ19 aglu c STS 1 CCTCTGGAATCTTGCTATTTAGG ATCCGCTAGATCACTGACAAA
a Chr: Chromosome number
b Markers developed from the candidate genes residing QTL regions identified by Wada et al. (2008) [15]: MAD: OsMAD20 MADS box family; HP: Homeobox domain containing protein; PP2 (Phosphoserine phosphatase).
c Markers developed from randomly chosen candidate genes based on their potential association with palatability by their functions: Aglu (Acyl
UDP N acetylglucosamine O acyltransferase).
1 ha [16].
Based on the percentage of chalky green grains, a total of 28 rice lines was suitable for SNI requirements
(grade 1) with 1% of chalky green grain, while the re-maining 2 rice lines were in the grade IV. Chalky green grains are preferred by consumers, because it produces
Table 2. Quality of physical and milling on 30 selected Fe tolerant rice lines
Character Crossing population
In3 (n=14) In2 (n=4) IR42 (n=3) IR64 (n=2) Mhs (n=7) Level of milling grain (%) 131.57 ± 15.30 141.25 ± 20.55 136.7 ± 9.29 137 ± 25.46 131.6 ± 9.85 Moisture content (%) 11.28 ± 0.20 11.48 ± 0.57 11.70 ± 0.61 11.05 ± 0.67 11.21 ± 0.57 Empty grain+material dirt (%) 3.42 ± 4.07 3.00 ± 2.36 0.47 ± 0.77 1.82 ± 1.08 2.29 ± 2.91 Brown grain (%) 3.81 ± 1.52 3.42 ± 1.86 2.46 ± 0.44 3.59 ± 1.72 3.38 ± 2.06 Red grain (%) 0.09 ± 0.34 0.05 ± 0.08 0.00 ± 0.00 0.00 ± 0.00 0.02 ± 0.03 Head grain (%) 75.12 ± 10.73 70.43 ± 5.19 67.59 ± 14.5 71.95 ± 16.7 72.63 ± 17.50 Broken grain (%) 23.52 ± 10.42 27.75 ± 4.95 30.22 ± 14.8 26.40 ± 16.9 25.44 ± 16.65 Groats grain (%) 1.36 ± 0.56 1.83 ± 0.28 2.19 ± 0.38 1.65 ± 0.18 1.93 ± 1.13 Chalky green grain (%) 0.34 ± 0.32 0.92 ± 0.41 3.61 ± 5.64 0.45 ± 0.33 0.32 ± 0.20
*n is the number of derived lines on each parent control *In3= Inpara 3, In2= Inpara 2, Mhs= Mashuri
Table 3. Quality of physical and milling on 5 parents as control
Character Inpara 3 Inpara 2 IR42 IR64 Mashuri
Level of milling grain (%) 126 137 133 155 130
moisture content (%) 11.35 11.30 11.40 11.30 11.20
Empty grain + material dirt (%) 16.47 2.30 3.79 0.31 8.42
Brown grain (%) 4.19 2.14 5.10 1.08 0.34
Red grain (%) 0.54 6.92 0.00 0.00 0.00
Head grain (%) 73.83 85.84 52.67 92.94 91.52
Broken grain (%) 22.83 13.16 44.64 4.82 7.75
Groats grain (%) 3.35 1.00 2.69 0.26 0.73
Chalky green grain (%) 0.12 0.32 0.16 0.21 0.29
Table 4. Cooking quality of 5 parent as control
Character Inpara 3 Inpara 2 IR42 IR64 Mashuri
Amylose content (%) 23.32 15.76 22.44 15.89 18.80
Gel melting (mm) 41.00 67.00 41.00 61.50 61.00
Rice texture Pera Pulen Pera Pulen Pulen
Protein content (%) 8.61 7.58 7.54 8.79 9.61
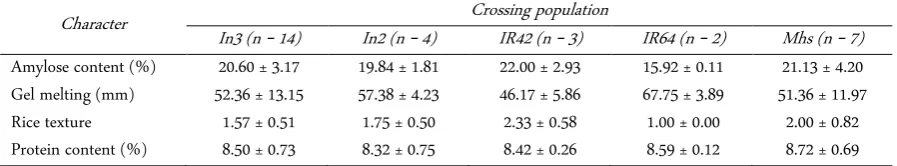
Table 5. Cooking quality of 30 selected Fe tolerant rice lines
Character Crossing population
In3 (n = 14) In2 (n = 4) IR42 (n = 3) IR64 (n = 2) Mhs (n = 7) Amylose content (%) 20.60 ± 3.17 19.84 ± 1.81 22.00 ± 2.93 15.92 ± 0.11 21.13 ± 4.20 Gel melting (mm) 52.36 ± 13.15 57.38 ± 4.23 46.17 ± 5.86 67.75 ± 3.89 51.36 ± 11.97 Rice texture 1.57 ± 0.51 1.75 ± 0.50 2.33 ± 0.58 1.00 ± 0.00 2.00 ± 0.82 Protein content (%) 8.50 ± 0.73 8.32 ± 0.75 8.42 ± 0.26 8.59 ± 0.12 8.72 ± 0.69
a chalky rice and is susceptible to damage by pests which lead to short shelf life [19]. The percentage of brown grains on 30 rice lines was in grade V (maximum 5%). In percentage of red grains, all lines derived from IR42 and IR64 met grade I (maximum 0%) (Table 2). Fur-thermore, physical and milling properties of 30 rice lines (Table 2) were almost same as parent control (Table 3), and some characters tend to have a small standard devi-ation.
Eating and cooking quality
Rice can be grouped by amylose content as waxy (0
–2%), very low (3 – 12%), low (13 – 20%), moderate
(21 – 25%), and high (≥ 26%). Cooking quality of 30
rice lines and 5 parents as control was generally low to high level of amylose, which is classified in sticky (waxy) and firm (non-waxy) with an average of soft to medium gel consistency. Gel consistency (GC) enables to indi-cate the rice texture after cooled. This was consistent
with the statement of Juliano et al. (1981) [14] that
am-ylose content (AC) is one of the important criteria in rice classification. Medium amylose content is attributed to sticky rice (not too wet or dry), while high amylose is correlated to hard, dry, and firm rice. Low amylose rice has lower water absorption ratio due to differences in the active groups.
Amylose have hydroxyl group which is polar (hy-drophilic) and high affinity to water, leading to high wa-
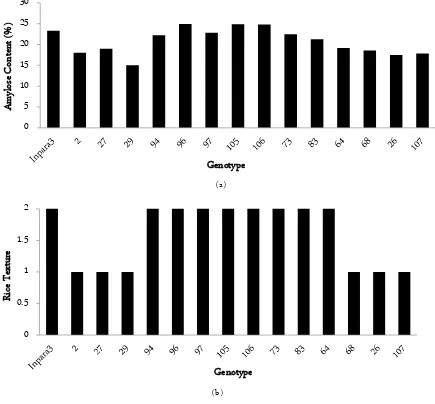
(a)
(b)
Figure 1. Diagram (a) Percentage of Amylose content dan (b) Rice texure (1.00 = sticky (waxy), 2.00 = firm (non-waxy) to the character of cooking quality of several selected Fe tolerant rice lines with Inpara 3 parent as control
0 5 10 15 20 25 30
A
m
ylo
se
C
on
ten
t
(%
)
Genotype
0 0.5 1 1.5 2
R
ic
e
T
ex
tur
e
ter absorption capability. Therefore, firm rice requires more water for starch granule swelling. Cooking quality values of 30 rice lines (Table 4) were close to parent con-trol (Table 5) and had small standard deviation in sev-eral characters. Based on amylose content and rice tex-ture, Fe toxicity-tolerant lines from Inpara 3 were grouped as sticky and firm. Based on Figure 1, 8 of 14 lines showed same firm rice texture as Inpara 3, namely G-94, G-96, G-97, G-105, G-106, G-73, G-73, G-64, and 6 lines were sticky rice texture. Rice lines that were sim-ilar to parent had medium amylose content, while 6 rice lines which were different from parent had low amylose content.
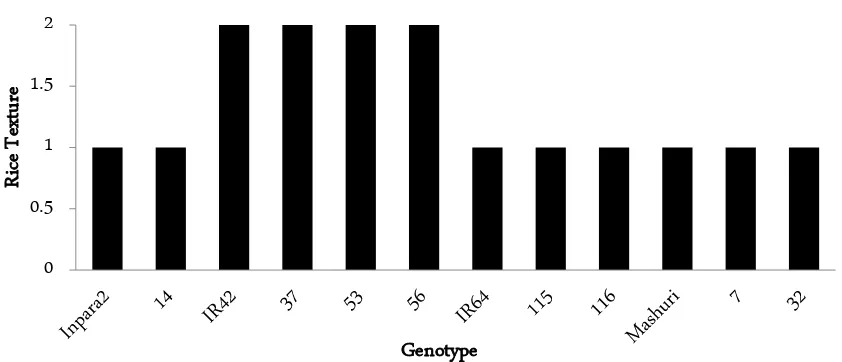
In Figure 2, 1 rice line (G-14) of 4 lines derived from Inpara 2 had sticky texture. All rice lines derived from IR42 (G-37, G-53, G-56) was firm texture which is sim-ilar to parent and had high amylose. Furthermore, all rice lines derived from IR64 (G-115, G-116) had sticky texture as parent. Only 2 (lines G-7 and G-32) derived from Mashuri was same as parent (Figure 2) with low amylose and sticky texture, while 5 remains had high amylose content and firm texture. Therefore, a total of 16 rice lines tolerant to Fe stress were same as 5 parent controls, while 14 remaining rice lines were not.
Genotypes characteristics using seed quality-related markers
Molecular analysis involved 19 molecular markers that are SSR, STS, Indel and SNP, showed that 14 se-lected markers (P-EQ1, P-EQ2, P-EQ3, P-EQ 6, P-EQ7, EQ8, EQ9, EQ13, EQ14, EQ15, EQ16, P-EQ17, P-EQ18 and P-EQ19) were polymorphic, while 5 remaining markers were not polymorphic. PCR analysis
using P-EQ2 as primer showed that allelic variation ranged from 175 bp to 232 bp (Figure 3). The highest frequency of allele size was at 201 bp (Table 7), indicat-ing that it was conserved in both crossindicat-ing variety and derived lines. However, minor allele frequency (< 5%) was detected in 175 bp, and 183 bp. The minor allele frequency was specific allele for particular lines. For ex-ample, alleles with the size of 175 bp, and 183 bp were only detected in the G-20, G-83, G-97.
Association analysis of phenotype and genotype
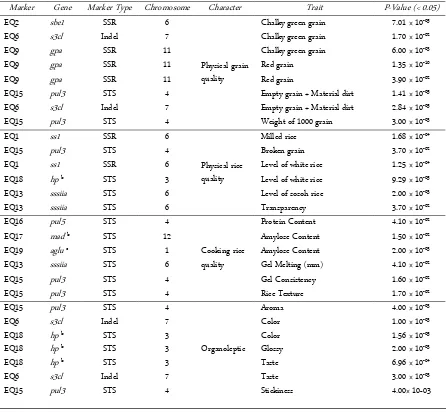
To determine significant markers (p < 0.05), associ-ation analysis was conducted using Tassel 2.0. Some sig-nificant markers (Table 6) associated with physical qual-ity of rice grain, physical qualqual-ity of rice, and organolep-tic and cooking quality were detected, which was found in chromosomes 1, 3, 4, 6, 7 and 11. Several significant markers have been acknowledged to mark starch
biosyn-thesis-related genes. The genes are sbe1, gpa, pul, ss1,
sssiia while s3cl is involved in sucrose biosynthesis.
P-EQ2 which marks sbe1 gene was significantly associated
with physical quality of the rice grain, namely chalky
green grain. sbe1 (Starch branching enzyme 1 or
1.4-alpha-glucan-branching enzyme) was in chromosomes 6. Some SBE1 characteristics in the rice endosperm are responsible for starch structure [19].
P-EQ9 which marks GPA (glucosamine-fructose-6-phosphate aminotransferase) gene was significantly as-sociated with physical quality of the grain, namely red grains. GPA catalyzes the formation of macromolecular precursors containing lots of active sugar, thus the gene is involved in the synthesis of starch, mapped on chro-mosome 11 [20]. P-EQ15 and P-EQ16 that mark PUL
Figure 2. Diagram of Rice texture (1.00 = sticky (waxy), 2.00 = firm (non-waxy)) in derivative lines of parent control (Inpara 2, IR42, IR64, Mashuri) with the texture of the rice same with each parent
0 0.5 1 1.5 2
R
ic
e
T
ex
ture
Figure 3. The result of genotyping PCR analysis on 30 selected Fe tolerant rice lines and 5 parents as control using P-EQ2 marker Table 6. Some markers with significance highest the results of association (p < 0.05)
Marker Gene Marker Type Chromosome Character Trait P-Value (< 0.05)
EQ2 sbe1 SSR 6
Physical grain quality
Chalky green grain 7.01 × 10-05
EQ6 s3cl Indel 7 Chalky green grain 1.70 × 10-02
EQ9 gpa SSR 11 Chalky green grain 6.00 × 10-03
EQ9 gpa SSR 11 Red grain 1.35 × 10⁻¹⁰
EQ9 gpa SSR 11 Red grain 3.90 × 10-02
EQ15 pul3 STS 4 Empty grain + Material dirt 1.41 × 10-05
EQ6 s3cl Indel 7 Empty grain + Material dirt 2.84 × 10-05
EQ15 pul3 STS 4 Weight of 1000 grain 3.00 × 10-03
EQ1 ss1 SSR 6
Physical rice quality
Milled rice 1.68 × 10-04
EQ15 pul3 STS 4 Broken grain 3.70 × 10-02
EQ1 ss1 SSR 6 Level of white rice 1.25 × 10-04
EQ18 hp b STS 3 Level of white rice 9.29 × 10-05
EQ13 sssiia STS 6 Level of sosoh rice 2.00 × 10-03
EQ13 sssiia STS 6 Transparency 3.70 × 10-02
EQ16 pul5 STS 4
Cooking rice quality
Protein Content 4.10 × 10-02
EQ17 mad b STS 12 Amylose Content 1.50 × 10-02
EQ19 aglu c STS 1 Amylose Content 2.00 × 10-03
EQ13 sssiia STS 6 Gel Melting (mm) 4.10 × 10-02
EQ15 pul3 STS 4 Gel Consistency 1.60 × 10-02
EQ15 pul3 STS 4 Rice Texture 1.70 × 10-02
EQ15 pul3 STS 4
Organoleptic
Aroma 4.00 × 10-03
EQ6 s3cl Indel 7 Color 1.00 × 10-03
EQ18 hp b STS 3 Color 1.56 × 10-05
EQ18 hp b STS 3 Glossy 2.00 × 10-03
EQ18 hp b STS 3 Taste 6.96 × 10-04
EQ6 s3cl Indel 7 Taste 3.00 × 10-03
(pullulanase) gene were significantly associated with the character of the physical quality of rice grain, physical quality of rice, and organoleptic and cooking quality. PUL is a major gene for controlling AC. PUL is mapped on chromosome 4 and has a physiological function to degrade starch in the endosperm and leaf, in grains such as corn and rice. Besides it also degrades starch during
seed germination [21]. Furthermore, P-EQ1 marks ss1
(starch synthase I) gene was significantly related to the
character of the physical quality of grain and rice. ss1 is
mapped on chromosome 6. It controls AC adjusted to QTL analysis on rice by physicochemical
P-EQ13 which marks sssiia gene (soluble starch
synthase IIa) was significantly related to physical and cooking quality of rice, namely milling degree,
transpar-ency, and long-melt gel. sssiia was mapped on
chromo-some 6 and plays role in controlling the disintegration of alkali rice grain and in synthesizing starch in the rice
endosperm. Besides, sssiia also determines eating and
cooking quality of rice by affecting amylose content AC
and GC. alk gene is the major gene that controls GT,
but as a minor gene, it affects AC and GC [4]. P-EQ6 that marks S3cl gene (mapped on chromo-some 7) was significantly associated with organoleptic character that determines the taste and aroma of the rice. These genes play role in synthesizing sucrose and con-trolling development and growth of rice plants, in addi-tion to seed filling [22]. Based on associaaddi-tion analysis, the genes that often and significantly correlate with seed
quality and physicochemical properties of rice were pul
and s3cl, respectively. pul and s3cl respectively
contrib-ute to starch and sucrose synthesis. Both genes are re-sponsible for eating and cooking quality in rice by af-fecting AC and GC [4].
CONCLUSION
Phenotypic analysis of the physical and cooking quality of rice showed that the 30 rice lines had an aver-age quality score that tend to be close to the value of its parent, which was mostly in grade IV for physical qual-ity. The amylose content was in the range of low to high, whereas cooking quality (rice texture) classified as sticky until firm. Among 30 Fe-tolerant rice lines, 16 rice lines had similar characteristics to parent control based on amylose and rice texture. This study showed that 14 of 19 primers result polymorphic DNA band (DNA mark-ers). Association analysis of genotype and phenotype showed that 12 of 14 markers were significantly (p -Value < 0.05) related to high quality of rice grain.
Sig-nificant markers related to genes sbe1, ss1, sssiia, gpa,
pul, s3cl showed contribution in starch biosynthesis that
was critical factor for eating and cooking quality of rice lines or variety. The significant molecular markers are potential to be use as markers of selection for rice grain quality of Fe-tolerant rice line that produced through breeding program.
ACKNOWLEDGMENT
This research was funded by the Indonesian Center for Agricultural Biotechnology and Genetic Resource Research and Development (ICABIOGRD), Bogor, DIPA code: 1798101003054. The author also thanks to Siti Nurani (laboratory assistance) from molecular biol-ogy laboratory, ICABIOGRD.
REFERENCES
1. Jin L, Lu Y, Shao Y et al. (2010) Molecular marker assisted selection for improvement of the eating, cooking and sensory quality of rice (Oryza sativa L.). Cereal Science 51 (1): 159 – 164. doi: 10.1016/j.jcs.2009.11.007.
2. Utami DW, Hanarida I (2014) Evaluasi lapang dan identifi-kasi molekuler plasma nutfah padi terhadap keracunan Fe. AgroBiogen 10 (1): 9 – 17.
3. Sunadi, Wahidi I, Utama MZH (2010) Penapisan varietas padi toleran cekaman Fe2+ pada sawah bukaan baru dari
aspek agronomi dan fisiologi. Akta Agrosia 13 (1): 16 – 23. 4. Sun MM, Abdulah SE, Lee HJ et al. (2011) Molecular aspect of good rice grain quality formation in Japonica rice. PLoS ONE 6 (4): 83 – 85. doi: 10.1371/journal.pone.0018385. 5. Tan YF, Xing YZ, Yu SB et al. (2000) Genetic bases of
ap-pearance quality of rice grains quality in Shanyou 63, an Elite Rice Hybrid. Theoretical and Applied Genetics 101 (5 – 6): 823 – 829. doi: 10.1007/s001220051549.
6. Lestari P, Jiang W, Chu SH et al. (2015) DNA marker for eating quality of indica rice in Indonesia. Plant Breeding 134 (1): 40 – 48. doi: 101111/pbr.12234.
7. Lestari P, Ham TH, Lee HH et al. (2009) PCR Marker based evaluation of the rice grain quality of Japonica rice (Oryza sativa L.). Agricultural and Food Chemistry 57 (7): 7254 – 2762. doi: 10.1021/jf803804k.
8. Bao JS, Corke H, Sun M (2006) Microsatellites, single nu-cleotide polymorphisms and a sequence tagged site in starch-synthesizing genes in relation to starch physicochemical properties in nonwaxy rice (Oryza sativa L.). Theoretical and Applied Genetics 113 (7): 1185 – 1196. doi: 10.1007/s00122- 006-0394-z.
9. Doyle JJ (1990) Isolation of plant DNA from fresh tissue. Focus 12: 13 – 15.
Padi.
11. Standar Nasional Indonesia (SNI) (1999) Standar mutu be-ras giling SNI 01-6128-1999. Jakarta, Badan Standarisasi Na-sional.
12. International Rice Research Institute (IRRI) (1996) Standard evaluation system of rice. Ed 14th. Manila, IRRI.
13. Association of Official Analytical Chemistry (AOAC) (1984) Official Methods of Analysis. Ed 14th. Washington DC,
AOAC.
14. Juliano BO, Bautista GM, Lugay JC, AC Reyes (1985) Stud-ies on physicochemical propertStud-ies in rice. Agricultural and Food Chemistry 12 (2): 31 – 38. doi: 10.1021/jf60132a010. 15. Wada T, Ogata T, Tsubone M et al. (2008) Mapping of QTLs for eating quality and physicochemical properties of the Japonica rice “Koshihikari”. Breeding Science 58 (4): 427 – 435. doi: 10.1270/jsbbs.58427.
16. Liu W, Xu ZH, Luo D, Xue HW (2004) Roles of OsCKI1, a rice casein kinase I, in root development and plant hormone sensitivity. Plant Breeding 36 (2): 189 – 202. doi: 10.1046/j.1365-313X.2003.01866.x.
17. Darmadjati DS (1995) Karakteristik sifat dan standarisasi mutu beras sebagai landasan pengembangan agribisnis dan agroindustri padi di Indonesia. Bogor, Balai Penelitian dan
Bioteknologi Tanaman Pangan.
18. Chen XG, Park HJ (2003) Chemical characteristic of o-car-boxymethyl chitosans related to the preparation conditions. Carbohydrate Polymers 53 (4): 355 – 359. doi: 10.1016/S0144-8617(03)00051-1.
19. Smyth DA (1988) Some properties of starch branching en-zyme from indica rice endosperm (Oryza sativa L.). Plant Science 57: 1 – 8.
20. Pandey R, Kumari A, Paul V, Ghildiyala MC (2012) An ef-ficient and thermostable soluble starch synthase in develop-ing maize (Zea mays) grains. Indian Journal of Agricultural Sciences 82 (6): 548 – 551. doi:10.1016/j.bio-techadv.2012.08.011.
21. Fujita N, Toyosawa Y, Utsumi Y et al. (2009) Characteriza-tion of pullulanase (PUL)-deficient mutants of rice (Oryza sativa L.) and the function of PUL on starch biosynthesis in the developing rice endosperm. Experimental Botany 60 (3): 1009 – 1023. doi: 10.1093/jxb/ern349.
22. Redillas MCFR, Park SH, Lee JW et al. (2012) Accumulation of trehalose increases soluble sugar contents in rice plants conferring tolerance to drought and salt stress. Plant Bio-technology Report 6 (1): 89 – 96. doi: 10.1007/s11816-011-0210-3.