www.oecd.org/publishing
ORGANISATION FOR ECONOMIC CO-OPERATION
AND DEVELOPMENT
The OECD is a unique forum where the governments of 30 democracies work together to address the economic, social and environmental challenges of globalisation. The OECD is also at the forefront of efforts to understand and to help governments respond to new developments and concerns, such as corporate governance, the information economy and the challenges of an ageing population. The Organisation provides a setting where governments can compare policy experiences, seek answers to common problems, identify good practice and work to co-ordinate domestic and international policies.
The OECD member countries are: Australia, Austria, Belgium, Canada, the Czech Republic, Denmark, Finland, France, Germany, Greece, Hungary, Iceland, Ireland, Italy, Japan, Korea, Luxembourg, Mexico, the Netherlands, New Zealand, Norway, Poland, Portugal, the Slovak Republic, Spain, Sweden, Switzerland, Turkey, the United Kingdom and the United States. The Commission of the European Communities takes part in the work of the OECD.
OECD Publishing disseminates widely the results of the Organisation’s statistics gathering and research on economic, social and environmental issues, as well as the conventions, guidelines and standards agreed by its members.
ISBN 978-92-64-07741-6 (print) ISBN 978-92-64-07742-3 (PDF)
Also available in French: Tendances et politiques du tourisme de l'OCDE 2010
Photo credits: Cover Illustration:
© Ben Blankenburg/Corbis, © Joaa Vrissimo/Dreamstime.com, © Gordon Wiltsie/National Geographic/Getty Images, © Kheng Guan Toh – Fotofolia.com.
Corrigenda to OECD publications may be found on line at: www.oecd.org/publishing/corrigenda. © OECD 2010
You can copy, download or print OECD content for your own use, and you can include excerpts from OECD publications, databases and multimedia products in your own documents, presentations, blogs, websites and teaching materials, provided that suitable acknowledgment of OECD as source and copyright owner is given. All requests for public or commercial use and translation rights should be submitted to [email protected]. Requests for permission to photocopy portions of this material for public or commercial use shall be addressed directly to the Copyright Clearance Center (CCC) at [email protected] or the Centre français d’exploitation du droit de copie (CFC) at [email protected].
FOREWORD
OECD TOURISM TRENDS AND POLICIES 2010 © OECD 2010 3
Foreword
T
his second review of tourism trends and policies, carried out by the OECD Tourism Committee, assesses the long-term evolution of tourism in the OECD area over the last two decades, the impact of the global financial and economic crisis on the tourism industry and also, for the first time, analyses data and policy trends in twelve non-OECD countries, including big emerging economies such as Brazil, China and India.The report first explores the increasing importance the tourism sector plays in national economies; it also demonstrates that, while the global financial crisis has impacted international tourism levels, particularly in the developed countries, domestic tourism has remained buoyant. Four key concepts central to national governments’ policy priorities – quality, competitiveness, sustainability and evaluation – are analysed, together with the main challenges facing tourism in the decade ahead.
Building on the findings of the High Level Meeting of the Tourism Committee, held at Riva del Garda, Italy, in October 2008, the second part of the book focuses on the benefits gained from taking a “whole of government” approach to tourism development, ranging from the implementation of public/ private partnerships to the exchange of international best practice. The recommendations stemming from that meeting are discussed in full and the Riva del Garda Action Statement for Enhancing Competitiveness and Sustainability in Tourism has been annexed to this report (Annex 2.A1).
The third part of the report documents the increasing use of Tourism Satellite Account (TSA) data for business and policy. Developed by the OECD Tourism Committee, in co-operation with the World Tourism Organization and Eurostat, TSA measures tourism economic impacts in a national economy. The report shows how TSA can monitor the contribution of tourism to Gross Domestic Product (GDP) and assess government revenues attributable to tourism and total employment generated by tourism, and examines the growing interest in the use of TSA as a platform for dynamic modelling. Data on tourism GDP in OECD countries and beyond are also analysed here.
The final part of the report examines tourism policy in 42 countries, including 30 members and 12 non-OECD countries, and presents a statistical profile for each country. The policy areas addressed include the role and importance of tourism in the countries’ economies and how their tourism sectors are organised, a comparison of tourism budgets and an analysis of tourism-related policies and programmes in each country.
I would like to congratulate the OECD Tourism Committee on an excellent and timely report, with particular thanks to Isabel Hill, Committee Chair, for her skilful and enthusiastic guidance of the Committee’s work, Alain Dupeyras, Head of the Tourism Unit, for his outstanding contribution in designing and compiling the report, together with Jeongbae Kim, Laurent Vassille and Adèle Renaud.
Sergio Arzeni
FOREWORD
OECD TOURISM TRENDS AND POLICIES 2010 © OECD 2010
4
Acknowledgments. This edition was directed and co-ordinated by Alain Dupeyras in co-operation with Adèle Renaud. Chapter 1 was drafted by Laurent Vassille. Chapter 2 is based on a study prepared for the Riva del Garda High Level Tourism Committee and builds on analytical work developed by the OECD and the Tourism Committee (e.g. on culture, trade in services, innovation, safety and security, challenges and trends); it was drafted by Graham Todd and Alain Dupeyras. Chapter 3 uses OECD Tourism Committee work on Tourism Satellite Account and was drafted by Alain Dupeyras and Laurent Vassille. The English version of the publication was edited by Graham Todd, Adèle Renaud and Alain Dupeyras. Jeongbae Kim participated in the quality review of Chapter 4. Lucy Clarke contributed to the marketing strategy for the book.
This book has...
StatLinks2
A service that delivers Excel
®files
from the printed page!
Look for the StatLinks at the bottom right-hand corner of the tables or graphs in this book. To download the matching Excel® spreadsheet, just type the link into your Internet browser,
starting with thehttp://dx.doi.org prefix.
TABLE OF CONTENTS
OECD TOURISM TRENDS AND POLICIES 2010 © OECD 2010 5
Table of Contents
Executive Summary . . . 7
Chapter 1. Tourism Trends in the OECD Area and Beyond . . . 13
Introduction . . . 14
Tourism and the global financial and economic crisis. . . 14
Tourism trends in the OECD area and beyond . . . 20
Tourism enterprises . . . 39
Notes . . . 45
Bibliography . . . 46
Annex 1.A1. Structural Business Statistics by Size Class for Hotels, Restaurants and Travel Agencies . . . 47
Chapter 2. Tourism 2020: Policies to Promote Competitive and Sustainable Tourism. . . . 51
Introduction . . . 52
Key challenges facing tourism . . . 52
Essential factors for effective tourism policy development . . . 59
Policy options in support of competitive and sustainable tourism development . . 62
Bibliography . . . 77
Annex 2.A1. Riva Del Garda Action Statement for Enhancing Competitiveness and Sustainability in Tourism . . . 78
Chapter 3. Tourism Satellite Accounts: Data for Business and Policy Development. . . 83
Introduction . . . 84
TSA policy and business users . . . 84
Potential benefits for producers and users . . . 86
Limitations on TSA use . . . 94
Communicating the TSA results . . . 97
Policy conclusions . . . 100
Bibliography . . . 102
Annex 3.A1. Tourism Satellite Accounts (TSA) by Country . . . 104
Chapter 4. Country Profiles: Tourism Policies and Trends. . . 107
Introduction . . . 108
OECD Member Countries . . . 111
Australia . . . . 112
Austria . . . 119
Belgium . . . . 125
Canada . . . . 132
OECD TOURISM TRENDS AND POLICIES 2010 © OECD 2010
6
Denmark . . . 144
Finland . . . 151
France. . . 157
Germany . . . 163
Greece. . . 167
Hungary . . . 171
Iceland . . . 178
Ireland . . . 182
Italy. . . 188
Japan. . . 194
Korea . . . 199
Luxembourg . . . 207
Mexico . . . 210
Netherlands. . . 217
New Zealand . . . 221
Norway. . . . 227
Poland . . . 231
Portugal . . . 236
Slovak Republic. . . 241
Spain. . . 248
Sweden. . . . 255
Switzerland . . . 258
Turkey . . . 264
United Kingdom . . . 270
United States. . . 275
OECD Non-member Economies . . . 281
Brazil . . . 282
Chile . . . 286
China . . . 291
Egypt. . . 294
Estonia . . . 299
India . . . 305
Indonesia . . . 310
Israel. . . 314
Romania. . . 320
Russian Federation. . . 326
Slovenia . . . . 329
South Africa. . . 336
OECD Tourism Trends and Policies 2010 © OECD 2010
7
Executive Summary
Tourism has been variably impacted by the global economic crisis
Over recent decades, travel and tourism have been large contributors to the world economy. International tourism has been growing at a slightly faster pace than the world economy and this seems likely to continue in the long-term despite the current recession. While its economic importance varies widely, in many of the 42 countries covered in this report, it is clear that tourism plays a crucial role in supporting economic growth and development, in sustaining employment and in generating foreign currency receipts. In the OECD area, for example, the employment growth rate in the hotel and restaurant industry exceeded 2% per year between 2000 and 2007, more than a percentage point ahead of the total employment growth rate (Chapters 1 and 4).
Tourism has been variably impacted by the financial and economic crisis that hit the world economy in 2008 and 2009. Tourism flows started to decline in the second half of 2008 (inbound OECD arrivals declined by 1.8% in the third quarter of 2008 compared to the third quarter of 2007 and by 4.3% in the fourth quarter of 2008 compared to the fourth quarter of 2007); that decline deepened at the beginning of 2009 (–12.5% and –6.5% respectively in the first and second quarters of 2009). International tourism has been affected more than domestic tourism, business tourism more than leisure tourism, hotels more than other types of accommodation and air transport more than other types of transport (Chapter 1). Paradoxically, certain forms of tourism have been impacted only slightly or have even experienced growth in this crisis period, for example, cruise tourism fared pretty well and the 2008-09 winter season in the Alps enjoyed a record year.
OECD countries play a predominant role in the world tourism market
OECD countries continue to play a predominant role in international tourism which remains the fastest-growing component of tourism. Nevertheless, for many OECD countries domestic tourism is more important than international tourism. The results from OECD countries are impressive (Chapters 1 and 4):
● During the last 20 years, the growth rate of non-resident tourism arrivals in OECD countries, while 1.6% below the worldwide rate, has averaged 2.8% per year, well ahead of the GDP growth rate of 2.4% for the zone.
● In 2008, OECD countries still accounted for 57% of international tourist arrivals and for 67% of the corresponding travel receipts.
EXECUTIVE SUMMARY
OECD TOURISM TRENDS AND POLICIES 2010 © OECD 2010
8
Non-member economies are fast-growing tourism destinations
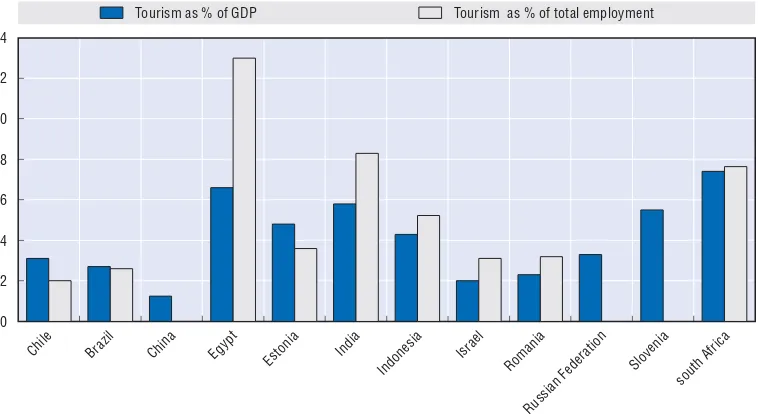
Many of the 12 non-member economies (Brazil, Chile, China, Egypt, Estonia, India, Indonesia, Israel, Romania, the Russian Federation, Slovenia and South Africa – Chapters 1 and 4) included in this report have a tourism economy representing significant shares of GDP and of total employment (Figure 0.2). They are also among the fastest growing countries as international tourism destinations.
Figure 0.1. Tourism in the OECD economies
Sources: Country data, OECD data processing.
1 2 http://dx.doi.org/10.1787/764362566620 14 12 10 8 6 4 2 0 Aus tralia Aus tria Ca nada Czec
h Rep
ublic Den mar k Finl and Fran ce GermanyGr eece Hun gary Icel and Irela nd Ital y Japan Kor ea Lu xem bour g Me xico Ne ther lands New Zeal and No rway Pol and Por tugal Slov
ak Republi
c Sp ain Sw eden Swit zerla nd Turk ey Uni ted King dom Uni ted Stat es Tourism as % of GDP Tourism as % of total employment
Figure 0.2. Tourism in selected non-member economies
Sources: Country data, OECD data processing.
1 2 http://dx.doi.org/10.1787/764351575445 14 12 10 8 6 4 2 0 Chil e Braz il Chin a Eg ypt Estoni a Indi a Indo nesi a Isr ael Roman ia Rus sian Feder ation Sloveni a sou
th Afr
ica
EXECUTIVE SUMMARY
OECD TOURISM TRENDS AND POLICIES 2010 © OECD 2010 9
An active tourism policy which stimulates innovation
No country, region or city can rest idle on its natural endowment or cultural heritage: a policy of permanent innovation is needed to stay competitive in a global tourism, travel and leisure market dominated by stiff competition.
Tourism is one of the most dynamic segments of the service sector; it is on the forefront for testing new non-technological innovations centred on best use of human capital, new forms of organisation and management, new frontiers of entrepreneurship and new developments of intangible assets based on reputation, image-building, marketing and communication.
Given the dynamics of international tourism markets, the impact of globalisation on tourism and the constant evolution of tourism demand, governments and other stakeholders should engage in partnerships that can enable destinations and the tourism industry to become more competitive and innovative in the world tourism market.
A “whole of government” approach which integrates multi-faceted policies
It is not just enough to develop and apply tourism-specific policies. Attention has to be paid both to the horizontal and vertical linkages within an economy that are occasioned by the tourism sector. This is because governments need to regard tourism as a cross-cutting sector that concerns a wide range of activities across economies. Addressing the major challenges faced by the tourism industry and maximising tourism’s full economic potential require an integrated approach to policy development across many government departments.
This requirement has led to an increased emphasis on a "whole of government" commitment and involvement in the development, implementation and evaluation of tourism strategies. It has also made clear the need for coherent and consistent policies and actions by governments across the full range of ministerial responsibilities influencing tourism and tourism destinations. The difficulties of cross government policy co-ordination, in an environment where the tourism portfolio may be relatively less influential than others, mean that this area remains a major challenge for tourism planning and policy makers.
Governments are taking action on a number of fronts, highlighted in this publication, as being central to the success of the tourism industry. While the priorities accorded to public investment in tourism-related policies and programmes naturally reflect the stage of development of each country’s tourism sector (e.g. investment in basic infrastructure is needed more in some countries than others), there are also several common themes across many countries in the attitude of governments to tourism development (Chapter 2). The most important of these may be categorised as follows:
● Investment in quality and skills: in many countries governments are increasingly aware
EXECUTIVE SUMMARY
OECD TOURISM TRENDS AND POLICIES 2010 © OECD 2010
10
awards for quality achievement; in the area of human resources, appreciation has also grown of the importance of raising skills in the tourism sector as one means of raising the attractiveness of tourism as an industry in which to work, and improving career prospects.
● Marketing and branding: most tourism strategies include a substantial focus on
destination marketing and the development of a national or regional brand. Indeed, the largest single item of public budgetary support for tourism is often the marketing budget, which helps finance the development of new and emerging market opportunities whether geographic (e.g. China) or perceived niche markets (e.g. ecotourism). Increased attention is also being paid to domestic tourism.
● Environmental sustainability for green growth: the issue of climate change, the need to
ensure the environmental sustainability of tourism and to meet the challenge of reducing tourism’s carbon emissions have led governments to introduce a wide variety of schemes and programmes aimed at raising awareness of the importance of environmentally-responsible tourism and encouraging lower carbon activities.
● Product development and innovation: programmes designed to renew and diversify the
range of tourism products, services and facilities on offer are being promoted by governments with both of the previous two priorities in mind – the need to raise quality in order to remain competitive, and the need to promote the industry’s sustainability.
● Long-term strategic industry planning: many of the countries included in this chapter
have prepared, or are in the process of preparing medium- to long-term strategic tourism plans, reflecting the appreciation on the part of governments of the tourism’s key economic importance and of the need to ensure that the sector’s potential is fully realised in the national economic interest; in short, tourism has been placed on the agenda of many governments as an economic sector demanding careful attention in the development of national economic policies.
● Reducing barriers to tourism development: many governments are taking action to
reduce the burden of red tape and, in some cases, of taxation, on the tourism sector while at the same time ensuring that national standards are enhanced; in one case, new border control procedures have been adopted to ease access to the country while at the same time addressing the need for greater border security.
● A culture of evaluation and capacity building: the steady growth in the use of Tourism
Satellite Accounts and in the improvement of intelligence and analysis covering the tourism sector has led to a much wider appreciation of the importance of the “culture of evaluation” – the process by which the effectiveness of public investment needs to be monitored and the effects of public investment programmes evaluated in order to ensure good value for money and to enable modifications to public policy to be made progressively to meet the changing needs of the global tourism marketplace.
● Co-operation and partnerships: at various levels – internationally, with neighbouring
EXECUTIVE SUMMARY
OECD TOURISM TRENDS AND POLICIES 2010 © OECD 2010 11
A long-term vision for tourism policies
The development of a tourism strategy can play a key role in engaging government, industry, destination communities and other stakeholders to identify a vision and direction for tourism development, and in setting priorities for implementing a long-term and sustainable vision for the tourism sector.
In particular, long-term tourism policies need to be developed consistently to be effective and should keep a margin of flexibility in their implementation to adapt to emerging needs, disrupting events and changing trends and fads. Partnerships with the private sector are important in this respect. Also, better information systems, adequate transport and other infrastructure, and a focus on local development issues are both important components in the development of long-term tourism strategies.
The Tourism Satellite Account provides unique economic information on tourism
The Tourism Satellite Account: Recommended Methodological Framework (TSA) is the main internationally recognised standard to measure tourism in the economy. The OECD, one of the main developers of the TSA, is co-operating closely with other international organisations to promote the TSA. An increasing number of countries is implementing the TSA; for example, around 80% of the OECD countries are presently calculating a TSA. This economic tool provides users with data on tourism production and consumption; it can be used by a wide range of public and private stakeholders to assess tourism contribution to the economy, to identify the structure of the tourism industry branches, to derive calculations of indirect impacts, of employment data, or of quarterly and regional tourism data. The challenge now for governments is to increase the usage of TSA data for business and policy action (Chapter 3).
Policy recommendations
The Riva del Garda Action Statement for Enhancing Competitiveness and Sustainability in Tourism makes important recommendations for the development of tourism policies (Chapter 2). A strong public sector management and a multi-actor system of governance should support tourism, notably by:
● establishing a comprehensive policy framework;
● promoting a coherent policy framework through a “whole of government” approach; ● encouraging a culture of co-operation among tourism actors; and
● implementing evaluation and performance assessment of government policies and programmes affecting tourism development.
Appropriate programmes may include:
● stimulating innovation mechanisms, productivity-based growth and quality; ● improving and promoting the attractiveness of employment in tourism; ● enhancing and promoting the uniqueness of the destination;
EXECUTIVE SUMMARY
OECD TOURISM TRENDS AND POLICIES 2010 © OECD 2010
12
● reducing obstacles to the development of tourism; and ● building up tourism knowledge.
Furthermore, OECD work on Tourism Satellite Accounts – building on its co-operation with other agencies, notably the World Tourism Organization and Eurostat – suggests increasing international efforts in the following areas (Chapter 3):
● promoting a modular approach for TSA development; ● implementing internationally recommended standards;
● involving more stakeholders in the production and dissemination of TSA data and extensions;
OECD Tourism Trends and Policies 2010 © OECD 2010
13
Chapter 1
Tourism Trends
in the OECD Area and Beyond
1. TOURISM TRENDS IN THE OECD AREA AND BEYOND
OECD TOURISM TRENDS AND POLICIES 2010 © OECD 2010
14
Introduction
The focus of this chapter is on short-term and long-term trends in the OECD area and beyond. It draws upon available statistics from several databases: OECD, World Tourism Organization, Eurostat and national sources.
This chapter covers, when data are available, the thirty member countries of the OECD, the five countries on the way to joining the Organisation (Chile, Estonia, Israel, the Russian Federation and Slovenia), as well as the five countries that participate in the enhanced engagement programmes with the Organisation (Brazil, China, India, Indonesia and South Africa), and Egypt and Romania (which have regular observer status in the Tourism Committee).
This chapter provides detailed information on trends in international tourism, in domestic tourism, changes in tourism demand, impacts of exogenous factors such as exchange rates and the role of tourism enterprises in terms of employment or investment.
Tourism and the global financial and economic crisis
The focus of this section is on short-term international and domestic tourism trends (2008 and 2009) in the OECD area1 and beyond. At the time of drafting, it was still too early to have all data that could give a precise picture of the crisis in tourism, especially for the 2009 summer season which is a major period for the tourism year. In particular, there are very few data available on the supply side and data on domestic tourism are generally available only at a later stage.
The financial and economic crisis that hit the world economy in 2008 had a strong impact on tourism. During 2008, the crisis manifested by quarterly decreases in the OECD area GDP volume. The pace of decrease was accentuated in the end of 2008 and at the beginning of 2009. According to the OECD Economic Outlook published in June 2009, the whole OECD economic activity could reach its minimum in the 3rd quarter of 2009 and a weak and fragile recovery could start to be seen in the 4th quarter. In the US and Japan, the recovery could take place a quarter ahead of the euro area.
In 2008, tourism jobs accompanied the general downturn, though not as abruptly as in the industrial sectors (Table 1.13). On a yearly basis, on average for the OECD area, jobs in accommodation and food services still rose by 0.6% in 2008 with regard to 2007. However, this was less than the rise of 1.3% for services as a whole. The picture appeared rather contrasted between countries. Steep declines (2% or more) took place in New Zealand, the Netherlands, Ireland, the Czech Republic, Japan and Iceland. On the other hand, sharp rises (2% or more) were registered for Portugal, Finland, Mexico, the Slovak Republic, Sweden, Switzerland, Germany and Italy.
1. TOURISM TRENDS IN THE OECD AREA AND BEYOND
OECD TOURISM TRENDS AND POLICIES 2010 © OECD 2010 15
Globally, four aspects of the crisis can be pointed out:
i) International tourism suffered a more acute downturn than domestic tourism. This is a well known pattern: international tourism is usually more volatile than domestic tourism. When the economic situation becomes difficult or uncertain, households tend to take their holidays in their countries rather than abroad. Another aspect of volatility is the tendency to reduce the reservation delays (e.g. use of last minute reservations), eventually with the advantage of heavy discounts.
The downturn appears more severe for:
ii) Business travel than for leisure travel. Facing a slump in the overall demand, businesses make efforts to limit their costs, particularly the ones that are the easiest to control. On another hand, in the crisis, the global decline in private consumption expenses has appeared moderate relative to other demand components.
iii) Hotels than for other types of accommodation. This effect can partly be considered as a consequence of the decrease in business travel since the latter entails extensive use of hotels compared with other types of accommodation. Nevertheless, leisure travellers may also have at least partly shifted to other cheaper types of accommodation.
iv) Air transport than for other types of transport. The strong limitations of international tourism particularly for business purposes with specific impacts on long distance flights can be seen as one of the main factors. Airlines were thus driven to limit their flight capacities.
International tourism largely impacted
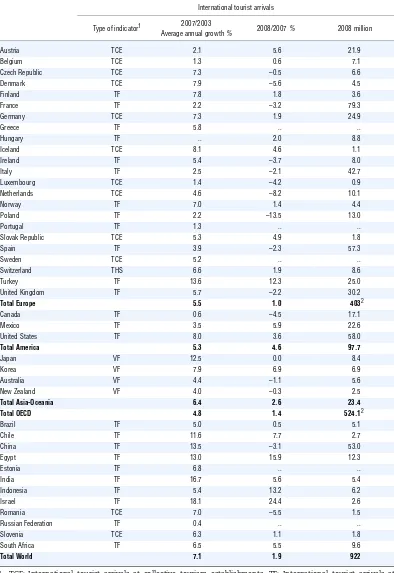
The year 2008 was a turning point after four years of steady growth from 2003 to 2007 (Table 1.1), with the negative trend starting at the beginning of the second half of 2008. On a yearly basis, the number of international arrivals at world level for 2008 was 1.9% higher than in 2007, 5.2 percentage points less than the growth rate registered during the previous 4 years. But the slowdown (–3.4 percentage points) was slightly less for the OECD countries with a growth rate of 1.4% in 2008. However, it is likely that the growth rates will become negative in 2009. In June 2009, UNWTO forecasted a global decline between –4 and –6% in 2009 compared to 2008. The detailed forecasts were still a bit lower for Europe, which represents a large share within OECD countries, and therefore, the equivalent forecast for the whole OECD area would be between –7% and –5%.
In 2008, only four OECD countries were spared by the downturn: Turkey reached a 2-digit exceptionally high growth (25.0%) of tourist arrivals while Korea (6.9%), Mexico (5.9%) and Austria (5.6%) reached slightly more than 5% growth rates. The other countries suffered either a slowdown or a decline in their corresponding growth rates. The steepest declines concerned Poland (–13.5%), the Netherlands (–8.2%) and more moderately Denmark (–5.6%), Canada (–4.5%), Luxembourg (–4.2%), Ireland (–3.7%), France (–3.2%), Spain (–2.3%), the United Kingdom (2.2%) and Italy (–2.1%). With respect to non-members, in three countries, arrivals grew in 2008 on a double-digit basis: Israel (24.4%), Egypt (15.9%) and Indonesia (13.2%). On the other hand, Romania (–5.5%) and China (–3.1%) recorded declines after periods of rapid growth.
1. TOURISM TRENDS IN THE OECD AREA AND BEYOND
OECD TOURISM TRENDS AND POLICIES 2010 © OECD 2010
16
Table 1.1. International tourist arrivals, 2003-08
International tourist arrivals
Type of indicator1 2007/2003
Average annual growth % 2008/2007 % 2008 million
Austria TCE 2.1 5.6 21.9
Belgium TCE 1.3 0.6 7.1
Czech Republic TCE 7.3 –0.5 6.6 Denmark TCE 7.9 –5.6 4.5 Finland TF 7.8 1.8 3.6 France TF 2.2 –3.2 79.3 Germany TCE 7.3 1.9 24.9
Greece TF 5.8 .. ..
Hungary TF .. 2.0 8.8
Iceland TCE 8.1 4.6 1.1
Ireland TF 5.4 –3.7 8.0
Italy TF 2.5 –2.1 42.7
Luxembourg TCE 1.4 –4.2 0.9 Netherlands TCE 4.6 –8.2 10.1
Norway TF 7.0 1.4 4.4
Poland TF 2.2 –13.5 13.0
Portugal TF 1.3 .. ..
Slovak Republic TCE 5.3 4.9 1.8
Spain TF 3.9 –2.3 57.3
Sweden TCE 5.2 .. ..
Switzerland THS 6.6 1.9 8.6 Turkey TF 13.6 12.3 25.0 United Kingdom TF 5.7 –2.2 30.2
Total Europe 5.5 1.0 4032
Canada TF 0.6 –4.5 17.1
Mexico TF 3.5 5.9 22.6
United States TF 8.0 3.6 58.0
Total America 5.3 4.6 97.7
Japan VF 12.5 0.0 8.4
Korea VF 7.9 6.9 6.9
Australia VF 4.4 –1.1 5.6 New Zealand VF 4.0 –0.3 2.5
Total Asia-Oceania 6.4 2.6 23.4 Total OECD 4.8 1.4 524.12
Brazil TF 5.0 0.5 5.1
Chile TF 11.6 7.7 2.7
China TF 13.5 –3.1 53.0
Egypt TF 13.0 15.9 12.3
Estonia TF 6.8 .. ..
India TF 16.7 5.6 5.4
Indonesia TF 5.4 13.2 6.2
Israel TF 18.1 24.4 2.6
Romania TCE 7.0 –5.5 1.5 Russian Federation TF 0.4 .. ..
Slovenia TCE 6.3 1.1 1.8
South Africa TF 6.5 5.5 9.6
Total World 7.1 1.9 922
1. TCE: International tourist arrivals at collective tourism establishments. TF: International tourist arrivals at frontiers (data exclude same-day visitors). VF: International visitor arrivals at frontiers (data include same-day visitors). THS: International tourist arrivals at hotels and similar establishments.
2. Estimate.
Source: World Tourism Organization.
1. TOURISM TRENDS IN THE OECD AREA AND BEYOND
OECD TOURISM TRENDS AND POLICIES 2010 © OECD 2010 17
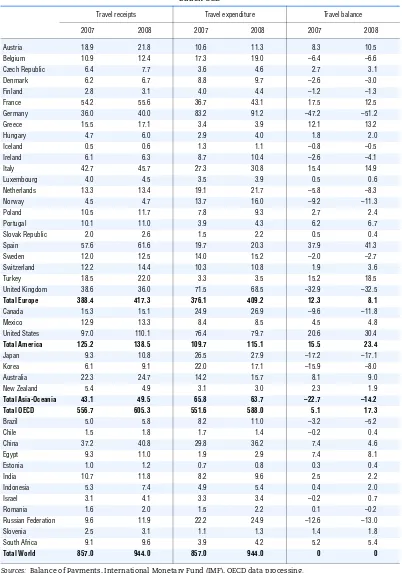
Table 1.2. Travel receipts and expenditure, 2007-08
Billion USD
Travel receipts Travel expenditure Travel balance 2007 2008 2007 2008 2007 2008 Austria 18.9 21.8 10.6 11.3 8.3 10.5 Belgium 10.9 12.4 17.3 19.0 –6.4 –6.6 Czech Republic 6.4 7.7 3.6 4.6 2.7 3.1 Denmark 6.2 6.7 8.8 9.7 –2.6 –3.0 Finland 2.8 3.1 4.0 4.4 –1.2 –1.3 France 54.2 55.6 36.7 43.1 17.5 12.5 Germany 36.0 40.0 83.2 91.2 –47.2 –51.2 Greece 15.5 17.1 3.4 3.9 12.1 13.2 Hungary 4.7 6.0 2.9 4.0 1.8 2.0 Iceland 0.5 0.6 1.3 1.1 –0.8 –0.5 Ireland 6.1 6.3 8.7 10.4 –2.6 –4.1 Italy 42.7 45.7 27.3 30.8 15.4 14.9 Luxembourg 4.0 4.5 3.5 3.9 0.5 0.6 Netherlands 13.3 13.4 19.1 21.7 –5.8 –8.3 Norway 4.5 4.7 13.7 16.0 –9.2 –11.3 Poland 10.5 11.7 7.8 9.3 2.7 2.4 Portugal 10.1 11.0 3.9 4.3 6.2 6.7
Slovak Republic 2.0 2.6 1.5 2.2 0.5 0.4
Spain 57.6 61.6 19.7 20.3 37.9 41.3
Sweden 12.0 12.5 14.0 15.2 –2.0 –2.7
Switzerland 12.2 14.4 10.3 10.8 1.9 3.6 Turkey 18.5 22.0 3.3 3.5 15.2 18.5 United Kingdom 38.6 36.0 71.5 68.5 –32.9 –32.5
Total Europe 388.4 417.3 376.1 409.2 12.3 8.1
Canada 15.3 15.1 24.9 26.9 –9.6 –11.8 Mexico 12.9 13.3 8.4 8.5 4.5 4.8 United States 97.0 110.1 76.4 79.7 20.6 30.4
Total America 125.2 138.5 109.7 115.1 15.5 23.4
Japan 9.3 10.8 26.5 27.9 –17.2 –17.1 Korea 6.1 9.1 22.0 17.1 –15.9 –8.0 Australia 22.3 24.7 14.2 15.7 8.1 9.0 New Zealand 5.4 4.9 3.1 3.0 2.3 1.9
Total Asia-Oceania 43.1 49.5 65.8 63.7 –22.7 –14.2 Total OECD 556.7 605.3 551.6 588.0 5.1 17.3
Brazil 5.0 5.8 8.2 11.0 –3.2 –5.2 Chile 1.5 1.8 1.7 1.4 –0.2 0.4 China 37.2 40.8 29.8 36.2 7.4 4.6 Egypt 9.3 11.0 1.9 2.9 7.4 8.1 Estonia 1.0 1.2 0.7 0.8 0.3 0.4 India 10.7 11.8 8.2 9.6 2.5 2.2 Indonesia 5.3 7.4 4.9 5.4 0.4 2.0 Israel 3.1 4.1 3.3 3.4 –0.2 0.7 Romania 1.6 2.0 1.5 2.2 0.1 –0.2 Russian Federation 9.6 11.9 22.2 24.9 –12.6 –13.0
Slovenia 2.5 3.1 1.1 1.3 1.4 1.8
South Africa 9.1 9.6 3.9 4.2 5.2 5.4
Total World 857.0 944.0 857.0 944.0 0 0
Sources:Balance of Payments, International Monetary Fund (IMF), OECD data processing.
1. TOURISM TRENDS IN THE OECD AREA AND BEYOND
OECD TOURISM TRENDS AND POLICIES 2010 © OECD 2010
18
arrivals. On the whole, OECD countries gained USD 48.6 billion more in 2008 than in 2007 whereas their expenses rose only by USD 36.4 billion. Thus, the balance improved by USD 12.2 billion for the OECD area as a whole.
However, trends differ among countries:
● The positive balance of American OECD countries increased by USD 7.9 billion, induced by a USD 10 billion rise in the US balance.
● The negative balance of the Asia-Oceania OECD countries was reduced by USD 8.5 billion, mainly due to the Korean deficit which diminished by USD 7.9 billion.
● For the European OECD countries, the positive overall balance was reduced by USD 4.1 billion. Most countries suffered a slight deterioration in their balances, particularly Germany, France, the Netherlands, Norway and Ireland. In these countries, the decrease in inbound flows was not compensated by corresponding decrease of outbound flows. Only a few traditional net exporting countries recorded a slight improvement in their balances: Spain, Turkey, Greece and Austria.
In line with tourist arrivals, international air transport has paid a large tribute to the crisis. According to International Air Transport Association (IATA) data, the volume of international passenger air traffic (measured by Revenue Passenger Kilometres) slowed down from a growth rate of 7.6% in 2007 to 2.4% in 2008. Air traffic started to decline by the summer of 2008 and in the first half of 2009, the decline became very evident, prompting IATA to forecast in July 2009 an overall –8% decline for 2009. IATA noticed a sharp reduction in business travel and a tendency to replace business class with economy class travel.
The high seasonality of tourism also has to be taken into account to obtain a correct overview of major trends (Box 1.1). However, it is too early to give a precise description of the tourism activity in 2009 compared with the general economic outlook especially because of the specific seasonal pattern of tourism. What can be drawn from preliminary and partial data is that tourism flows could have been more affected in the low season (mostly in the 1st quarter of 2009) than in the high season (3rd quarter of 2009), notably because the holiday travel behaviours can be considered as slightly less volatile than business travel behaviours.
Box 1.1. Tourism and seasonality
1. TOURISM TRENDS IN THE OECD AREA AND BEYOND
OECD TOURISM TRENDS AND POLICIES 2010 © OECD 2010 19
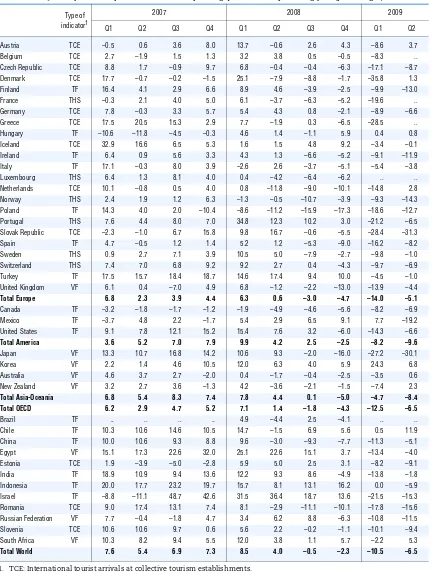
Table 1.3. International tourist arrivals, 2007-09
Quarterly data compared with the corresponding quarter of the preceding year (percentages)
Type of indicator1
2007 2008 2009
Q1 Q2 Q3 Q4 Q1 Q2 Q3 Q4 Q1 Q2 Austria TCE –0.5 0.6 3.6 8.0 13.7 –0.6 2.6 4.3 –8.6 3.7 Belgium TCE 2.7 –1.9 1.5 1.3 3.2 3.8 0.5 –0.5 –8.3 .. Czech Republic TCE 8.8 1.7 –0.9 9.7 6.8 –0.4 –0.4 –6.3 –17.1 –8.7 Denmark TCE 17.7 –0.7 –0.2 –1.5 25.1 –7.9 –8.8 –1.7 –35.8 1.3 Finland TF 16.4 4.1 2.9 6.6 8.9 4.6 –3.9 –2.5 –9.9 –13.0 France THS –0.3 2.1 4.0 5.0 6.1 –3.7 –6.3 –5.2 –19.6 .. Germany TCE 7.8 –0.3 3.3 5.7 5.4 4.3 0.8 –2.1 –8.9 –6.6 Greece TCE 17.5 20.5 15.3 2.9 7.7 –1.9 0.3 –6.5 –28.5 .. Hungary TF –10.6 –11.8 –4.5 –0.3 4.6 1.4 –1.1 5.9 0.4 0.8 Iceland TCE 32.9 16.6 6.5 5.3 1.6 1.5 4.8 9.2 –3.4 –0.1 Ireland TF 6.4 0.9 5.6 3.3 4.3 1.3 –6.6 –5.2 –9.1 –11.9 Italy TF 17.1 –0.3 8.0 3.9 –2.6 2.6 –3.7 –5.1 –5.4 –3.8 Luxembourg THS 6.4 1.3 8.1 4.0 0.4 –4.2 –6.4 –6.2 .. .. Netherlands TCE 10.1 –0.8 0.5 4.0 0.8 –11.8 –9.0 –10.1 –14.8 2.8 Norway THS 2.4 1.9 1.2 6.3 –1.3 –0.5 –10.7 –3.9 –9.3 –14.3 Poland TF 14.3 4.0 2.0 –10.4 –8.6 –11.2 –15.9 –17.3 –18.6 –12.7 Portugal THS 7.6 4.4 8.0 7.0 34.8 12.3 10.2 3.0 –21.2 –6.5
Slovak Republic TCE –2.3 –1.0 6.7 15.8 9.8 16.7 –0.6 –5.5 –28.4 –31.3
Spain TF 4.7 –0.5 1.2 1.4 5.2 1.2 –5.3 –9.0 –16.2 –8.2
Sweden THS 0.9 2.7 7.1 3.9 10.5 5.0 –7.9 –2.7 –9.8 –1.0
Switzerland THS 7.4 7.0 6.8 9.2 9.2 2.7 0.4 –4.3 –9.7 –6.9 Turkey TF 17.5 15.7 18.4 18.7 14.6 17.4 9.4 10.0 –4.5 –1.0 United Kingdom VF 6.1 0.4 –7.0 4.9 6.8 –1.2 –2.2 –13.0 –13.9 –4.4
Total Europe 6.8 2.3 3.9 4.4 6.3 0.6 –3.0 –4.7 –14.0 –5.1
Canada TF –3.2 –1.8 –1.7 –1.2 –1.9 –4.9 –4.6 –5.6 –8.2 –6.9 Mexico TF –3.7 4.8 2.2 –1.7 5.4 2.9 6.5 9.1 7.7 –19.2 United States TF 9.1 7.8 12.1 15.2 15.4 7.6 3.2 –6.0 –14.3 –6.6
Total America 3.6 5.2 7.0 7.9 9.9 4.2 2.5 –2.5 –8.2 –9.6
Japan VF 13.3 10.7 16.8 14.2 10.6 9.3 –2.0 –16.0 –27.2 –30.1 Korea VF 2.2 1.4 4.6 10.5 12.0 6.3 4.0 5.9 24.3 6.8 Australia VF 4.6 3.7 2.7 –2.0 0.4 –1.7 –0.4 –2.5 –3.5 0.6 New Zealand VF 3.2 2.7 3.6 –1.3 4.2 –3.6 –2.1 –1.5 –7.4 2.3
Total Asia-Oceania 6.8 5.4 8.3 7.4 7.8 4.4 0.1 –5.0 –4.7 –8.4 Total OECD 6.2 2.9 4.7 5.2 7.1 1.4 –1.8 –4.3 –12.5 –6.5
Brazil TF .. .. .. .. 4.9 –4.4 2.5 –4.1 .. .. Chile TF 10.3 10.6 14.6 10.5 14.7 –1.5 6.9 5.6 0.5 11.9 China TF 10.0 10.6 9.3 8.8 9.6 –3.0 –9.3 –7.7 –11.3 –5.1 Egypt VF 15.1 17.3 22.6 32.0 25.1 22.6 15.1 3.7 –13.4 –4.0 Estonia TCE 1.9 –3.9 –5.0 –2.8 5.9 5.0 2.5 3.1 –8.2 –9.1 India TF 18.9 10.9 9.4 13.6 12.2 9.3 8.6 –4.9 –13.8 –1.8 Indonesia TF 20.0 17.7 23.2 19.7 15.7 8.1 13.1 16.2 0.0 –5.9 Israel TF –8.8 –11.1 48.7 42.6 31.5 36.4 18.7 13.6 –21.5 –15.3 Romania TCE 9.0 17.4 13.1 7.4 8.1 –2.9 –11.1 –10.1 –17.8 –15.6 Russian Federation VF 7.7 –0.4 –1.8 4.7 3.4 6.2 8.8 –6.3 –10.8 –11.5
Slovenia TCE 10.6 10.6 9.7 0.6 5.6 2.2 –0.2 –1.1 –10.1 –9.4
South Africa VF 10.3 8.2 9.4 5.5 12.0 3.8 1.1 5.7 –2.2 5.3
Total World 7.6 5.4 6.9 7.3 8.5 4.0 –0.5 –2.3 –10.5 –6.5
1. TCE: International tourist arrivals at collective tourism establishments. TF: International tourist arrivals at frontiers (data exclude same-day visitors). VF: International visitor arrivals at frontiers (data include same-day visitors). THS: International tourist arrivals at hotels and similar establishments. Source: World Tourism Organization.
1. TOURISM TRENDS IN THE OECD AREA AND BEYOND
OECD TOURISM TRENDS AND POLICIES 2010 © OECD 2010
20
According to monthly and quarterly data (Table 1.3), tourism activity started to decline in the second half of 2008 in parallel with the general economic activity. As for international tourism, the contraction of its overall volume approximately followed the same calendar, but with more ample variations. More precisely, the general pattern, with exceptions, consists of a buoyant first half of the year 2008 and a sharp decline in the second half of the year, which became even stronger during the first half of 2009. International arrivals to all OECD countries started to decrease (–1.8%) in the summer of 2008. This is a moderate decrease considering that the reference level in 2007 was well above (+4.7%) the level of 2006. The contraction was accentuated in the last quarter of 2008 (–4.3%) and even more in the first quarter of 2009 (–12.5%). However, the reference quarter of the preceding year was at a high level. With a more moderate reference, the second quarter of 2009 recorded another decline (–6.5%).
Domestic tourism appears more resistant
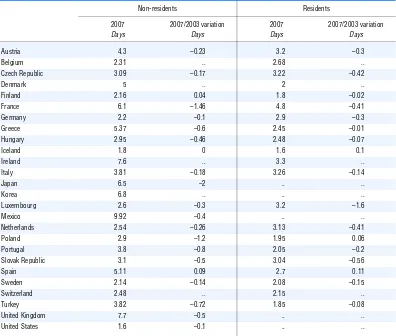
Domestic tourism appears more resistant than international tourism. This is a general pattern that is confirmed in the present crisis by the partial available data. This is illustrated by Table 1.4 where data on quarterly number of nights spent in hotels and similar establishments have been gathered for the OECD European countries. The data are split between resident and non-resident customers. In general, the hotel type of accommodation represents a largely higher proportion between all types of accommodation for non-resident visitors than for residents. Therefore, particularly for residents, these data have to be confirmed by other data covering more types of accommodation.
In many European countries, the decrease in the numbers of nights spent by non-residents occurred before the decline for non-residents. The decline was much more severe for non-residents, particularly in the first quarter of 2009 and starting as early as the second quarter of 2008 when declines for residents generally started in the third quarter. Spain appears to be among the exceptions, at least until the first quarter of 2009 when the decline was sharper for residents than for non-residents.
Tourism trends in the OECD area and beyond
Over the past twenty years, tourism has been playing its part in economic globalisation (see also Chapter 2), on the basis of three main factors:
● the dynamism of the world economy, which has seen new economic powers emerge while industrial countries have continued to exhibit appreciable growth and with it, rising incomes;
● the development of new and cheaper means of transport; and
● the intensive use of information and communication technologies (ICT) in tourism and their impact on value creation chains.
The image of tourism has also been transformed in at least three aspects:
● on the supply side, competition between destinations has become sharper; ● on the demand side, new international customers have emerged; and ● on the demand side, people are making more trips but for shorter periods.
1. TOURISM TRENDS IN THE OECD AREA AND BEYOND
OECD TOURISM TRENDS AND POLICIES 2010 © OECD 2010 21
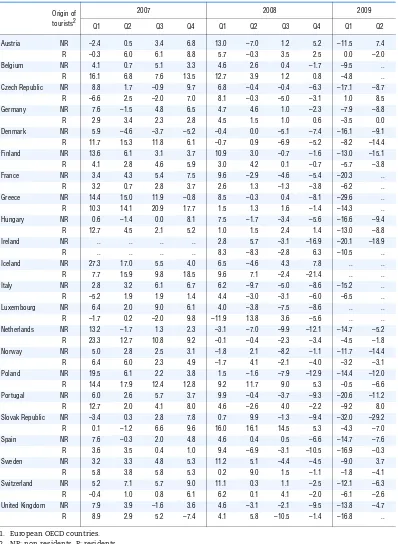
Table 1.4. Nights spent in hotels and similar establishments, 2007-091
Quarterly data compared with the corresponding quarter of the preceding year (percentages)
Origin of tourists2
2007 2008 2009
Q1 Q2 Q3 Q4 Q1 Q2 Q3 Q4 Q1 Q2 Austria NR –2.4 0.5 3.4 6.8 13.0 –7.0 1.2 5.2 –11.5 7.4 R –0.3 6.0 6.1 8.8 5.7 –0.3 3.5 2.5 0.0 –2.0 Belgium NR 4.1 0.7 5.1 3.3 4.6 2.6 0.4 –1.7 –9.5 .. R 16.1 6.8 7.6 13.5 12.7 3.9 1.2 0.8 –4.8 .. Czech Republic NR 8.8 1.7 –0.9 9.7 6.8 –0.4 –0.4 –6.3 –17.1 –8.7 R –6.6 2.5 –2.0 7.0 8.1 –0.3 –5.0 –3.1 1.0 8.5 Germany NR 7.6 –1.5 4.8 6.5 4.7 4.6 1.0 –2.3 –7.9 –8.8 R 2.9 3.4 2.3 2.8 4.5 1.5 1.0 0.6 –3.5 0.0 Denmark NR 5.9 –4.6 –3.7 –5.2 –0.4 0.0 –5.1 –7.4 –16.1 –9.1 R 11.7 15.3 11.8 6.1 –0.7 0.9 –6.9 –5.2 –8.2 –14.4 Finland NR 13.6 6.1 3.1 3.7 10.9 3.0 –0.7 –1.6 –13.0 –15.1 R 4.1 2.8 4.6 5.9 3.0 4.2 0.1 –0.7 –5.7 –3.8 France NR 3.4 4.3 5.4 7.5 9.6 –2.9 –4.6 –5.4 –20.3 .. R 3.2 0.7 2.8 3.7 2.6 1.3 –1.3 –3.8 –6.2 .. Greece NR 14.4 15.0 11.9 –0.8 8.5 –0.3 0.4 –8.1 –29.6 .. R 10.3 14.1 20.9 17.7 1.5 1.3 1.6 –1.4 –14.3 .. Hungary NR 0.6 –1.4 0.0 8.1 7.5 –1.7 –3.4 –5.6 –16.6 –9.4 R 12.7 4.5 2.1 5.2 1.0 1.5 2.4 1.4 –13.0 –8.8 Ireland NR .. .. .. .. 2.8 5.7 –3.1 –16.9 –20.1 –18.9 R .. .. .. .. 8.3 –8.3 –2.8 6.3 –10.5 .. Iceland NR 27.3 17.0 5.5 4.0 6.5 –4.6 4.3 7.8 .. .. R 7.7 15.9 9.8 18.5 9.6 7.1 –2.4 –21.4 .. .. Italy NR 2.8 3.2 6.1 6.7 6.2 –9.7 –5.0 –8.6 –15.2 .. R –5.2 1.9 1.9 1.4 4.4 –3.0 –3.1 –6.0 –6.5 .. Luxembourg NR 6.4 2.0 9.0 6.1 4.0 –3.8 –7.5 –8.6 .. .. R –1.7 0.2 –2.0 9.8 –11.9 13.8 3.6 –5.6 .. .. Netherlands NR 13.2 –1.7 1.3 2.3 –3.1 –7.0 –9.9 –12.1 –14.7 –5.2 R 23.3 12.7 10.8 9.2 –0.1 –0.4 –2.3 –3.4 –4.5 –1.8 Norway NR 5.0 2.8 2.5 3.1 –1.8 2.1 –8.2 –1.1 –11.7 –14.4 R 6.4 6.0 2.3 4.9 –1.7 4.1 –2.1 –4.0 –3.2 –3.1 Poland NR 19.5 6.1 2.2 3.8 1.5 –1.6 –7.9 –12.9 –14.4 –12.0 R 14.4 17.9 12.4 12.8 9.2 11.7 9.0 5.3 –0.5 –6.6 Portugal NR 6.0 2.6 5.7 3.7 9.9 –0.4 –3.7 –9.3 –20.6 –11.2 R 12.7 2.0 4.1 8.0 4.6 –2.6 4.0 –2.2 –9.2 8.0
Slovak Republic NR –3.4 0.3 2.8 7.8 0.7 9.9 –1.3 –9.4 –32.0 –29.2 R 0.1 –1.2 6.6 9.6 16.0 16.1 14.5 5.3 –4.3 –7.0
Spain NR 7.6 –0.3 2.0 4.8 4.6 0.4 0.5 –6.6 –14.7 –7.6 R 3.6 3.5 0.4 1.0 9.4 –6.9 –3.1 –10.5 –16.9 –0.3
Sweden NR 3.2 3.3 4.8 5.3 11.2 5.1 –4.4 –4.5 –9.0 3.7
R 5.8 3.8 5.8 5.3 0.2 9.0 1.5 –1.1 –1.8 –4.1
Switzerland NR 5.2 7.1 5.7 9.0 11.1 0.3 1.1 –2.5 –12.1 –6.3 R –0.4 1.0 0.8 6.1 6.2 0.1 4.1 –2.0 –6.1 –2.6 United Kingdom NR 7.9 3.9 –1.6 3.6 4.6 –3.1 –2.1 –9.5 –13.8 –4.7 R 8.9 2.9 5.2 –7.4 4.1 5.8 –10.5 –1.4 –16.8 ..
1. European OECD countries. 2. NR: non-residents, R: residents.
Source: Eurostat (Statistical Office of the European Communities).
1. TOURISM TRENDS IN THE OECD AREA AND BEYOND
OECD TOURISM TRENDS AND POLICIES 2010 © OECD 2010
22
This chapter examines medium- and long-term tourism trends, drawing upon available statistics (Box 1.2). The tourism statistics system has been greatly strengthened during the period under review, although it is still not as complete as it should be. Thus, detailed data from the Tourism Satellite Accounts are still too scarce to allow analysis over sufficiently long periods.
Domestic tourism is playing a predominant role
Domestic tourism, i.e. travel by residents within their own country, far outweighs inbound tourism. For the OECD area, domestic tourism consumption accounts for about 75% of tourism consumption within the zone, with the remainder representing inbound tourism. Domestic tourism has been long regarded with less interest, mainly because it is not a source of foreign exchange. Consequently, it has tended to be overlooked in tourism statistics (Box 1.3). The Tourism Satellite Account (TSA) has the advantage of placing a value on tourism flows; thus, in general, for equal flows of resident and non-resident tourists, the latter generate much greater tourism spending. Nevertheless, domestic tourism flows are far more important than inbound tourism flows in most developed countries (Table 1.5).
The share of domestic tourism in a country’s total internal tourism varies greatly; it is nearly 95% in Japan but only around 36% in Poland. A number of factors explain this discrepancy:
● country size: the bigger the country, the more important domestic tourism is likely to be; ● geographic location: a country that is readily accessible to residents of other countries will
attract more visitors than one that is isolated. Ease of access is influenced mainly by the availability of convenient and inexpensive means of transport;
● accommodation capacity; and
● points of attraction: nature (e.g. sea, mountains), culture (e.g. museums), etc.
Box 1.2. Availability and quality of statistical data on tourism
This chapter relies primarily on statistics covering the period 1990-2008 (eventually partial data for 2009). A few isolated statistics relate to earlier years. It must be borne in mind that the base series still lack statistical continuity. The authors have attempted, to the extent possible, to identify statistical discontinuities. There have been methodological changes over the course of these years, especially in survey techniques.
The paper draws upon several different databases:
● the OECD databases, with respect to tourism data, Balance of Payments data on services,
national accounts data, exchange rate and price data, structural statistics on enterprises;
● the World Tourism Organization, for data on international tourism flows, particularly for
non-OECD countries;
● Eurostat, for statistics on tourist accommodation; and
● national sources for Tourism Satellite Accounts, and occasionally, for other data.
1. TOURISM TRENDS IN THE OECD AREA AND BEYOND
OECD TOURISM TRENDS AND POLICIES 2010 © OECD 2010 23
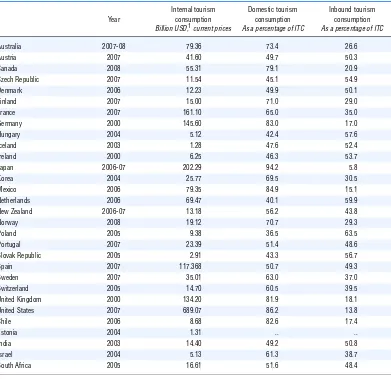
Table 1.5. Tourism Satellite Account: Internal tourism consumption (ITC)
Year
Internal tourism consumption Billion USD,1 current prices
Domestic tourism consumption As a percentage of ITC
Inbound tourism consumption As a percentage of ITC
Australia 2007-08 79.36 73.4 26.6 Austria 2007 41.60 49.7 50.3 Canada 2008 55.31 79.1 20.9 Czech Republic 2007 11.54 45.1 54.9 Denmark 2006 12.23 49.9 50.1 Finland 2007 15.00 71.0 29.0 France 2007 161.10 65.0 35.0 Germany 2000 145.60 83.0 17.0 Hungary 2004 5.12 42.4 57.6 Iceland 2003 1.28 47.6 52.4 Ireland 2000 6.25 46.3 53.7 Japan 2006-07 202.29 94.2 5.8 Korea 2004 25.77 69.5 30.5 Mexico 2006 79.35 84.9 15.1 Netherlands 2006 69.47 40.1 59.9 New Zealand 2006-07 13.18 56.2 43.8 Norway 2008 19.12 70.7 29.3 Poland 2005 9.38 36.5 63.5 Portugal 2007 23.39 51.4 48.6
Slovak Republic 2005 2.91 43.3 56.7
Spain 2007 117.368 50.7 49.3
Sweden 2007 35.01 63.0 37.0
Switzerland 2005 14.70 60.5 39.5 United Kingdom 2000 134.20 81.9 18.1 United States 2007 689.07 86.2 13.8
Chile 2006 8.68 82.6 17.4
Estonia 2004 1.31 .. .. India 2003 14.40 49.2 50.8 Israel 2004 5.13 61.3 38.7
South Africa 2005 16.61 51.6 48.4
1. The conversion from national currency data to data in US dollars has been calculated using annual average exchange rates for the corresponding year.
Sources: Country data, OECD data processing.
1 2 http://dx.doi.org/10.1787/764451883340
Box 1.3. Measuring domestic tourism
1. TOURISM TRENDS IN THE OECD AREA AND BEYOND
OECD TOURISM TRENDS AND POLICIES 2010 © OECD 2010
24
TSA data are not available for all OECD countries nor are they available in sufficiently long series to allow comparison between the dynamics of the two components of internal consumption. Data on overnight stays in commercial accommodation by residents and by non-residents have long been collected and these can provide an idea of the dynamics.
In many countries, residents rely heavily on non-commercial accommodation (with relatives, friends, or secondary homes), but they nevertheless constitute a substantial clientele of commercial establishments, and collective accommodation receives more residents than non-residents in several countries (Figure 1.1). In Germany and in Poland, residents account for around 80% of all nights spent in collective accommodation. By contrast, the countries where inbound tourism outweighs domestic tourism are either high-intensity tourism countries such as Austria, Greece, Turkey, Portugal and Spain or countries of small size, such as Luxembourg and Iceland.
Domestic tourism appears to be less dynamic than inbound tourism; for example, over the period 2003-07, when tourism was recovering strongly from its trough in the early years of the decade, the average annual growth rate (for countries listed in Figure 1.1) in the number of overnight stays by residents was barely 1%, or two percentage points below the corresponding growth rate for inbound tourism.
International tourism is highly sensitive to external factors
International tourism is the main focus of attention even though it still constitutes only a modest fraction of the tourism industries as a whole, particularly in OECD countries. Nevertheless, it constitutes by far the most rapidly growing tourism segment, and is playing a large role in the globalisation process. OECD countries are now witnessing the emergence of new competitors. Chief among these new competitors are countries that are playing an ever more important role in the world economy: Brazil, China, India and the Russian Federation. These countries are experiencing strong growth in inbound and outbound
Figure 1.1. Shares of nights spent in collective accommodation by residents, 2008
Percentages of nights spent by residents/nights spent by residents and non-residents
1. 2007 data.
Sources: Eurostat, World Tourism Organization.
1 2 http://dx.doi.org/10.1787/764055055062 90 80 70 60 50 40 30 20 10 0
Germany Pol
and Swed en 1 Finl and No rway Ne ther lands Ca nada 1 Den mar k Uni ted King dom 1 Fran ce Slov
ak Republi
c New Zeal and 1 Ital y1 Swit zerla nd 1 Hun gary 1 Czec
h Re
1. TOURISM TRENDS IN THE OECD AREA AND BEYOND
OECD TOURISM TRENDS AND POLICIES 2010 © OECD 2010 25
tourism alike, although this seems to be a result rather than a cause of economic growth. On the other hand, some smaller countries are looking primarily to tourism to drive their development.
The performance of international tourism is closely linked to that of the world economy
Over the last twenty years, international tourism, as measured by the number of tourist arrivals (Box 1.4), has mirrored the four downturns in the world economy, measured by global GDP, which occurred in 1991, 1998, 2001 and 2008 (Figure 1.2). The events of 11 September 2001 accentuated the fall in tourism at the end of that year. Tourism suffered another setback in 2003, despite accelerating world growth. Factors specific to tourism were reflected during this period, such as terrorist threats, the outbreak of the Iraq war, the Severe Acute Respiratory Syndrome (SARS) crisis and the spread of the avian flu in Asia and the Pacific. Yet the shocks that tourism experienced over the period had effects that were very short-lived and were rapidly absorbed. Overall, international tourism growth was far more robust than economic growth. For the period as a whole, the average annual growth rate in tourist arrivals was 4.6%, compared to 3.4% for global GDP.
Box 1.4. Indicators for measuring international tourism
The analysis presented here on international tourism relies on two main indicators: tourist arrivals and tourism receipts. These indicators have the advantage of being available over a fairly long period of time, and almost continuously for most countries. They have some drawbacks, however, which must be borne in mind, with respect to arrivals of non-resident tourists:
● By definition, these do not include same-day visitors (or day excursionists).
● These usually correspond to border arrivals but for some countries they relate to arrivals
in collective accommodation establishments, or in hotels alone.
● These do not take account of length of stay. Data on visitor nights would certainly be
more useful, but they are unavailable for many countries. Thus, “pass-through” countries receive far more arrivals because of their geographic location. In practical terms, for countries that have both types of statistics, the number of arrivals generally rises faster than the number of visitor nights, because of the trend to shorter stays. On the other hand, expenditures per night tend to vary inversely with length of stay, if only because some travel expenses are essentially fixed and are unaffected by length of stay.
● Arrival statistics are very sensitive to the delineation of borders. For example, in the
United States its arrival statistics do not include movements between different states, while in Europe the figures record movements between countries.
Data on receipts and expenditures are derived from an evaluation of the “travel” and “transportation passenger services” lines in the Balance of Payments. The “travel” line is available for most countries over a long period. For transportation passenger services, data are frequently unavailable.
1. TOURISM TRENDS IN THE OECD AREA AND BEYOND
OECD TOURISM TRENDS AND POLICIES 2010 © OECD 2010
26
World tourism is shifting to the South and the East
In the years following the Second World War (Figure 1.3), international tourism involved primarily Europe and North America. Since the 1970s, Asia-Pacific, Africa and the Middle East have taken a significant share of world tourism. Europe, however, still accounts for more than half, both in terms of international tourist arrivals and tourism receipts. For the last decade, Asia-Pacific has surpassed the Americas (North, Central and South America), accounting for about more than 20% of international tourism in terms of arrivals and receipts. The Americas rank third, with around 20% of revenues and only 16% of arrivals. Africa and the Middle East lag far behind, despite strong growth in their market shares, which now stand at around 5% in terms of arrivals and slightly less, between 3% and 4%, for the associated receipts.
Figure 1.2. World international tourist arrivals and GDP growth, 1989-08
Sources: International Monetary Fund, World Tourism Organization.
1 2 http://dx.doi.org/10.1787/764056713612
Figure 1.3. International tourism: Market share by region, 1950-081
1. Measured in terms of tourist arrivals. Source: World Tourism Organization.
1 2 http://dx.doi.org/10.1787/764121267272 12 10 8 6 4 2 0 -2 -4 19 89
1990 19 91
1992 1993 1994 1995 1996 19 97
1998 1999 2000 20 01
2002 2003 2004 2005 2006 20 07
2008
GDP growth (%) World arrivals growth (%)
1950 1960 1965 1970 1975 1980 1981 1982 1983 1984 1985 1986 1987 1988 1989 1990 1991 1992 1993 19
94
1995 19
96
1997 1998 1999 2000 20
01 20 02 20 03 20 04 20 05 20 06 20 07 20 08 100 90 80 70 60 50 40 30 20 10 0
1. TOURISM TRENDS IN THE OECD AREA AND BEYOND
OECD TOURISM TRENDS AND POLICIES 2010 © OECD 2010 27
OECD countries are losing market shares
Over the last 20 years, OECD countries as a whole have seen a decline in their share of international tourism and of the world economy. Growth in arrivals averaged only 2.8% versus 4.4% worldwide, and GDP growth was 2.4% versus 3.4% worldwide (Table 1.6).
In 2008, however, OECD countries still held a majority share of international tourism: 57% of arrivals and 67% of receipts (Box 1.5). Since 2000, the loss has been 10 percentage points for arrivals but only 5 percentage points for receipts. During the decade 1990-2000, the loss was around five percentage points both for arrivals and for receipts.
OECD countries are unevenly distributed among the broad geographic areas of global tourism: these account for 80% of European tourism, 60% of American hemisphere tourism, and only 12% of Asian tourism. In particular, there are few OECD countries in the fast-growing tourism areas.
In Europe, over the last two decades, tourism development has been relatively modest in western European countries, which continue however to receive the greatest numbers of tourists. It has been especially dynamic in the countries of central and eastern Europe, and has remained fairly strong in southern Europe and around the Mediterranean, and also in the countries of northern Europe.
In central and eastern Europe, the rapid expansion of inbound tourism began in the early 1990s after the fall of the Berlin wall. Growth remained fairly strong into the present decade, particularly in the Czech Republic and in the Slovak Republic. In Estonia, inbound tourism grew rapidly during the 1990s, but has tended to stagnate since 2000. In the Russian Federation, visitor arrivals have been rising at a modest pace during this decade.
The southern Europe and Mediterranean zone has traditionally attracted heavy tourism inflows. OECD countries account for the preponderant share, with around 85% of arrivals, but they are subject to heavy competition from North African countries and also from destinations such as Croatia and Slovenia. In Slovenia, inbound tourism has grown very quickly in the 1990s and since 2000. Despite this competition, the destinations traditionally most visited, such as Spain and Italy, have maintained their position with a growth rate of 3%
Box 1.5. Limitations of the market share concept for analysing
the competitiveness of destinations
The usefulness of the market shares concept for analysing the competitiveness of destinations should not be overestimated by making it an overriding objective of tourism policy. This caution holds whether market share is measured by visitor arrivals or by tourism receipts, or indeed by other indicators. It is backed by at least two arguments:
● In the last few decades, competition on world tourism markets has become fiercer, with
the rising clout of new destinations. Countries that have a long-standing tradition of receiving foreign tourists are unlikely to see their tourism industry grow as fast as those in countries that are just opening up to tourism. An analogy can be drawn here with product cycle theories.
● A tourism destination is not a “product” in the common sense. A measure of
1. TOURISM TRENDS IN THE OECD AREA AND BEYOND
OECD TOURISM TRENDS AND POLICIES 2010 © OECD 2010
28
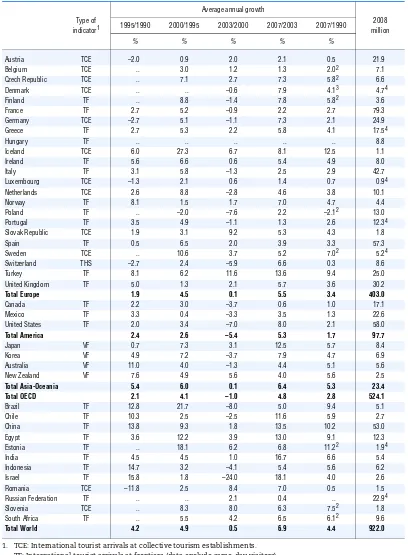
Table 1.6. International tourist arrivals, 1990-2008
Type of indicator1
Average annual growth
2008 million
1995/1990 2000/1995 2003/2000 2007/2003 2007/1990
% % % % %
Austria TCE –2.0 0.9 2.0 2.1 0.5 21.9 Belgium TCE .. 3.0 1.2 1.3 2.02 7.1 Czech Republic TCE .. 7.1 2.7 7.3 5.82 6.6
Denmark TCE .. .. –0.6 7.9 4.13 4.74 Finland TF .. 8.8 –1.4 7.8 5.82 3.6 France TF 2.7 5.2 –0.9 2.2 2.7 79.3 Germany TCE –2.7 5.1 –1.1 7.3 2.1 24.9 Greece TF 2.7 5.3 2.2 5.8 4.1 17.54 Hungary TF .. .. .. .. .. 8.8 Iceland TCE 6.0 27.3 6.7 8.1 12.5 1.1 Ireland TF 5.6 6.6 0.6 5.4 4.9 8.0 Italy TF 3.1 5.8 –1.3 2.5 2.9 42.7 Luxembourg TCE –1.3 2.1 0.6 1.4 0.7 0.94
Netherlands TCE 2.6 8.8 –2.8 4.6 3.8 10.1 Norway TF 8.1 1.5 1.7 7.0 4.7 4.4 Poland TF .. –2.0 –7.6 2.2 –2.12 13.0
Portugal TF 3.5 4.9 –1.1 1.3 2.6 12.34
Slovak Republic TCE 1.9 3.1 9.2 5.3 4.3 1.8
Spain TF 0.5 6.5 2.0 3.9 3.3 57.3
Sweden TCE .. 10.6 3.7 5.2 7.02 5.24
Switzerland THS –2.7 2.4 –5.9 6.6 0.3 8.6 Turkey TF 8.1 6.2 11.6 13.6 9.4 25.0 United Kingdom TF 5.0 1.3 2.1 5.7 3.6 30.2
Total Europe 1.9 4.5 0.1 5.5 3.4 403.0
Canada TF 2.2 3.0 –3.7 0.6 1.0 17.1 Mexico TF 3.3 0.4 –3.3 3.5 1.3 22.6 United States TF 2.0 3.4 –7.0 8.0 2.1 58.0
Total America 2.4 2.6 –5.4 5.3 1.7 97.7
Japan VF 0.7 7.3 3.1 12.5 5.7 8.4 Korea VF 4.9 7.2 –3.7 7.9 4.7 6.9 Australia VF 11.0 4.0 –1.3 4.4 5.1 5.6 New Zealand VF 7.6 4.9 5.6 4.0 5.6 2.5
Total Asia-Oceania 5.4 6.0 0.1 6.4 5.3 23.4 Total OECD 2.1 4.1 –1.0 4.8 2.8 524.1
Brazil TF 12.8 21.7 –8.0 5.0 9.4 5.1 Chile TF 10.3 2.5 –2.5 11.6 5.9 2.7 China TF 13.8 9.3 1.8 13.5 10.2 53.0 Egypt TF 3.6 12.2 3.9 13.0 9.1 12.3 Estonia TF .. 18.1 6.2 6.8 11.22 1.94 India TF 4.5 4.5 1.0 16.7 6.6 5.4 Indonesia TF 14.7 3.2 –4.1 5.4 5.6 6.2 Israel TF 15.8 1.8 –24.0 18.1 4.0 2.6 Romania TCE –11.8 2.5 8.4 7.0 0.5 1.5 Russian Federation TF .. .. 2.1 0.4 .. 22.94
Slovenia TCE .. 8.3 8.0 6.3 7.52 1.8
South Africa TF .. 5.5 4.2 6.5 6.12 9.6
Total World 4.2 4.9 0.5 6.9 4.4 922.0
1. TCE: International tourist arrivals at collective tourism establishments. TF: International tourist arrivals at frontiers (data exclude same-day visitors). VF: International visitor arrivals at frontiers (data include same-day visitors). THS: International tourist arrivals at hotels and similar establishments. 2. 2007/1995.
3. 2007/2000. 4. 2007 data.
Sources:World Tourism Organization, OECD data processing.
1. TOURISM TRENDS IN THE OECD AREA AND BEYOND
OECD TOURISM TRENDS AND POLICIES 2010 © OECD 2010 29
a year, or slightly even more for Spain. Tourism growth rates in Turkey and Greece have exceeded the OECD average.
There are many OECD members in western and northern Europe. Inbound tourism growth has generally been more dynamic in northern countries, such as Iceland, Sweden, Finland, Ireland and Denmark. While significant, inbound tourism growth has been somewhat weaker in the Netherlands, the United Kingdom and France. Germany has seen particularly strong growth since 2003.
On the American continent, the OECD countries (Canada, Mexico and the United States) should be distinguished from the other areas (South America, the Caribbean and Central America). For the OECD countries, inbound tourism has been growing slowly in the last two decades. The setbacks observed from 2000 to 2003 were absorbed fairly promptly after 2004, especially in the United States, where the depreciation of the dollar against the euro has attracted visitors from across the Atlantic. In South and Central America and in the Caribbean, while the volume of international tourism is still far short of that in North America, growth rates have been much higher for at least 20 years. That growth has been especially strong in Central America, and in particular for the three countries that receive the most tourists: Costa Rica, Guatemala and El Salvador. It was slightly slower but still strong in South America, particularly in Brazil, Argentina, Chile and Peru.
International tourism in Asia-Pacific has been booming, and China is now one of the most popular destinations in the world. Since 1990, tourist arrivals in China have increased by a factor of five and more. For the two OECD countries in Asia – Japan and Korea – inbound tourism growth has also outpaced the world average. Increases in tourist arrivals in those two countries were particularly strong between 2003 and 2007.
Australia and New Zealand are the two main destinations in Oceania. Since 2003, their inbound tourism growth rate has matched or has slightly been under the world average.
Trends in tourism expenditure and receipts
In estimating each country’s tourism expenditure and receipts, this section uses credit and debit data from the “travel” and “transportation passenger services” items of the Balance of Payments.2
OECD countries are leading receiving and spending countries. The OECD is both a large
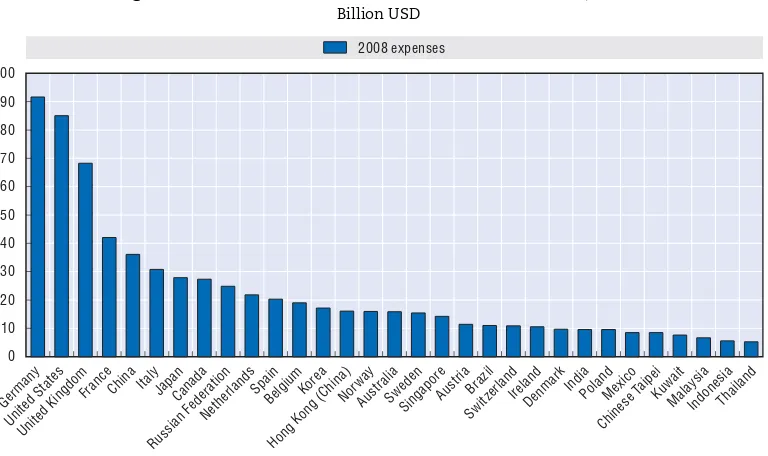
destination and a large origin area for international tourists. In a list of countries ranked by descending order of international tourism expenditures, only six of the top-spending 25 countries or territories do not belong to the OECD (Figure 1.4): China, the Russian Federation, Hong Kong (China), Singapore, Brazil and India. The four biggest countries of origin are OECD countries: Germany, the United States, the United Kingdom, and France. These four alone account for around 43% of the 25 countries’ expenditures.
With respect to receipts from international tourism, the same countries figure with a slightly different ranking (Figure 1.5). Germany, for example, is in sixth place, while Spain moved up to second place. Austria also advanced several notches. Turkey and Greece join the 25 countries receiving the most receipts. The first five places are occupied by OECD countries: the United States, Spain, France, Italy, and the United Kingdom, and together they represent 50% of receipts for the 25 countries.
1. TOURISM TRENDS IN THE OECD AREA AND BEYOND
OECD TOURISM TRENDS AND POLICIES 2010 © OECD 2010
30
The OECD balance of travel expenditures and receipts. Overall, the OECD area appears to
be in rough balance as regards international tourism, in the sense that its outbound tourism expenditures are roughly equivalent to its inbound tourism receipts. The difference between expenditures and receipts can be considered (if statistical discrepancies are not taken into account) as the balance of extra-OECD tourism, it has been less than 0.1% of the GDP for the
Figure 1.4. Main countries for outbound tourism, 2008
Billion USD
Sources: Balance of Payments (travel item), IMF, OECD data processing.
1 2 http://dx.doi.org/10.1787/764147180135
Figure 1.5. Main countries for inbound tourism 2008
Billion USD
1. 2007 data.
Sources: Balance of Payments (travel item), IMF, OECD data processing.
1 2 http://dx.doi.org/10.1787/764164064234 100 90 80 70 60 50 40 30 20 10 0 Germany Uni ted Stat es Uni ted King dom Fran ce Chin a Ital y
Japan Cana
da Rus sian Feder ation Ne ther
lands Spai
n Bel gium Kor ea Hon g Kon
g (Chin
a) No rway Aus tralia Sw eden Sing apor e Aus tria Braz il Swit zerla nd Irel and Den mar k Indi a
PolandMexi
co
Chin
ese T
aipei Kuw ait Mala ysia Indo nesi a Thai land 2008 expenses 160 140 120 100 80 60 40 20 0 Germany Uni ted Stat es Uni ted King dom Fran ce Chin a Ital y Czec h Re
publ ic Japan Mala ysia Rus sian Feder ation Ne ther lands Sp ain Bel gium
Greece Kor
ea
Hon g Kon
g (Chin a) Swit zerla nd Maca o1 Aus tralia Sw eden Sing apor e Aus tria Mo rocco Eg ypt Ca nada Croatia Poland Portug
al Mexi co Turk ey So uth Afric
1. TOURISM TRENDS IN THE OECD AREA AND BEYOND
OECD TOURISM TRENDS AND POLICIES 2010 © OECD 2010 31
whole period surveyed. In 2008, receipts amounted to USD 631 billion or around 67% of world tourism receipts.3 This was well below the figures for the early 1990s, when OECD receipts accounted for about 80% of the total. On the expenditure side, the figure was USD 594 billion in 2008. The statistical gap between total world receipts and total world expenditures shows a tendency to overestimate receipts vis-à-vis expenditures, and suggests that the apparent OECD surplus of receipts over expenditures is in fact a deficit.
This situation holds true for tourism in the OECD area as a whole. For individual countries, receipts and expenditures are generally much more skewed. As a general rule, the northern countries have been net senders while the southern countries tend to be net receivers, a pattern that has been very stable over the period of study (Table 1.7). More specifically, three situations can be distinguished:
● Countries in balance: this category applies to countries where the net tourism balance falls between –1 and +1 percentage points of GDP.
● Net receiving countries: their revenues from non-resident visitors exceed by a wide margin the expenditures that their residents make when travelling abroad.
● Net sending countries: their residents’ expenditures abroad exceed by a wide margin the receipts derived from non-resident visitors.
Every country’s classification in the above breakdown has remained fairly stable since the 1990s. The countries that are clearly net receivers are Greece, Portugal, Spain, Turkey, Austria, New Zealand, the Czech Republic and Hungary. These countries were already in this category in 1995. Greece and Spain, two countries with strongly growing inbound tourism, demonstrated differing trends for outbound tourism, which has developed much more quickly in Spain than in Greece. The countries that are clearly net senders include Iceland, Norway, Korea, Belgium, Germany, the United Kingdom and Ireland. Only the latter two co