ISSN 0971–765X
Preferences for settlement improvement in urban
Riparian Indonesia
Maya Fitri1,2, Sugeng Triyadi2 and Ismet B Harun2
1Department of Architecture, Universitas Sriwijaya, Indonesia
2School of Architecture, Planning and Policy Development, Institut Teknologi Bandung, Indonesia
(Recieved 7 November, 2017; accepted 30 December, 2017)
ABSTRACT
Riparian is a wetland along a river bank. Many cities in Indonesia arise along the riparian. Riparian provides food and water resources, natural air and lighting, and sanitation needs, besides the important function as ecosystem ser-vices. Riparian is an area for purification, absorption, and reservoir of water. However, due to rapid city develop-ment has caused many urban riparians turn into developed areas. Since the riparian is covered by buildings, the abil-ity in providing the ecosystem services is disturbed. So, it needs the settlement improvements with conserving the riparian ecosystem services. The study focuses on resident’s preferences for the settlement improvements. It used the stated preference method. The 155 respondents who live in the settlement along the Musi riverbank in Palem-bang, Indonesia were required to rank the several settlement profiles. Each profile was composed on the five of the physical development attributes that influence the riparian ecosystem services. The results showed that attribute of the house get enormous attention from the residents, while the environment attributes almost were not got any atten-tion. Thus, the planning can be optimized the building attribute to the residents’ criteria and the environmental at-tributes to the conservation to ecosystem services criteria. It is the valuable information for a planning in urban ri-parian.
Key words: Settlement preference, Wetland Conservation, and Urban riparian
Introduction
Indonesia is an archipelagic country which most of the cities were built along the water side. Most of the cities have wetlands as the largest ecosystem. In these cities, the wetlands use for development areas. It is inevitable. The settlements on Palembang had evolved along the riparian of the city. Living in wetlands is indeed a ma-jor part of the city history and current status. Like all the city that are dominated by wetlands, In Palembang the water living cultures have been growing for a long time (Shannon, 2013).
Riparian is wetlands along the river banks. It is the concourse place between the dry land and the river. The riparian position is very important as a buffer for the both ecosystems, so that the planning of the area, shape, and function need special attention. The riparian eco-system is very dynamic and complex (Mitsch and Gosselink, 2015). The presence of wetlands on an urban area provides aesthetical and recreational benefits of a natural landscape. It also provides very essential func-tions of the ecosystem services, such as controlling the water quality (Newbold et al., 2010), reducing the threat of flooding (Tockner et al., 2009) and
maintaining the diversity of an aquatic habitat (Lennox et al. 2009). Ecological view has realized the im-portance of the wetlands ecosystem services. An aban-donment of a natural riparian causes the environmental disasters, such as: flood, lack of water resources, and loss of natural habitats (Everard and Moggridge, 2012). There is a conflict between the need of development areas and the wetland ecosystem conservation. The planning in riparian needs to be maintain the balancing between ecological conservation and development pur-poses.
The study focuses on the planning of improvements settlement in urban riparian to restore the ecosystem services. Later there are new awareness on the planning in urban wetlands that are very concerned to an ecolog-ical view but less social understanding (Pahl-Wostl, 2006). Without understanding the social aspect, the planning would be less efficient. The implementation would face a disapproval or even denied by public. This study addresses for the planning in riparian areas with resident’s preferences. The understanding of the resi-dent’s preferences could be used as input to city plan-ning to ensure a public approval.
The public approval for planning in riparian is al-ready examined by several papers (Shandas, 2007). The research revealed several obstacles of property owners to a riparian conservation program. Meanwhile, the preference study on restoration of a river shows river restoration cannot succeed without understanding atti-tudes, comprehension of preference, and estimation of values in river network (Che et al., 2014). Several stud-ies estimate value of the presence of wetlands to the property price. The distance, size, and type of wetlands affect the value of residential property. The increasing size of wet lands will increase residence value (Mahan et al., 2000). The proximity to the natural landscape wetlands as water bodies has impact on house demand and positively impact sale prices (Cho et al., 2006). The reducing the wetland distance will increase the property price (Tapsuwan et al. 2009).
Our research is in the riparian areas along Musi Riv-er, Palembang. The local communities have been long living in the riparian. The settlements in riparian have become part of the city’s history. The local communi-ties live in riparian by adapting the ecosystem. Palem-bang is one of Indonesia’s metropolitan cities that has experienced rapid population growth, included along Musi riparian. Population growth has exceeded the ca-pacity of riparian ecosystems.
Settlements have been spreading and covering al-most all the natural riparian. It decreases the performance of riparian ecosystem services. This study estimates com-munity approvals for the various alternatives of the settlement improvements to restore the riparian ecosys-tem.
Materials and Methods
The planning for more ecological settlements have a greater chance for a successful implementation if plan-ners understand how various development at-tributes might affect to behavioural intentions of individual who living there. Although there are several approaches for understanding behavioural intentions, we focus on a stated preference choice model. Stated preference is commonly used in marketing to assure the market trends. The stated preference model also is also used in environmental studies. It provides a robust method for understanding the multi-attribute nature of the problem and the trade-offs between several interactive variables in value changes of the natural resources and environ-ment.
This paper used the conjoint analysis for stated pref-erence research. Conjoint analysis has been used in several studies in environmental research (Alriksson and Öberg, 2008). It is a method to find out how buyers trade-off among products. The con-joint analysis takes care of situations in which an individual decides an option by considering several combinations simultane-ously. The combinations are arranged varies of two or more attributes. The combinations of attributes present-ed in the form of product alternatives. Individual faces decision-making concerns about some possibilities for the best alternative product (Green et al., 2001). An environment has some characteristics that can be di-vides as attributes for stimulus effects, cognitions, and behaviours of an individual (Molin et al., 2001).
Attributes and levels
In this study, the settlement was divided into five at-tributes, i.e. house type, width of buffer area, riverside construction, riverside access, and riverside open space. Description are shown in Table 1.
The house type criteria are related to land covers, water flows, and absorption capabilities of the riparian. Building mass of the house type influence on land co-vers. The construction with less land covers would be better for an ecosystem restoration. The house type also is related to building foundations. Living in a riparian is faced with the risk of flooding. The risk can be sup-pressed by adapt to the ecosystem, either by properly modify the type of construction, or by estimate the safe distance from river edge (Watson and Adams, 2011). The building construction in riparian should use foun-dations such as stilts or floating which allow the tidal river to flow naturally and allow daylight into bottom of the building. The last criteria of house type related to the architectural style for raising public awareness re-garding the local architecture. All the criteria produced three of house types:” floating house”, “stilt row house”, or “apartment”.
The second attribute regarded on width of buffer ar-ea. A buffer area provides natural spaces on a riverside to absorb pollutions, purify, and store water reserves for re-processing for urban water needs (Groffman et al., 2003). The buffer area also provides a safe distance to reduce the flooding risk of housing on riverside. This estimation of the optimal size of the buffer area was
used for a balance purpose between ecosystem restora-tion and communal amenities.
The third attribute was riverside construction with three levels of the attribute: “natural”,” polder”, and “waterfront platform”. All three constructions remain riparian in naturally flows and tidal. The natural is an option for no hard construction a long river edge. The polder is a barrier that separates the settlements and the river for protection the settlements from flood. While, the waterfront platform is an elevated platform along river edge for bordering of the settlements. It is built above stilt foundations for making no blockage of natu-ral tidal. In addition, the construction of water front platform is unobstructed river views.
The fourth attribute was riverside access. It was de-fined by two levels: “dock boat” and “promenade”. Riparian can be accessed from land or water. To revital-ize the water access, it need to be facilitated by dock boats. It would become a unique character of a riverside settlement. Besides form the water, riparian also can be accessed from the land. The well-designed promenades, bicycle paths, lanes, and squares can revitalize the riv-erside area (Platt 2006).
The last attribute was” riversideopen space”. The ri-parian area has a potential open space that can be used for community activities or ecological conservation purposes (Crow et al., 2006). For the community activi-ties, public open space at riverside could create an in-teractive water-based city accommodating economic,
Table 1. List of attributes and its levels
Attributes Description of preference effect Level attributes
House type To land covers, water flows, and absorption 1. Floating house capabilities of riparian 2. Stilt row house
3. Apartment Width of buffer area To river side free-building area and the 1. 0-10 m
convenient distance for the daily activities 2. 10-20 m 3. 20-30 m 4. >30
Riverside Construction To flood exposure and views of the river 1. Natural 2. Polder
3. Waterfront plat form
Riverside Access To the access facility for revitalization 1. Dock boat
of the riverside area 2. Promenade
Riverside open space to performance of the ecosystem service or 1. Open green natural the communities’ daily activities 2. Riparian park
culture, and aesthetic purposes. Otherwise for the eco-system restoration, open space is used for maintaining good water qualities, providing habitats for wildlife, protecting people and buildings from flood, or extend-ing reservoir of eco-system services. For that reason, the attribute of riverside open space was divided into: “open green area”,” riparian park”, and “playground”.
Questionnaire Design
These five attributes were used in this study; each at-tribute was assigned two-four levels (Table 1). With five attributes and fifteen levels, the total factorial de-sign gave 216 (=3x3x3x2x4) alternative combinations. Full-factorial experiments generated data based on all possible combinations of attribute levels. This is im-practical for stated preference surveys because subjects’ cognitive and time limitations do not allow for consid-eration of a large number of profiles. To make the ap-proach feasible for respondents, we created an orthogo-nal fraction factorial experimental design. Orthogoorthogo-nali- Orthogonali-ty (the occurrences of any two levels of different attrib-utes are uncorrelated), and minimal overlap cases where at-tribute levels do not vary should be minimized (Molin 2011). This orthogonal fraction factorial exper-iment resulted in 16 alternative profiles.
The 155 surveyed respondents were limited to house owners within 250 meters from the river edge. They were adult males, especially couples who were eligible to make decisions about their house. The six-teen flash cards were shown to the respondents individually. Each card described the residential pro-file. Interviewers ex-plained the residential profile content one at a time and asked the respondent to rate the profile. Besides using text, visual graphics were also used to illustrate the concept of each pro-file. The respondents gave rating values between one to ten which were then translated into numerical preference indicators in continuous data. To ensure consistency, each respondent was asked to rank the attributes and explain the reason for their pref-erences for a particular residential attribute.
Results
A. Respondent’s Socio Demographic Characteristics
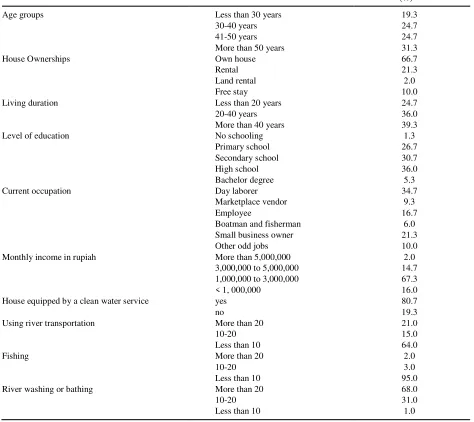
Table 2 presents survey data on the socioeconomic characteristics of the respondents. The largest number of the respondents were over 50 years old and
the least number of the respondents were under 30 years old. 24.7% of the respondents who were 30-40 years old were and 24.7% of the rest respondents who were the 41-50 years old. The analysis results of living duration showed that 39.3% of the respondents had already lived in more than 40 years, 36% for 20-40 years, whereas 24.7% were the new residents who had lived less than 20 years. Most respondents owned the house (66.7%), 21.3% rented a house, 2% rented a land, and 10% stayed free with an owner’s permission. The results imply most of the respondents are permanent education. The data regarding occupations showed that most of the respondents were day laborers who work on demand and are paid daily, with no promise of further work in the future. A small business owner such as tai-lor, mechanic or crafts man were the second dominant job. Only a small percent-age were a boat manor a fish-erman. The rest of the respondents worked as an em-ployee, while the others held odd jobs such as a pedicab river or a domestic helper. The monthly income levels reflected the socioeconomic marginalized of most re-spondents; their incomes were less than 3,000,000 rupi-ah per month. This is relative small when com-pared to the minimum salary of the lowest paying positions in
respondents do it in 10-20 days per month (Table 3). Although respondent’s houses have been served by urban water services, but most residents still depend on river to fill their household water needs. The results show that the river is still be the center of community daily activities. Living in riparian create the resident’s dependence on the river in providing cultural ecosystem services (Vollmer et al., 2015). The cultural services mean the nonmaterial benefits community obtain from river (MEA 2005).
B. Housing and Environmental Conditions of Re-spondents
In this study, we also observed the respondents’
hou-sing. The data collected consisted of general character-istic of respondent’s houses (Table 4) and house condi-tion related to flood (Table 5).
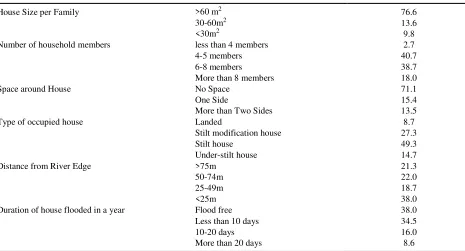
Table 4 shows that most respondent’s houses were more than sixty square meter house-size per family (76,6%). 13.6% of the respondents had a house with 30-60 m2 size and the rest respondents had house with size less than 30m2. However, more than half (38.7% and 18%) of the respondents live with more than 5 family members. The highest percentage of the respondents shared the house with 3-4 others family members (40.7%). The small percent-age of all respondents have 3 or less of the household members (2.7%). 71.1% of the respondent’s houses had no space around house.
Table 2. Socio Demographic Characteristics
(%)
Age groups Less than 30 years 19.3
30-40 years 24.7
41-50 years 24.7
More than 50 years 31.3
House Ownerships Own house 66.7
Rental 21.3
Land rental 2.0
Free stay 10.0
Living duration Less than 20 years 24.7
20-40 years 36.0
More than 40 years 39.3
Level of education No schooling 1.3
Primary school 26.7
Secondary school 30.7
High school 36.0
Bachelor degree 5.3
Current occupation Day laborer 34.7
Marketplace vendor 9.3
Employee 16.7
Boatman and fisherman 6.0
Small business owner 21.3
Other odd jobs 10.0
Monthly income in rupiah More than 5,000,000 2.0
3,000,000 to 5,000,000 14.7 1,000,000 to 3,000,000 67.3
< 1, 000,000 16.0
House equipped by a clean water service yes 80.7
no 19.3
Using river transportation More than 20 21.0
10-20 15.0
Less than 10 64.0
Fishing More than 20 2.0
10-20 3.0
Less than 10 95.0
River washing or bathing More than 20 68.0
10-20 31.0
No space around houses means that houses directly attached side by side. It indicates a poor quality of air flowing and lighting indoor. 15.4% of the respondent’s houses only had space in one side, except the front side. Only 13.5% of the houses had more than two sides of free spaces. These results indicate the high populated in dense settlement.
Almost all houses in the settlement were the stilt house type, and only 8.7% houses were the landed houses. Some of the stilt houses have been modified. The under of the stilt house was modified by covering it with a wall. This modification is looked like a two-story house. It is effective way to enlarge the interior house. However, the ground floor was vulnerable to flood with low ceiling height. 49.3% of the respondents occupied stilt houses, while 27.3%the respondents occupied stilt modification houses. The rest respondents rented under-stilt houses (14.7%). The under-under-stilt house usually was divided into several rental houses. The houses get risk of flood, stuffy, as well as lack of natural lighting and airflow. Most of the respondent houses (38%) were less than 25 m from the river bank. Being situated in a riverbank flood plain area, the farther a house is from the river’s edge, the safer it is from flooding. The hous-es with such distance are vulnerable to flood.
The 18.7% of the respondent’s houses were in 25-49 m. While, 18.7% and 21.3%of the respondent’s houses are located 50-74 m and more than 75 m from the river bank. It is enough distance to avoid flooding exposure. Only 38% houses have an ad-equate base elevation to avoid flood. Other houses were flooded in varying du-rations, less than 10 days by 34.5%, 10-20 days by 16%, and more than 20 days by 8.6%.
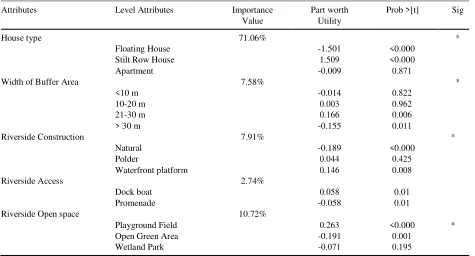
A. Resident’s Preferences
Table 4 shows the resident preference’s analysis results. Significant attention to attributes is indicated by *. The result shows that most respondents (71.06%) decide that “house type “was the most important attribute compared to all other attributes. Despite the attention to other attributes are significant, but the utility was much smaller. “Riverside open space “that was the second most important at-tribute only had 10.72 % importance value. “Width of buffer area” and “riverside construc-tion” received almost equal weight (7.91% and 7.58%). Whereas “riverside access” only got 2.74% of the re-spondent’s attention, it was not a significant attention.
Table 3. Respondent’s houses characteristics
(%)
House Size per Family >60 m2 76.6
30-60m2 13.6
<30m2 9.8
Number of household members less than 4 members 2.7
4-5 members 40.7
6-8 members 38.7
More than 8 members 18.0
Space around House No Space 71.1
One Side 15.4
More than Two Sides 13.5
Type of occupied house Landed 8.7
Stilt modification house 27.3
Stilt house 49.3
Under-stilt house 14.7
Distance from River Edge >75m 21.3
50-74m 22.0
25-49m 18.7
<25m 38.0
Duration of house flooded in a year Flood free 38.0
Less than 10 days 34.5
10-20 days 16.0
The house type was the enormous importance attrib-ute in the resident’s preferences. Structural characteris-tics, especially for housing preference of the low-income communities are often more influential than environmental facilities (Fierro et al., 2009); (Opoku and Abdul-Muhmin, 2010). This implies that planning would be easier to approve if the building in accordance with the preference. The ecosystem restoration could be optimized by modified the environmental factors.
“Stilt row house” was the definitive preferred house type, which had a utility in the highest positive point (1.509 utility points). On the other hand, “floating house” received the lowest negative score at -1.501, which means the residents strongly disliked it. While, the utility of “apartment” was nearly neutral utility points (-0,009). This significant preference for “row stilt house” is understandable because it is the conven-tional house type in the riparian area. Almost all resi-dents occupied this house type. The row stilt house ac-cordance with riparian ecosystems and community dai-ly activities. The construction is safe from flood with stability structures against river water tides. However, the row houses require more land for its building con-struction. It spreads covering of riparian surfaces. Ri-parian restoration requires more open space (Ahearn et al., 2005). To suppressed land covers in a dense popu-lated area, the high-rise building has more capacities in
every land cover area than the row house. However, most residents were uncommon to live in an apartment, so it needs modification to adapt with the living culture of the local community. On the Tan Hoa Lo Gom canal sanitation project in Ho Chi Minh City, the three-story apartment accommodated residents in rehabilitation project of the slum settlements in the wetland area. The design of the apartment was modified in considering local com-munity living culture. It was a successful modification to increase the public acceptance for an apartment (Shannon 2009).
The buffer in “21-30 m” from river edge (0.166) was the most preferred option. The attribute utility gradually increases from an option” <10 m” to “10-
20 m” andup to”21-30 m”, then it incrementally drops for width “> 30 m”. It means that the residents ap-proved a buffer width area only up to 30 m from river edge. It is the unexpected results because most of the resident’s houses were located in less than 25 m from the river edge. This option will backwards their houses from the current boundary. It indicates the resident’s need a wider buffer area to ensure free from flooding exposure. However, they also do not like the width of buffer area that is too far from the river edge. The very wide buffer area separates the river away from their daily activities. Thus, the planning can take the width
Table 4. Estimated Part-Worth Utility Preference of settlement improvement Attributes
Attributes Level Attributes Importance Part worth Prob >[t] Sig Value Utility
House type 71.06% *
Floating House -1.501 <0.000
Stilt Row House 1.509 <0.000
Apartment -0.009 0.871
Width of Buffer Area 7.58% *
<10 m -0.014 0.822
10-20 m 0.003 0.962
21-30 m 0.166 0.006
> 30 m -0.155 0.011
Riverside Construction 7.91% *
Natural -0.189 <0.000
Polder 0.044 0.425
Waterfront platform 0.146 0.008
Riverside Access 2.74%
Dock boat 0.058 0.01
Promenade -0.058 0.01
Riverside Open space 10.72%
Playground Field 0.263 <0.000 *
Open Green Area -0.191 0.001
of buffer area at around 30 m. It is enough size to con-serve an ecosystem service in urban riparian.
“Waterfront platform” is the highest utility (0.146 utility points) of riverside construction. Conversely, “natural” which is the least desirable option (-0.189 utility points). While, the polder construction be-comes the second attractiveness (0.044 utility points). Most of the populations in the settlement were vulnerable to flood. As expected, the natural is the least desirable option, but unexpectedly that the residents do not ap-prove to the polder. Even, polder protects settlements from flood, but it obstructs the views and interfere the access to the river. The waterfront platform was more preferred by the residents. Although, it is less effective to control flood, but the water front platform provides an openness view of the river without barrier of access to the river. This implies that attribute preference is more influenced by dependence on rivers than the risk of water-related hazards. The dependence on the river causes various physical obstacles to the river that will be a disruption on their daily activities would be an unapproved preference (Vollmer and Grêt-Regamey, 2013).
The result showed no significant utility for” riv er-side access”. This indicates the residents indifferent with how access to riparian or both options are equally desirable. Because no choice that really suit with resi-dent’s preferences, the settlement planning should im-prove both accesses. Besides optimizing the water transportations, the promenade also needs an improve-ment.
“Playground” was very attractive riverside open space. It has the highest utility at 0.263. The two others level attributes had negative utilities. Residents dislike the options, both “open green area”and “wetland park”. The utility for “open green area” was -0.191 and for wetland park was -0.071. The settlement was very dense with the buildings so that almost no open space can be used for the communal activities. Residents pre-fer open spaces that give directly function as to ac-commodate the community activities rather than indi-rect values such as for eco-system services. The well-cared wetland landscape perceived as more attractive place to enjoy nature. The local culture and natural landscape context are the attractive of site characteris-tics (Nassauer, 2004).
Discussion and Conclusion
Urban planning for improvement of the environment often brings out the social aspects. All the ecological process must be a part of the everyday life which is influenced by people (Glaeser and Glaser 2010). Plan-ning leading to ecological design with an interface be-tween measurable biophysical attributes and the sur-rounding social context. It needs an understanding of the interaction of people and urban river landscape (Prescott and Ninsalam 2016).
Densely populated settlements sprang up unplanned along the riparian bringing down the ecosystem vitality. The improvement of settlements aims to improve the riparian ecosystem services through the more ecological planning. The improvement aims to reduce land cover and reopen along the riverbank. The result of residential attributes preference indicates that the community con-siders the presence of the river as the key factor on the settlement planning. The residents do not prefer an al-ternative settlement planning for eliminating the river tidal dynamics or threats of flood. Preferences are more influenced by the convenience of activities related to dependence on river banks. The research finding demonstrates that the residents has dependence to the river. The residents still use the ecosystem services that should be integrated into planning when rehabilitating the ecology (Grêt-Regamey et al. 2016).
The building components should be plan in focused to meet expectations of the residents. In contrast, envi-ronmental components, especially buffer area. can be focused on optimizing the conservation of ecosystem services. So, the ecological and the social interests can be integrated into a development plan. So, the planners can balance the ecological conservation and the human preferences on planning the urban riparian.
References
Ahearn, D. S., Sheibley, R.W., Dahlgren, R.A., Anderson, M., Johnson, J. and Tate, K.W. 2005. Land Use and Land Cover Influence on Water Quality in the Last Free-Flowing River Draining the Western Sierra Nevada, California. Journal of Hydrology. 313(3) : 234– 247. Alriksson, S. and Öberg, T. 2008. Conjoint Analysis for
En-vironmental Evaluation: A Review of Methods and Applications. Environmental Science and Pollution Re-search International. 15(3) : 244–257
Carmon, N. and Shamir, U. 2010. Water-Sensitive Planning: Integrating Water Considerations into Urban and Re-gional Planning. Water and Environment Journal. 24 (3) : 181–191.
Che, Y., Li, W., Shang, Z., Liu, C. and Yang, K. 2014. Resi-dential Preferences for River Network Improvement: An Exploration of Choice Experiments in Zhujiajiao, Shang-hai, China. Environmental Management. 54(3) : 517–530. Cho, S. H., Bowker, J. M. and Park, W.M. 2006. Measuring The Contribution of Water and Green Space Amenities to Housing Values. An Application and Comparison of Spa-tially Weighted Hedonic Models. 485- 507.
Crow, T., Brown, T. and De Young, R. 2006. The Riverside and Berwyn Experience: Contrasts in Landscape Struc-ture, Perceptions of the Urban Landscape, and Their Ef-fects on People. Landscape and Urban Planning. 75(3) : 282–299.
Everard, M. and Moggridge, H.L. 2012. Rediscovering The Value of Urban Rivers: 293–314. Urban Ecosystems 15(2)
Fierro, K.P., Fullerton, T.M. and Donjuan-Callejo, K.E. 2009. Housing Attribute Preferences in A Northern Mexico Metropolitan Economy. Atlantic Economic Journal. 37(2) : 159–172.
Glaeser, B. and Glaser, M. 2010. Global Change and Coastal Threats: The Indonesian Case. An Attempt in Multi-Level Social-Ecological Research. Human Ecology Review. 17(2) : 135-147.
Green, P. E., Krieger, A. M. and Wind, Y. 2001. Thirty Years of Conjoint Analysis: Reflections and Prospects: S56– S73. Interfaces 31(3_supplement)
Green, P. E. and Srinivasan, V. 1990. Conjoint Analysis in Marketing: New Developments with Implications for Research and Practice : 3–1. The Journal of Market-ing9.
Grêt-Regamey, A., Weibel, B., Vollmer, D., Burlando, P. and Girot, C. 2016. River Rehabilitation as An Oppor-tunity for Ecological Landscape Design:142–146. Sus-tainable Cities and Society 20.
Groffman, P. M., Bain, D. J., Band, L. E., Belt, K. T., Brush, G. S., Grove, J. M., Pouyat, R. V., Yesilonis, I. C. and Zipperer, W.C. 2003. Down by the Riverside: Urban Riparian Ecology. Frontiers in Ecology and the Environment. 1(6) : 315–321.
KArrasch, L., Klenke, T. and Woltjer, J. 2014. Linking The Ecosystem Services Approach to Social Preferences and Needs In Integrated Coastal Land Use Manage-ment–A Planning Approach. Land Use Policy. 38 : 522–532.
Lennox, M. S., Lewis, D. J., Jackson, R. D., Harper, J., Larson, S. and Tate, K. W. 2009. Development of Veg-etation and Aquatic Habitat in Restored Riparian Sites of California’s North Coast Rangelands. Restoration Ecology. 19(2) : 225–233.
Mahan, B. L., Polasky, S. and Adams, R. M. 2000. Valuing Urban Wetlands: A Property Price Approach:100–113. Land economics
MEA, editor. 2005. Ecosystems and Human Well-Being: Wet-lands and Water Synthesis: A Report of the Mil-lennium Ecosystem Assessment. World Resources Insti-tute, Washington, DC
Mitsch, W. J., and J. G. Gosselink. 2015. Wetlands. Fifth edi-tion. John Wiley and Sons, Inc, Hoboken, NJ Molin, E. J. 2011. Conjoint Analysis. Pages 127–155 in S.
J. T. Jansen, H. C. C. H. Coolen, and Goetgeluk, R.W. editors. The Measurement and Analysis of Housing Preference and Choice. Springer Nether-lands, Dordrecht
Molin, E. J., Oppewal, H. and Timmermans, H.J. 2001. Analyzing Heterogeneity in Conjoint Estimates of Residential Preferences. Journal of Housing and the Built Environment 16(3) : 267–284.
Nassauer, J. I. 2004. Monitoring the Success of Metropoli-tan Wetland Restorations: Cultural Sus-tainability and Ecological Function. Wetlands. 24(4):756–765.
Nassauer, J. I., Kosek, S.E. and Corry, R.C. 2001. Meeting Public Expectations with Ecological Innova-tion in Riparian Landscapes. Journal of the American Water Resources Association. 37(6) : 1439–1443. Newbold, J. D., Herbert, S., Sweeney, B. W., Kiry, P. and
Alberts, S.J. 2010. Water Quality Functions of A 15-Year-Old Riparian Forest Buffer System. Journal of The American Water Resources Association. 46(2). Opoku, R.A. and Abdul-Muhmin, A.G. 2010. Housing
Pahl-Wostl, C. 2006. The Importance of Social Learning in Restoring The Multifunctionality of Rivers and Flood-plains. Ecology and society 11(1)
Platt, R. 2006. Urban Watershed Management: Sustainability, One Stream at Time. Environment 48(4) : 26–43. Prescott, M. F., and Y. Ninsalam. 2016. The Synthesis of
Environmental and Socio-Cultural Information in The Ecological Design of Urban Riverine Land-scapes. Sustainable Cities and Society. 20 : 222–236.
Shandas, V. 2007. An Empirical Study of Streamside Land-owners’ Interest in Riparian Conservation. American Planning Association. Journal of the American Plan-ning Association. 73(2) : 173–185.
Shannon, K. editor. 2009. Water Urbanism: Hydrological In-frastructure as An Urban Frame in Vietnam. Pages 55– 59. Water and Urban Development Paradigms: To-wards an Integration of Engineering, Design and Man-agement Approaches: Proceedings of The International Urban Water Conference, Heverlee, Bel-gium, 15-19 September 2008. CRC Press, Boca Raton, Fla
Shannon, K. 2013. Eco-engineering for Water: From Soft to Hard and Back. In S. T. A. Pickett, M. L. Cadenasso, and B. McGrath, editors. Resilience in Ecology and Ur-ban Design. Springer Netherlands, Dordrecht. 163–182
Tapsuwan, S., Ingram, G., Burton, M. and Brennan, D. 2009. Capitalized Amenity Value of Urban Wetlands: A Hedonic Property Price Approach to Urban Wet-lands in Perth, Western Australia. The Australian Jour-nal of Agricultural and Resource Economics. 53 : 527– 545.
Tockner, K., Pusch, M., Borchardt, D. and Lorang, M. S. 2009. Multiple Stressors in Coupled River–Floodplain Ecosystems. Freshwater Biology. 55(1) : 135–151. Vollmer, D., and Grêt-Regamey, A. 2013. Rivers as
Mu-nicipal Infrastructure: Demand for Environmental Ser-vices in Informal Settlements Along an Indonesian River. Global Environmental Change. 23(6) : 1542– 1555.
Vollmer, D., Prescott, M. F., Padawangi, R., Girot, C. and Grêt-Regamey, A. 2015. Understanding the Value of Urban Riparian Corridors: Considerations in Plan-ning for Cultural Services along An Indonesian River. Land-scape and Urban Planning. 138 : 144–154.