Triggering and dynamic evolution of the LUSI mud volcano, Indonesia
A. Mazzini
a,⁎
, H. Svensen
a, G.G. Akhmanov
b, G. Aloisi
c, S. Planke
a,d,
A. Malthe-Sørenssen
a, B. Istadi
ea
Physics of Geological Processes, University of Oslo, Box 1048, 0316 Oslo, Norway b
Moscow State University, Faculty of Geology, Vorobjevy Gory, Moscow, 119992, Russia c
Laboratoire de Paléoenvironnements et Paléobiosphère, Université Claude-Bernard UMR 5125 CNRS, 2, rue Dubois, 69622 Villeurbanne cedex, France
d
Volcanic Basin Petroleum Research, Oslo Research Park, 0349 Oslo, Norway e
EMP Brantas, Lapindo Brantas Inc., JI. Jend. Gatot Subroto 42, 12710, Jakarta Indonesia
Received 20 March 2007; received in revised form 12 June 2007; accepted 3 July 2007
Editor: H. Elderfield Available online 12 July 2007
Abstract
Mud volcanoes are geologically important manifestations of vertical fluid flow and mud eruption in sedimentary basins worldwide. Their formation is predominantly ascribed to release of overpressure from clay- and organic-rich sediments, leading to impressive build-up of mud mountains in submarine and subaerial settings. Here we report on a newly born mud volcano appearing close to an active magmatic complex in a backarc sedimentary basin in Indonesia. The location of the mud volcano close to magmatic volcanoes results in a high background temperature gradient that triggers mineralogical transformations and geochemical reactions at shallow depth. The eruption of 100 °C mud and gas that started the 29th of May 2006 flooded a large area within the Sidoarjo village in Northeast Java. Thousands of people have so far been evacuated due to the mud flood hazards from the eruption. Since the initial eruption, the flow rate escalated from 5000 to 120,000 m3/d during the first eleven weeks. Then the erupted volume started to pulsate between almost zero and
120,000 m3/d in the period August 14 to September 10, whereas it increased dramatically following swarms of earthquakes in September, before reaching almost 180,000 m3/d in December 2006. Sampling and observations were completed during two fieldwork campaigns on the site. The eruption of boiling water is accompanied by mud, aqueous vapour, CO2and CH4. Based on geochemical and field results,
we propose a mechanism where the eruptions started following the 27th of May earthquake due to fracturing and accompanied depressurization ofN100 °C pore fluids fromN1700 m depth. This resulted in the formation of a quasi-hydrothermal system with a geyser-like surface expression and with an activity influenced by the regional seismicity.
© 2007 Elsevier B.V. All rights reserved.
Keywords:Java-Indonesia; mud volcanism; LUSI; seismicity; quasi-hydrothermal
1. Introduction
An unexpected eruption of mud and fluids took place the 29th of May 2006, ~ 200 m away from a 2833 m
deep hydrocarbon exploration well (BJP1) in the Porong area, Sidoarjo, East Java (Fig. 1). The eruption site was named LUSI (Lumpur “mud”-Sidoarjo), and the area covered by the mud flows reached more than 6.3 km2in May 2007. Approximately 8800 families (∼ 30,000
people) have been displaced despite the network of dams continuously built to contain the mud.
www.elsevier.com/locate/epsl
⁎ Corresponding author.
E-mail address:[email protected](A. Mazzini).
LUSI represents a unique opportunity to study the birth and evolution of a mud volcano, as most studies are conducted during the dormant periods between eruptions of already existing structures. Mud volcano eruptions normally last for only a few days, and very little is known about their eruption dynamics (Jakubov et al., 1971). The common observation in most mud volcanoes is that the temperature of the erupted mud is cooler than the temperature in the source region, which typically would be b 75 °C although few have been extensively monitored (Mukhtarov et al., 2003). In both respects, the LUSI mud eruption is an intriguing exception, as one year after its appearance it was still active and erupting boiling water and mud. This paper presents the data collected during two field studies integrated with a database acquired before and during the drilling of the BJP1 exploration well located 200 m away from the mud volcano. Our aim is to describe the eruption dynamics of LUSI and to identify the possible causes of the sudden eruption.
2. Methods
Two field studies were conducted at the LUSI eruption site in September 2006 and February 2007.
Geochemical analyses were completed on gas, water and mud samples collected from within and around the LUSI eruption site.
Estimates of eruption volumes and fluxes are semi-quantitative and were done based on visual daily observations on catchment areas covered by a certain thickness of mud.
Six monitoring surveys controlling the subsidence in the Sidoarjo area have been conducted since the beginning of the LUSI eruption. Approximately 20 GPS stations have been used.
Gas composition during various stages was analysed on site using hand-held instruments for CH4and H2S.
Methane was analysed relative to the lower explosive limit (LEL) in air where 20% LEL corresponds to 10000 ppm. Gases were vacuumed using syringes from the eruption clouds on the edge of the crater in September 2006 and stored in glass bottles sealed with brine. Gas composition was analysed with a Hewlett Packard 5890 Series II GC equipped with Porabond Q column, a flame ionisation detector (FID), a thermal conductivity detector (TCD) and a methylization unit. Hydrocarbons were measured by FID, CO2by
methy-lization (to CH4) and then FID and N2and O2by TCD.
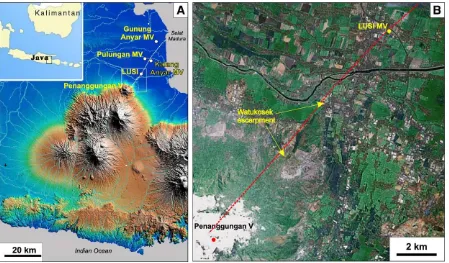
The carbon isotopic composition of the hydrocarbon gas Fig. 1. (A) Fragment of elevation map of Java. The volcanic arc is located in the southern part of the island. The backarc basin, where LUSI is erupting, is in the northern part. A fault extends from the Penanggungan volcano towards NE; (B) details of area around LUSI (framed in image A), showing the river bend, the Watukosek escarpment and the Penanggungan volcano crossed by NE–SW oriented fault (red dashed line). Satellite photo from Google Earth.
components was determined by a GC-C-IRMS system. Repeated analyses of standards indicate that the reproducibility of δ13C values is better than 1‰ PDB (2 sigma). The hydrogen isotopic composition of methane was determined by a GC-C-IRMS system. The international standard NGS-2 and an in-house standard were used for testing accuracy and precision. The value of NGS-2 is reported as−172.5‰V-SMOW.
Repeated analyses of standards indicate that the reproducibility of δD values is better than 10‰ PDB (2 sigma). All isotope analyses were performed at the Institute for Energy Technology, Kjeller, Norway.
Cations were analysed using a Dionex ion chromato-graph and anions were analysed on a Varian Vista ICP-MS. The waterδ18O composition was measured using a using a Finnigan DeltaXP isotope mass spectrometer. Average value for GISP from IAEA during 2003–2004 is δ18OVSMOW=− 24.80 ± 0.10‰ (one standard devia-tion). The δD composition was determined by a Micromass Optima isotope mass spectrometer. Average value for GISP from IAEA during 2003–2004 is δ
D-VSMOW=− 189.71 ± 0.89‰ (one standard deviation).
“True”value is−189.73 ± 0.9‰.
Clay mineral composition was analysed on three samples of erupted mud and thirteen samples of claystone from sidewall cores from the BJP1 well in the 1109–1828 m interval. Oriented clay (b 1 μm) samples were measured using Cu-based radiation and standard XDR laboratory methods.
Vitrinite reflectivity measurements on the dispersed organic matter in the erupted mud and mudstone all along the borehole were conducted at the Lemigas in Indonesia. The measurements were made on acid treated and oil submersed samples using a reflective light microscope, and reported as % Ro relative to standards. Accuracy of the measurements is typically of the order 0.05% Ro.
Biostratigraphic observations were done comparing foraminifera and nannofossils assemblages from the erupted mud with cuttings and side well cores from the BJP1 well.
3. Geological setting and stratigraphy
The Island of Java, like the majority of the Indonesian arc islands, results from active oceanic-plate subduction. The southern part of the island comprises the mainly submerged accretionary prism and the volcanic arc. The northern part of East Java forms the backarc basin with its extensional regime and high sedimentation rate ( Will-umsen and Schiller, 1994; Schiller et al., 1994). LUSI is situated in the backarc area 10 km NE from the
Penanggungan volcano. Regional seismic profiles and field observations suggests the presence of a regional fault through the LUSI area although it is partly buried by alluvial sediments (Fig. 1). Several dormant mud volcanoes are located near LUSI. Three of them are shown in Fig. 1, but both their eruption histories and possible recent activity are not documented unlike others observed in Timor (Barber et al., 1986).
The stratigraphy at the Sidoarjo locality (Fig. 2) consists of (top-down) 1) alluvial sediments; 2) Pleistocene alternating sandstone and shale of the Pucangan Formation, (up to 900 m depth), 3) Pleisto-cene bluish gray clay of the Upper Kalibeng Formation, to 1871 m depth and 4) volcaniclastic sand at least 962 m thick. The Porong#1 well that was drilled 6.5 km NE from Sidoarjo showed that Plio-Pleistocene (?) sediments directly overlay the top of the Miocene coralline limestone. Strontium isotopes indicate an absolute age of the limestone of approximately 16 Ma.
Kusumastuti et al. (2002)ascribe this limestone to the Kujung Formation. BJP1 drilled the lower part of the turbidite sand formation, but, in contrast with previous assumptions (Davies et al., 2007), well logging measurements show no direct evidence that the Kujung Formation has been intersected in the borehole (Fig. 2). The deepest cuttings did not reveal the presence of any carbonate, and calcimetry data indicate only 4% calcite with no significant increase or changes. The drilled Pleistocene claystones (∼ 600–1830 m) were rapidly
deposited (Willumsen and Schiller, 1994), explaining the observed undercompacted and overpressured sequences particularly in the shale unit between 1323– 1871 m. Comparable geological conditions have resulted in wide spread mud volcanism in settings like the Caspian Basin and in the Black Sea (e.g.Jakubov et al., 1971; Ivanov et al., 1996; Planke et al., 2004).
4. Survey data and results
4.1. Eruption history and dynamics
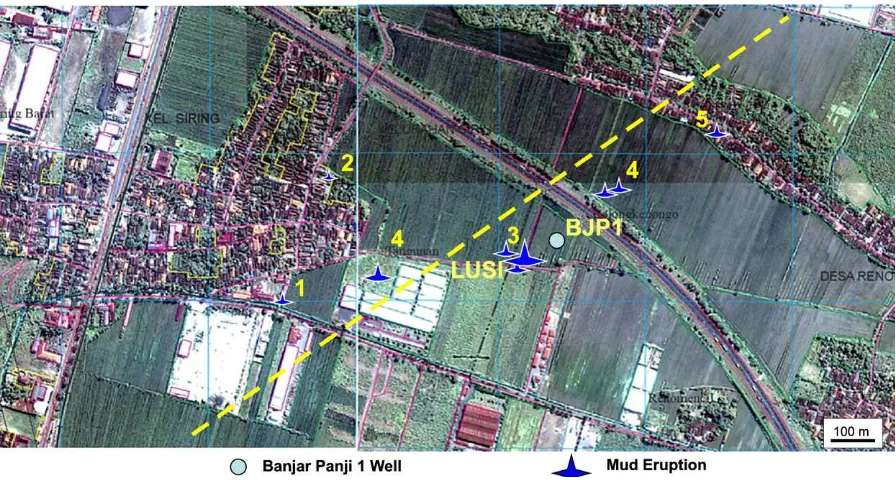
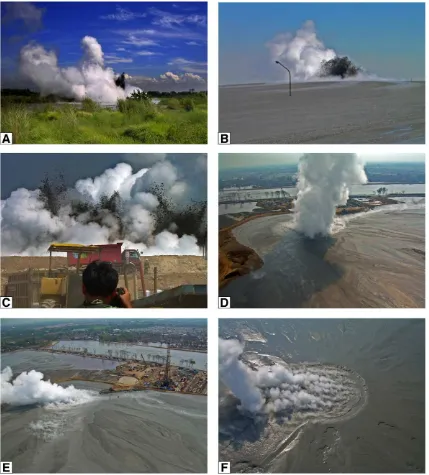
Scattered small surface water leakages (seeps) were detected in the early morning of the 29th of May 2006, which evolved to become the LUSI eruption within the next few hours. Here, boiling mud containing ∼60%
operating BJP1 exploration well (Fig. 3(C)–(D)). The spatial pattern of the fracture and the new eruption sites developed towards the NE coinciding with a NE–SW fault crossing the area (Figs. 4 and 1). The presence of this fault is inferred from regional seismic interpretations and from field observations (Fig. 3(F)), and extends from the Arjuno–Welirang volcanic complex all the way to the north-eastern coast (Fig. 1(A)–(B)). The new sandy eruption sites inFig. 3(B) were buried during the second week of June by the large amount of mud erupted from the main crater (Fig. 3). New small eruption sites appeared in November 2006∼ 1 km to the SW of the
main crater. These observations indicate that the plumbing system in the subsurface was continuously evolving. The volumes of erupted mud increased from
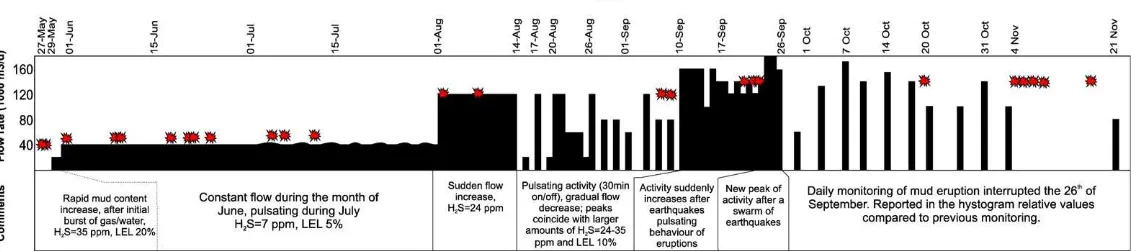
the initial 5000 m3/d in the early stage to 120,000 m3/d in August 2006 (Fig. 5). Peaks of 160,000 and 170,000 m3/ d of erupted material follow earthquakes swarms during September 2006 (Fig. 5). In December 2006 the flux reached the record-high level of 180,000 m3/d. LUSI was still active in June 2007 expelling more than 110,000 m3/d and 44 isolated seepages have been mapped around the mud covered area.
The subsidence around the LUSI area has been monitored since the early stages of the eruption. The data collected reveal that a ∼22 km2area subsides in
average from 1–4 cm/d. The formation of a caldera and collapse structures around an eruption site is a typical phenomenon related to mud volcano craters (e.g. Cita et al., 1996; Planke et al., 2004). Interestingly, around Fig. 2. Stratigraphy column and temperature-pressure gradient in BJP1 well. Note that based on the data available there is no evidence that the deepermost limestone formation was penetrated in the BJP1 well. The sedimentary regressive sequence consists of clayey and sandy sediments. Overpressured units logged during the drilling are present in the intervals 762–914, 1323–1457, 1579–1594, 1670–1740, 1822–1871 m.T= 100 °C is reached at ~ 1700 m. Vitrinite reflectance values measured from erupted mud-clasts correspond to values obtained below 1700 m in the borehole (symbol Vit.). A hiatus of approximately 14.4 Ma separates the deepermost sandy unit from the underlying Miocene carbonate facies (Kujung Formation?).* Estimated pore pressure is based on drilling measurements (dc exponent). Estimated Bottom Hole pore pressure is 12.8 ppg based on ‘Fill upTvolume after the loss circulation.
LUSI the subsiding area has the shape of an ellipsoid (axis 7 × 4 km) elongated along the SW–NE fault orientation.
4.2. Temperature readings and gradient
Temperatures measured from a mud flow within 20 m of the LUSI crater revealed values as high as 97 °C (February 2007). The temperature of the crater could not be measured directly, but likely reached 100 °C, accounting for the boiling water and the steam erupted. The high temperature of the erupted fluids is mirrored by a high temperature gradient in the BJB1 borehole. Down-hole measurements show that 100 °C is reached at a depth of 1700 m and 138 °C at 2667 m. This demonstrates an unusually high geothermal gradient (42 °C/km) that is possibly related to the proximity of the volcanic arc (Fig. 2).
4.3. Composition of the erupted gas and water
Since the beginning of the eruption the bulk of the erupted gas was composed of aqueous vapour. Besides aqueous vapour, measurements conducted with hand-held instruments during the initial burst showed that the gas contained methane (LEL = 20%∼10,000 ppm) and traces of H2S (35 ppm). Further sampling and gas
analyses showed that methane and carbon dioxide are the main components of the erupted gas in addition to water vapour (Table 1). In more detail, gas sampled in July in the proximity of the crater showed CO2
contents between 9.9% and 11.3%, CH4between 83%
and 85.4%, and traces of heavier hydrocarbons. In September, the steam collected from the crater showed a CO2 content up to 74.3% in addition to CH4.
Simultaneously, the gas sampled from a 30.8 °C seep 500 m away from the crater had a lower CO2content
(18.7%). The four gas samples collected during the September campaign were analysed for δ13C in CO2 and CH4. Theδ
13
C values for CO2and CH4vary from
−14.3‰to−18.4‰and from−48.6‰to−51.8‰,
respectively (Table 1).
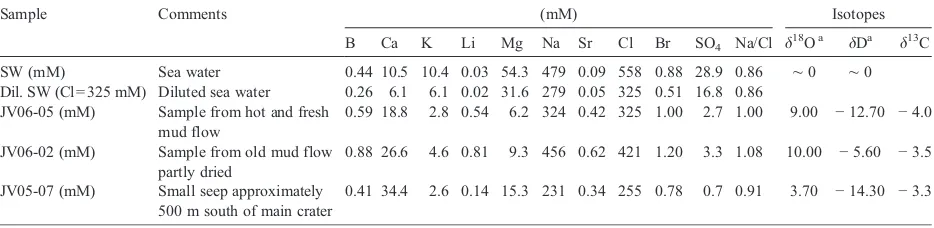
The composition of the expelled water from near the crater shows a chloride content 39% lower than sea water, with chloride concentration of about 11,300 ppm and sodium of 7300 ppm (Table 2). The concentration of other solutes like SO4 and Mg are furthermore lower
than in sea water. Compounds like B and Ca on the other hand are enriched. Bubbling and evaporation in the crater might increase the salinity with time, but fluid is being constantly erupted at a high rate. The waters collected are enriched in18O (δ18O = 9.0‰in the crater
and 3.7‰far from crater) compared to sea water and normal pore fluids from sedimentary basins, whereas δD values (−12.7‰−14.4‰) are depleted compared to sea water.
4.4. The source of the erupted mud
Clay mineral analyses of the thirteen samples collected from the borehole showed very similar sediment lithology and origin. Except for a relatively thin unit of almost pure smectite claystone (1341– 1432 m) suggesting a period of high rate volcaniclastic deposition in marine environment, all other samples are composed of kaolinite, smectite and illite mixture. Three main intervals are identified and demonstrate progres-sive changes detected in clay mineral assemblages upon burial. 1) 1109–1341 m: the expandable smectite–illite phase is irregular and contains 35–45% of illite layers, illite crystallinity is low, chlorite is not detected; 2) 1432–1615 m: the illite layers compose 45–55% of smectite–illite, subregular and regular rectorite-like phases are present, kaolinate loses crystallinity, chlorite traces are present; 3) 1615–1828 m: the illite layers take up to 65% of smectite–illite, the chlorite traces increase in amount and crystallinity. The LUSI erupted mud has a clay mineralogy very similar to the samples from interval 1615–1828 m: illite layers with 65% of smectite–illite, and chlorite with higher crystallinity present in traces. The LUSI mud contains more smectite than most samples from the borehole, suggesting either a volcanoclastic source layer or mixing with material from the smectite-rich interval (1341–1432 m) on the way to the surface.
Comparing the borehole biostratigraphy with well cuttings demonstrate that the erupted mud is sourced from clay intervals between 1219–1828 m. Further-more, when correlating vitrinite reflectivity data of the erupted mud (0.55 to 0.69% Ro) with the borehole data, a maturity of N 0.65% Ro of the organic matter is reached at∼1700 m. (Fig. 2). Hence the erupted mud
has a deep origin and is migrating from depths of at least 1219 m and probably as deep as 1828 m.
5. Discussion
5.1. Origin of erupting solids and fluids
Based on combined biostratigraphy, clay minerals and vitrinite reflectivity results, the main source of the erupted mud can be constrained between ∼ 1615–
1871 m) erupted after the initial stages of LUSI activity (Fig. 3(B)) could be related to a combination of factors. The proposed alternatives include: a) fluidization of the Pucangan sandy layers during the water-rich fluids rise, b) partial fluidization of the uppermost part of the turbidite unit due to water volume increase during clay mineral dehydration, c) partial sand fluidization follow-ing seismic activity, d) possible flux of fluids risfollow-ing from the deeper sited Kujung Formation. Geochemical results are consistent with the geological observations suggest-ing a mixture of deep and shallow fluids. The gas isotopic composition supports the hypothesis of a mixed biogenic and thermogenic origin of the gases erupted at LUSI (e.g. cfr.Bernard et al., 1978; Whiticar, 1999). The relatively low δ13CCH4 (down to − 51.8‰) indicates input from biogenic gas mixed with a thermogenic contribution as supported by the presence of heavier hydrocarbons. In our case, the overpressured clayey units (1323–1871 m) are good candidates for source
layers of biogenic gas, while the isotopically heavier thermogenic gas could have migrated from deeper sited formations (e.g. Ngimbang Formation situated at greater depth,Wilson et al., 2000). The constant presence of H2S
since the beginning of the eruption could also suggest a contribution of deep gas or, most likely, H2S previously
formed at shallow depth in layers rich in SO4and–or
methane or organic matter. The rapidly varying compo-sition of the erupted gas (Table 1) also indicates a complex system of sources and reactions before and during the eruption. While the origin of methane is traced to organic material, the high amount of CO2in the gas
phase is surprising. A microbial origin of CO2at LUSI is
indicated by theδ13CCO2values (as low as −18.4‰). Comparable values are detected in numerous organic-rich sedimentary basins where the CO2is produced in
significant amounts and normally dissolved in the pore waters. In our case the CO2solubility in pore waters from
the overpressured intervals is on the order of 47 g/L (at
Fig. 5. Monitoring performed at the LUSI site. Periods of stronger eruption coincide with recorded peaks in H2S and CH4content. Stars indicate the recorded earthquakes withMN3.7 and with epicentre within 300 km from LUSI (Source USGS). It should be noted that the monitoring during the months of June and July was not conducted on a daily rate and therefore not as accurate as for the remaining part of the record; after the 26th of September the monitoring was conducted every 4 d approximately. LEL is a measure of CH4concentration in the gas clouds emitted, where 20% corresponds to 10,000 ppm.
382
A.
Mazzini
et
al.
/
Earth
and
Planetary
Science
Letters
261
(2007)
375
–
300 bar, 1 M NaCl, and 100 °C)(Duan and Sun, 2003). During pressure reduction and ascent towards the surface, the CO2 solubility in the water is reduced to
0.1 g/L (at 1 bar, 1 MNaCl and 100 °C), and the CO2is
accordingly released to the gas phase.
The fluids expelled with the mud have a salinity (∼ 20 g/kg) which is lower than that of seawater (∼35 g/kg). Their composition suggests that they were formed by dilution and diagenetic modification of seawater from the water in marine formations below LUSI. Assuming that chlorine behaved conservatively during burial and mud volcanism, we have calculated the composition of diluted seawater with a chlorinity of 325 mol l− 1 (Table 2). Compared to this freshened
seawater, the LUSI fluids are enriched in B, Ca, Li, Na, Sr and Br and depleted in K, Mg and SO4. They are also
enriched in 18O and depleted in 2H. Part of the freshening could be due to mixing with shallow meteoric waters. Fluid chemistry, however, suggests
that freshening could also derive from diagenetic processes. The enrichment in B and Li and 18O and the depletion in2H is typically acquired via clay mineral dehydration and has been observed in other mud volcano fluids (Dahlmann and de Lange, 2003; Hensen et al., 2004). In this process, 18O-rich, 2H-poor clay mineral interlayer water, Li and B are released to pore fluids at temperatures between 60 and 160 °C (Ishikawa and Nakamura, 1993; Chan and Kastner, 2000; Dahlmann and de Lange, 2003) resulting in the observed chemical shifts and in pore water freshening. In addition to clay mineral dehydration, the depletion in Mg and K and the enrichment in Ca and Sr suggests that silicate alteration reactions could have occurred ( Ege-berg, 1990; Martin et al., 1996). The most probable source of reactive silicates is the Pleistocene volcani-clastic sands. Because silicate alteration reactions consume18O-rich water, they result in a salinity increase and a decrease in fluid pore fluidδ18O. The observed Table 1
Hydrocarbon and isotope composition analyses of gas emitted at different locations from the LUSI site
Sample Date Comments (Vol.%) gas δ13C δD
JV040706 4-Jul-06 Close to crater 85.47 2.29 0.98 0.21 0.32 0.12 0.12 0.55 9.94 JV130706 13-Jul-06 Close to crater 83.01 3.02 1.28 0.26 0.40 0.15 0.14 0.38 11.35
Table 2
Water and isotope composition analyses of fluids emitted at different locations from LUSI site compared with seawater values (SW) and diluted seawater (Dil. SW)
Sample Comments (mM) Isotopes
B Ca K Li Mg Na Sr Cl Br SO4 Na/Cl δ18Oa δDa δ13C
SW (mM) Sea water 0.44 10.5 10.4 0.03 54.3 479 0.09 558 0.88 28.9 0.86 ∼0 ∼0
Dil. SW (Cl = 325 mM) Diluted sea water 0.26 6.1 6.1 0.02 31.6 279 0.05 325 0.51 16.8 0.86 JV06-05 (mM) Sample from hot and fresh
mud flow
0.59 18.8 2.8 0.54 6.2 324 0.42 325 1.00 2.7 1.00 9.00 −12.70 −4.0
JV06-02 (mM) Sample from old mud flow partly dried
0.88 26.6 4.6 0.81 9.3 456 0.62 421 1.20 3.3 1.08 10.00 −5.60 −3.5
JV05-07 (mM) Small seep approximately 500 m south of main crater
0.41 34.4 2.6 0.14 15.3 231 0.34 255 0.78 0.7 0.91 3.70 −14.30 −3.3
a
freshening and 18O-enrichment of the LUSI fluids implies that clay mineral dehydration dominated over silicate alteration reactions in defining the isotopic and chemical composition of pore fluids.
Is it possible that a large part of the∼15 million m3of
water so far (i.e. March 2007) erupted originates from the dehydration of clay minerals as indicated by the water analyses? In order to address this question, a conservative calculation of the amount of water potentially produced by clay mineral dehydration can be done. We know that at least the 1109–1828 m interval is affected by the smectite–illite transformation. Based on surface subsi-dence monitoring, we estimate that a potential ellipsoidal area (axes 3.5 × 2 km) around the conduit acts as a source region. Considering that a) 1 m3of smectite can produce up to 0.35 m3 of water during dehydration (Perry and Hower, 1972; Kholodov, 1983), that b) the average smectite content in studied clayey series is 35%, and that c) 65% of this smectite has been transformed into illite, estimates show that up to 1.2 billion m3 of water is available. To this value should be added the seawater originally present in the undercompacted marine clayey units and conserved within very thin impermeable units due to fast burial. An important conclusion is that the erupted waters and clay minerals demonstrate that diagenesis at N 1109 m depth contributed to pressure build up in the sedimentary sequences.
5.2. Seismic triggering?
On the 27th of May 2006 at 5:54 local time a 6.3 M earthquake struck the southern part of the island of Java followed by two aftershocks measuring 4.8 and 4.6 M occurring respectively 4 and 6 h later (U.S. Geological Survey, 2006). The epicentre was recorded∼25 km SW of
Yogyakarta, and caused almost 6000 deaths leaving 1.5 million of people homeless. Is there any relationship between the May 27 earthquake and the LUSI eruption? It is well documented that geysers, methane emissions, and mud volcano dynamics are linked with tectonic activity (e.g. Guliev and Feizullayev, 1997; Kopf, 2002; Hieke, 2004; Manga and Brodsky, 2006; Mellors et al., 2007; Mau et al., 2007), that eruptions can be affected even by earthquakes several thousands of kilometres away (e.g.
Husen et al., 2004) where a delay of few days can occur between the earthquakes and the eruption. Similarly variations in pressure and permeability were recorded in wells located hundreds and even thousands of km from the epicentre of the earthquake (Brodsky et al., 2003). Moreover, vertical piercement structures underlying mud volcanoes are often associated with controlling factors such as faults or anticlines (e.g.Jakubov et al., 1971; Planke
et al., 2004). Both active tectonics, fault and piercement structures are relevant for the LUSI location. The intensity of the 27th of May earthquake was recorded with 2–3 MMI in Surabaya and up to 4 MMI in the Northern part of the Arjuno–Welirang volcanic complex close to the LUSI eruption site (U.S. Geological Survey, 2006). A regional fault crossing the G. Penanggungan volcano and outcrop-ping at the Watukosek escarpment extends NE towards LUSI. Where this fault intersects the railway significant bending of the rails appeared after the 27th of May earthquake (Fig. 3(F)) indicating a strong lateral activity. Similarly the Porong River shows obvious bending of its course (Fig. 1(B)) also indicating a long history of the fault feature. The same fault also accommodates other aligned mud volcanoes in the region (e.g. Gunung Anyar, Pulungan, Kalang Anyar, Bangkalan,Fig. 1). In addition, seismic profiles acquired before the May 2006 eruption showed evidence of a vertical piercement structure with upwards dipping strata around the LUSI conduit zone (Fig. 3(G)). This could be interpreted as evidence for a long history of active vertical movements of mud underneath LUSI, possibly with former eruptions or as a disturbed signal due to the fault that crosses this area. It is likely that the 27th of May seismic event redistributed the stress in several parts of Java and in particular contributed to reactivate fractures in this pre-existing fault, affecting the fluid pressure and permeability (e.g.Elkhoury et al., 2006) and ultimately triggered the eruption through the already overpressured subsurface piercement structure. This pos-sibility is also supported by the fact that partial loss was recorded in the well fluids 10 min after the 27th of May earthquake. This record could in fact be related to movements along the fault that once activated lost its sealing capacity and become more permeable. A simulta-neous decrease in gas production from the nearby Carat well also indicated that the regional plumbing system was affected by the seismic event.
Interestingly, the increased activity of small seeps in the neighbouring mud volcanoes coincides with the recent seismic event (i.e. 27th of May), showing that the local fluid flow pathways were affected. The most significant eruption was observed at Purwodadi mud volcano (central part of Java) that also erupted boiling mud and water. Between December 2006 and January 2007 new eruption sites with characteristics similar to LUSI appeared in the central (Bojonegoro mud eruption) and western (Serang mud eruption) part of Java following earthquakes.
5.3. Eruption models
released by the 27th of May earthquake and not by the drilling activity. It is documented that in several instances seismic events (including the 27-05-2006 earthquake) trigger and enhance the volcanic activity on Java Island (e.g.Walter et al., 2007). We suggest that deep fracturing associated with the previously described fault occurred
within and above the already overpressured clayey units as a consequence of the earthquake. The fluids in the overpressured intervals (1323–1871 m) started to rise along these newly formed fractures. The triggered flow resulted in a partial pressure decrease sufficient to exsolve CO2from the pore water. A pressure drop to hydrostatic
values at 1700 m would result in a pressure decrease of about 11 MPa (Fig. 2). A pressure decrease of this magnitude at 100 °C would result in a solubility reduction of CO2in water on the order of 6 g/L (cf.Duan and Sun,
2003). The depressurization and gas exsolution led to an escalation of vertical fluid flow and eventually to bulk mobilization of mud. Once the hot fluids and mud reached a shallow depth (∼200 m), the hydrostatically pressured
fluids started boiling and resulted in the violent eruptions of water and mud that continues up to date (i.e. June 2007) with a pulsating behaviour. Thus the boiling combined with gas exsolution (CO2 and CH4) initiated a
self-sustained system and a powerful engine capable of long-lasting mud eruption. The volume of mud erupted since the 29th of May is estimated to be higher than 27 million m3(i.e. data updated in March 2007). The recorded time delay between the earthquake and the eruption could be explained with a mechanism similar to the one described byMiller et al. (2004)The authors described earthquakes initiating local fluid movements, that, as a consequence, trigger further earthquakes after a time delay. The fluid-earthquake system may therefore continue to evolve for some time after the main event.
An alternative hypothesis to explain the sudden eruption invokes a blow-out at the drilling site. This hypothesis would imply that the mud circulation in the well was interrupted during the drilling, followed by a pore pressure rise. This could potentially create an uncontrolled flow of reservoir fluids into the wellbore and a blow-out. Examples of blow-out from drilling sites are known (e.g. blow-out in the North Sea at Ekofisk field Bravo platform in April 1977, and in Brunei, Tingay et al., 2005). However, no kicks were recorded at the bottomhole of BJP1, and no fluids erupted through the well. Moreover the shoe of the BJP1 well (usually the weakest point of a borehole) and the bit appeared to be intact suggesting that the main eruptive conduit did not intersect the well. Borehole tests showed that there was no connection between the fluids circulating in the well and mud erupted on surface.
It is impossible to address with certitude the triggers of the LUSI eruption. However, based on the available data and evidences, the hypothesis of an eruption entirely attributed to drilling (e.g.Davies et al., 2007), is inconclusive.
5.4. Pulsations
The monitoring performed at LUSI shows that a pulsation phase occurred after the initial vigorous eruptive phase (Fig. 6). During the pulsation period that lasted from 10th August to 10th September the flow
rate was gradually reduced suggesting that after an initial powerful activity and pressure release the system switched off naturally. This is interpreted as a gradual collapse of the conduit during a progressive overpres-sure decrease, and the development of a geyser-like behaviour. However, a sudden reactivation of the eruption, with flow-rates suddenly rising to 160,000 m3/ d, coincides with a series of earthquakes the 6th and 8th of September (i.e.;Fig. 5).
Monitoring in September showed that more powerful eruptions occurred with a periodicity of∼30 min. Daily pulsations are described for other mud volcanoes (e.g.
Jakubov et al., 1971), but the total eruption duration rarely exceeds a few days. The best analogue to the pulsations of LUSI are geysers in hydrothermal systems, where fluids are erupted after cycles of boiling and sudden pressure release. The significant amount of H2S
detected during the initial phase of the eruption and systematically increasing during peaks of activity, supports the hypothesis of fluids rising from deeper units. Nevertheless, we do not have any indications of the LUSI plumbing system being directly linked to the volcanic arc to the south, although the generally high geothermal gradient in the area could be influenced by the magmatism. Nor is there any evidence to invoke the movement of supercritical fluids at great depth as driving force for the eruption (cf.Hovland et al., 2006). Based on the data available, we suggest that the pulsating activity of LUSI and the high temperatures reflect a quasi-hydrothermal behaviour of the eruptive system.
5.5. One year later: LUSI still active
One year after the initial burst, LUSI is still vigorously erupting. To date (i.e. June 2007) the volcano is erupting 111,042 m3/d and the average subsidence of the area reached ∼ 10.7 m. Interestingly the water content has
gradually decreased to∼ 30%, with the remaining part
consist of mud and well rounded clasts from the bluish gray clay of the Upper Kalibeng Formation (i.e. typical mud breccia erupted from mud volcanoes). The roundness of the mud breccia clast is ascribed to the very poor lithification of this formation and to the vigorous ascent of the material. In February 2007 pulsations of more powerful eruption occurred every 1.5 h which is significantly higher interval than what was recorded in September 2006 (i.e. every∼30 min).
drastic increase in viscosity and clast component, a fleet of tens of excavators is continuously scooping the mud breccia towards the southern area.
In order to reduce the powerful eruption, in March 2007 a new project started the deployment of concrete spheres in the crater. These spheres (density 2.4 g/cc) have a diameter varying between 20–40 cm, are connected in clusters of four balls in total (two of 20 cm and two of 40 cm in diameter) and have been coated with chemicals in order to avoid fast dissolution of the cement. 374 clusters were inserted during the first phase and 24 out of a 500 planned were deployed during the second phase. The balls apparently had reached a depth of N 300 m and some a depth of more than 1000 m. Unfortunately the flow rate does not seem to be significantly affected by this deployment. A latest project proposes the building of a concrete dam surrounding the crater. This dam would be a 120 m diameter cylinder with 10 m thick walls and 50 m in height.
6. Conclusions
LUSI represents a unique opportunity to monitor and to understand the mechanisms occurring during mud volcanic eruptions since the birth of the structure. Its pulsating behaviour and the long-lasting eruption continue to provide valuable data that help to unravel the evolution of volcanic eruptions. Our data suggest that prior to the eruption the system was at a critical state and that external perturbations could initiate catastroph-ic events at this location. Although this conclusion is circumstantial, the observations collected indicate that the 27th of May earthquake might have triggered the eruption. We suggest a new conceptual model where the eruption is triggered by fracturing followed by vertical migration of overpressured mud. This mud rise resulted in a pressure decrease and an exsolution of dissolved gases in the pore water. This driving force allowed mud to reach the surface at significantly high speed and to induce the boiling of the deep and hot pore fluids. The phenomenon of mud volcanism is poorly studied in Indonesia although it is broadly diffused and represents a hazard in a densely populated society.
Acknowledgements
The authors are grateful to Jeanette Sudjunadi and Soffian Hadi, Adi Kadar, Anders Nermoen, Wildan Somantri, for their support and fruitful discussions during fieldwork in Indonesia. The management of Lapindo Brantas & BPMIGAS is thanked for sharing the data and
allowing the publication. The conclusions of this manu-script are not necessarily those of Lapindo Brantas & BPMIGAS, that did not influence the results of the presented research. Henry Elderfield and four anonymous reviewers are thanked for their constructive reviews and Bjørn Jamtveit, Harald Johansen and Galen Gisler are thanked for their comments and suggestions. We gratefully acknowledge support from a Center of Excellence grant and a PETROMAKS grant, both from the Norwegian Research Council. Our deepest gratitude and memory goes to the late V. Shlykov for his help during the XRD analyses.
References
Barber, A.J., Tjokosapoetro, S., Charlton, T.R., 1986. Mud volcanoes, shale diapers, wrench faults and melanges in accretionary complexes, eastern Indonesia. Am. Assoc. Pet. Geol. Bull. 70, 1729–1741. Bernard, B.B., Brooks, J.M., Sackett, W.M., 1978. Light hydrocarbons
in recent Texas continental shelf and slope sediments. J. Geophys. Res. 83, 4053–4061.
Brodsky, E.E., Roeloffs, E., Woodcock, D., Gall, I., M.M., 2003. A mechanism for sustained groundwater pressure changes induced by distant earthquakes. J. Geophys. Res. 108, 7.1–7.10. Chan, L.-H., Kastner, M., 2000. Lithium isotopic compositions of pore fluids and sediments in the Costa Rica subduction zone: implications for fluid processes and sediment contribution to the arc volcanoes. Earth Planet. Sci. Lett. 183, 275–290.
Cita, M.B., Ivanov, M.K., Woodside, J.M., 1996. The Mediterranean Ridge Diapiric Belt, Special Issue. Mar. Geol. 132. 273 pp. Dahlmann, A., de Lange, G.J., 2003. Fluid-sediment interactions at
Eastern Mediterranean mud volcanoes: a stable isotope study from ODP Leg 160. Earth Planet. Sci. Lett. 212, 377–391.
Davies, R., Swarbrick, R., Evans, R., Huuse, M., 2007. Birth of a mud volcano: East Java, 29 May 2006. GSA Today 17, 4–9. Duan, Z., Sun, R., 2003. An improved model calculating CO2
solubility in pure water and aqueous NaCl solutions from 273 to 533 K and from 0 to 2000 bar. Chem. Geol. 193, 257–271. Egeberg, P.K., 1990. Unusual composition of pore waters found in the
Izu-Bonin fore-arc sedimentary basin. Nature 344, 215–218. Elkhoury, J.E., Brodsky, E.E., Agnew, D.C., 2006. Seismic waves
increase permeability. Nature 441, 1135–1138.
Guliev, I.S., Feizullayev, A.A., 1997. All About Mud volcanoes. Nafta Press, Baku. 52 pp.
Hensen, C., Wallmann, K., Schmidt, M., Ranero, C.R., Suess, E., 2004. Fluid expulsion related to mud extrusion off Costa Rica—a window to the subducting slab. Geology 32, 201–204.
Hieke, W., 2004. The August 27, 1886 earthquake in Messenia (Peloponnesus) and reported flames over the Ionian Sea—a Mediterranean Ridge gas escape event? Mar. Geol. 207, 259–265. Hovland, M., Fichler, C., Rueslatten, H., Johansen, H., 2006. Deep-rooted piercement structures in deep sedimentary basins— manifestations of supercritical water generation at depth? J. Geochem. Explor. 89, 157–160.
Husen, S., Taylor, R., Smith, R.B., Heasler, H., 2004. Changes in geyser eruption behavior and remotely triggered seismicity in Yellowstone National Park produced by the 2002 M 7.9 Denali fault earthquake, Alaska. Geology 32, 537–540.
Ivanov, M.K., Limonov, A.F., van Weering, T.C.E., 1996. Compar-ative characteristics of the Black Sea and Mediterranean Ridge mud volcanoes. Mar. Geol. 132, 253–271.
Jakubov, A.A., Ali-Zade, A.A., Zeinalov, M.M., 1971. Mud Volcanoes of the Azerbaijan SSR, Atlas (in Russian). Azerbaijan Academy of Sciences, Baku.
Kholodov, V.N., 1983. Postsedimentary Transformations in Elisional Basins (example from Eastern Pre-Caucasus) (in Russian),150 pp. Kopf, A.J., 2002. Significance of mud volcanism. Rev. Geophys. 40,
1–52.
Kusumastuti, A., Van Rensbergen, P., Warren, J.K., 2002. Seismic sequence analysis and reservoir potential of drowned Miocene carbonate platforms in the Madura Strait, East Java, Indonesia. Aapg Bull. 86, 213–232.
Manga, M., Brodsky, E., 2006. Seismic triggering of eruptions in the far field: volcanoes and geysers. Annu. Rev. Earth Planet. Sci. 34, 263–291.
Martin, B.M., Kastner, M., Henry, P., Le Pichon, X., Lallement, S., 1996. Chemical and isotopic evidence for sources of fluids in a mud volcano field seaward of the Barbados accretionary wedge. J. Geophys. Res. 101, 20325–20345.
Mau, S., Rehder, G., Arroyo, I.G., Gossler, J., Suess, E., 2007. Indications of a link between seismotectonics and CH4 release from seeps off Costa Rica. Geochem. Geophys. Geosyst. 8, 1–13.
Mellors, R., Kilb, D., Aliyev, A., Gasanov, A., Yetirmishli, G., 2007. Correlations between earthquakes and large mud volcano eruptions. J. Geophys. Res. 112, B04304.
Miller, S.A., Cristiano, C., Chiaraluce, L., Cocco, M., Barchi, M., Kaus, B.J.P., 2004. Aftershocks driven by a high-pressure CO2 source at depth. Nature 427, 724–727.
Mukhtarov, A.S.h., Kadirov, F.A., Guliyev, I.S., Feyzullayev, A., Lerche, I., 2003. Temperature evolution in the Lokbatan mud volcano crater (Azerbaijan) after the eruption of 25 October 2001. Energy Explor. Exploit. 21, 187–207.
Perry, E.A., Hower, J., 1972. Late-stage dehydration in deeply buried Pelitic sediments. Aapg Bull. 56, 2013–2021.
Planke, S., Svensen, H., Hovland, M., Banks, D., Jamtveit, B., 2004. Mud and fluid migration in active mud volcanoes in Azerbaijan. Geo Mar. Lett. 23, 258–268.
Schiller, D.M., Seubert, B.W., Musliki, S., Abdullah, M., 1994. The reservoir potential of globigerind sands in Indonesia. IPA 23rd Annual Convention Proceedings, pp. 189–212.
Tingay, M.R.P., Hillis, R.R., Morley, C.K., Swarbrick, R.E., Drake, S.J., 2005. Present-day stress orientation in Brunei: a snapshot of ‘prograding tectonics’in the tertiary delta. J. Geol. Soc. 162, 39–49. U.S. Geological Survey, 2006. http://earthquake.usgs.gov/eqcenter/
eqinthenews/2006/usneb6/.
Walter, T.R., Wang, R., Zimmer, M., Grosser, H., Lühr, B., Ratdomopurbo, A., 2007. Volcanic activity influenced by tectonic earthquakes: static and dynamic stress triggering at Mt. Merapi. Geophys. Res. Lett. 34, L05304.
Whiticar, M.J., 1999. Carbon and hydrogen isotope systematics of bacterial formation and oxidation of methane. Chem. Geol. 161, 291–314.
Willumsen, P., Schiller, D.M., 1994. High quality volcaniclastic sandstone reservoirs in East Java, Indonesia. IPA 23rd Annual Convention Proceedings, pp. 101–111.
Wilson, M.E.J., Bosence, D.W.J., Limbong, A., 2000. Tertiary syntectonic carbonate platform development in Indonesia. Sedi-mentology 47, 395–419.