Indonesia Innovation Profile
Part of OECD Reviews of Innovation Policy
Innovation in Southeast Asia
Prepared by:
Yanuar Nugroho
Manchester Institute of Innovation Research (MIOIR), University of Manchester, UK
Gernot Hutschenreiter
Organisation for Economic Cooperation and Development (OECD), Paris, France
Irsan Aditama Pawennei
Centre for Innovation Policy and Governance (CIPG), Indonesia
Mirta Amalia
Centre for Innovation Policy and Governance (CIPG), Indonesia
Indonesia Innovation Profile
Part of OECD Reviews of Innovation Policy
Innovation in Southeast Asia
Prepared by:
Yanuar Nugroho
Manchester Institute of Innovation Research (MIOIR), University of Manchester, UK
Gernot Hutschenreiter
Organisation for Economic Cooperation and Development (OECD), Paris, France
Irsan Aditama Pawennei
Centre for Innovation Policy and Governance (CIPG), Indonesia
Mirta Amalia
ISBN 978-92-64-12870-5 (print)
ISBN 978-92-64-12871-2 (PDF)
Chapter 6
Indonesia innovation profile
Indonesia has risen to become a middle-income economy through appreciable levels of economic growth which have relied to a large extent on exports of natural resources and good trade links with leading global economies. However, Indonesia’s GDP per capita remains relatively low (poverty remains a social problem) and it has only attracted modest levels of foreign direct investment (FDI). It has not developed a technology-intensive industry structure and imports of high-technology products outweigh exports. Increases in total factor productivity (TFP) have contributed to economic growth, but TFP growth levels have been lower than in competitor countries. Similarly, FDI is flowing into high- and medium-technology sectors, but input levels are low compared to those elsewhere, and many of its regional neighbours appear to be modernising their economies more rapidly and effectively.
6.1. Macroeconomic performance and framework conditions for innovation
6.1.1. Performance and structure of the economy
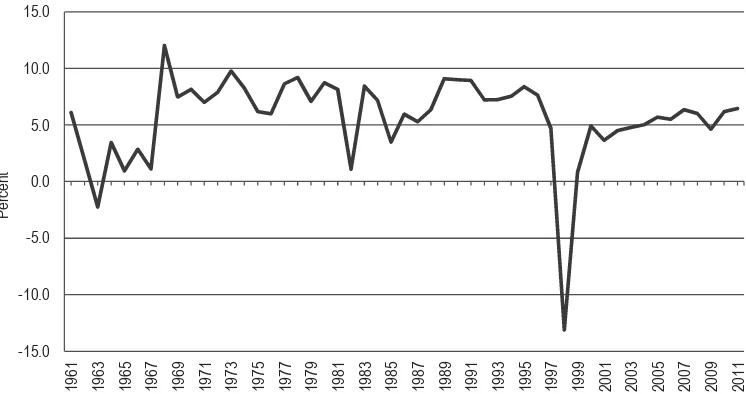
From the mid-1960s to the mid-1990s, Indonesia’s GDP grew at an average rate of over 6% a year. The economy contracted sharply in the wake of the 1997-98 Asian financial crisis but economic growth rebounded to an average of over 5% over the decade 2000-2009 (Figure 6.1). Following a slight slowdown in 2009 due to reduced global demand, GDP growth returned to 6.2% in 2010 and 6.5% in 2011. However, GDP per capita remains low at USD 4 094 at 2005 PPP prices, while unemployment levels (7.1% of the total workforce in 2010), poverty levels (in 2010 18.1% of the population had a daily income less than USD 1.25 at PPP), and child labour (6.6% of children aged between 7 and 14 were economically active in 2009) are serious socio-economic problems confronting the country (World Bank 2012b).
Figure 6.1. Indonesia’s GDP growth 1961-2011 (%)
Source: World Bank, World Development Indicators.
Indonesia’s growth after a period of political instability in the early 1960s was based on exports of goods such as oil and gas, plywood, textiles and rubber, with a growing trade in manufactured goods such as electrical appliances and computer components. Japan and the United States became major export targets and have remained important export partners since 2000 (Table 6.1), though the relative share of exports to China, especially, as well as countries such as Singapore, Korea, India and Malaysia have increased over the period 2000-2010. Over the same period China has become the primary import partner, with Singapore remaining in second position whilst the share of imports from Japan and the United States have declined.
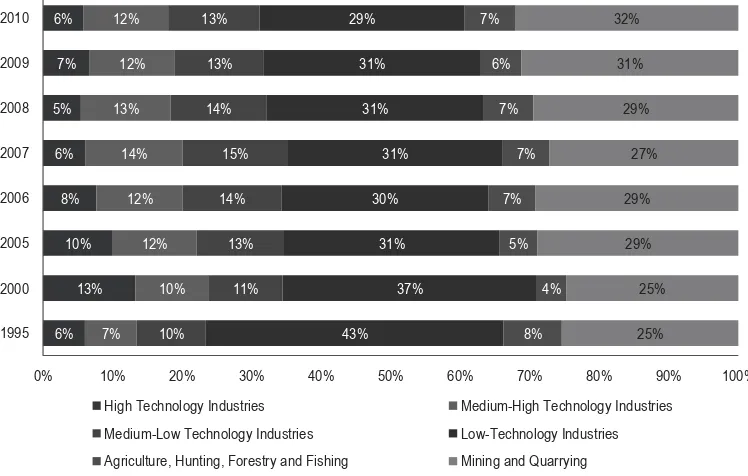
Products based on natural resources have dominated lists of the top ten exports, with exports of manufactured goods such as computer components dropping down the rankings over the period 2000-2007. The nature of manufactured goods exported has also altered since the Asian crisis. In the first instance, the crisis led to a short-term increase in the relative proportion of high-technology and medium-high technology manufactures at the expense of low-technology manufactures and agricultural products (Figure 6.2). Since 2000, however, exports of high-technology manufactures have declined to pre-crisis levels, though the proportions of medium-high and medium-low technology manufactures
-15.0 -10.0 -5.0 0.0 5.0 10.0 15.0
1961 1963 1965 1967 1969 1971 1973 1975 1977 1979 1981 1983 1985 1987 1989 1991 1993 1995 1997 1999 2001 2003 2005 2007 2009 2011
P
Table 6.1. Indonesia’s top trading partners, 2000-10
Rank Indonesia’s top 10 export partners in 2000 USD million Indonesia’s top 10 export partners in 2010 USD million 1 Japan 14 415 Japan 25 782 Indonesia’s top 10 import partners in 2000 USD million Indonesia’s top 10 import partners in 2010 USD million 1 Japan 5 397 China 20 424
Source: UN Commodity Trade (Comtrade) Statistics Database.
Figure 6.2. Indonesia's manufacturing exports by technology intensity % of total exports value
Source: OECD, STAN Bilateral Trade Database (BTD).
6%
High Technology Industries Medium-High Technology Industries
Medium-Low Technology Industries Low-Technology Industries
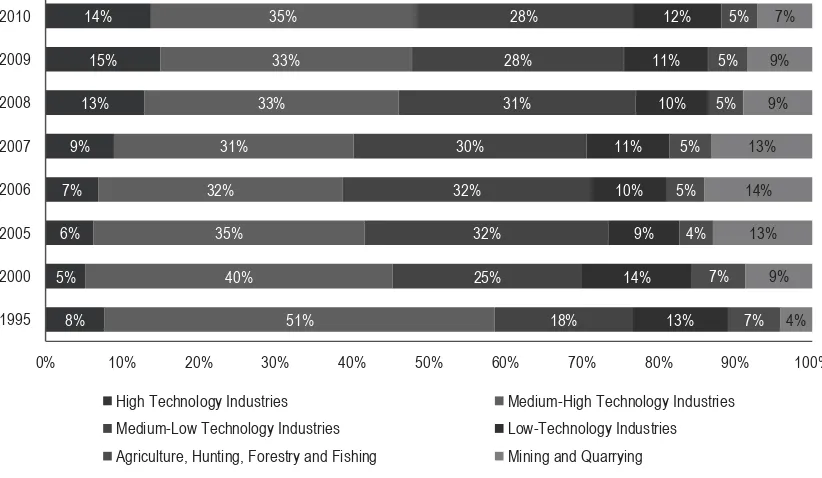
Changes have also occurred in the technological intensity of imports (Figure 6.3). Since 2000, Indonesia has increased its propensity to import high-technology manufactured goods from 5% of the total to 14% in 2010 with negative consequences for Indonesia’s overall trade balance. Over the same time the proportion of medium-high technology imports has fallen. The share of medium-low technology imports was higher in 2010 than 2000 although it has been falling in the past five years.
Figure 6.3. Indonesia’s manufacturing imports by technology intensity
% of total imports value
Source: OECD, STAN Bilateral Trade Database (BTD).
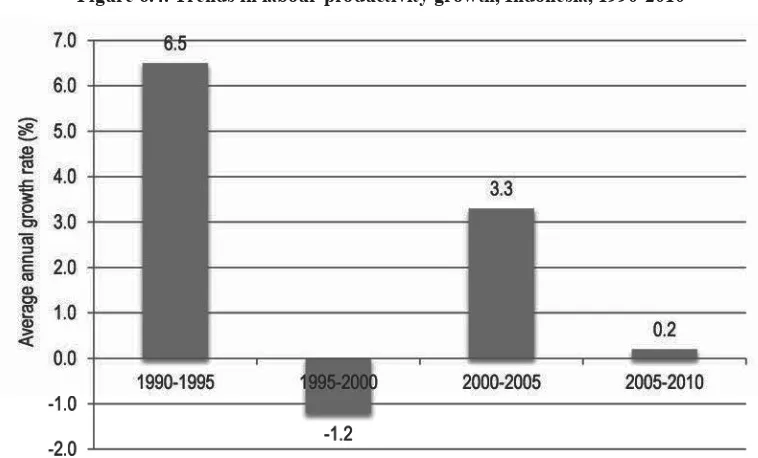
Labour productivity levels in Indonesia remain low compared to other countries in the region and growth rates since the Asian financial crisis have lagged behind the rates achieved pre-crisis (Figure 6.4). Labour productivity growth over the period 2005-2010 (0.2%), especially, was considerably more sluggish than in countries such as Malaysia (3.0%), Viet Nam (3.2%) and Cambodia (4.2%). Growth in total factor productivity (TFP) since 1990 has also been much lower than levels established in Indonesia’s early growth phase from 1970 to 1990 (Figure 6.5), with growth from 1990 to 2010 (0.5%) comparing poorly with growth levels in other countries over the same period, e.g. China (4.7%), Singapore (1.2%), United States (0.9%), Thailand (0.7%), and Viet Nam (1.8%) (APO, 2012).
High Technology Industries Medium-High Technology Industries
Medium-Low Technology Industries Low-Technology Industries
Figure 6.4. Trends in labour productivity growth, Indonesia, 1990-2010
Note. Average annual growth rate of GDP at constant basic prices per hour, using 2005 PPPs. Source: APO Productivity Year Book (2012).
Figure 6.5. Trends in total factor productivity growth, Indonesia, 1970-2010
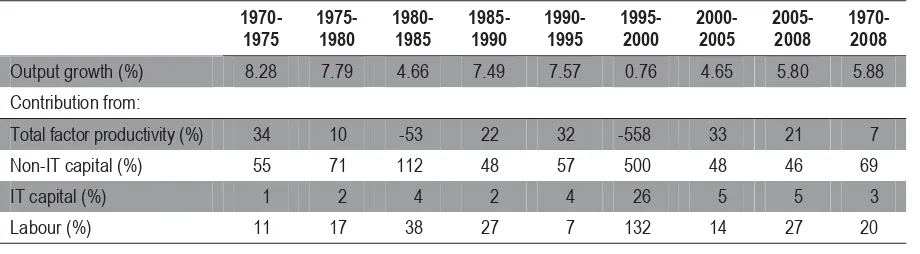
Nevertheless, apart from the severe blip associated with the Asian crisis of 1997-98, the contribution of TFP to overall output growth has been significant in recent years, with the contribution rising to 33% in the period following the crisis (2000-2005) before dropping to 21% in the period from 2005-2008 (Table 6.2). Another source, however, estimates that the TFP contribution to potential output growth over the period 2006-2009 could amount to approximately 40% (OECD, 2010a). Furthermore, a study by Alisjahbana (2009) supports the notion that the contribution of TFP to growth has increased signi-ficantly post-crisis, suggesting that excess capacity before the crisis employed production inputs more efficiently after the crisis.
Table 6.2. Contributions to output growth
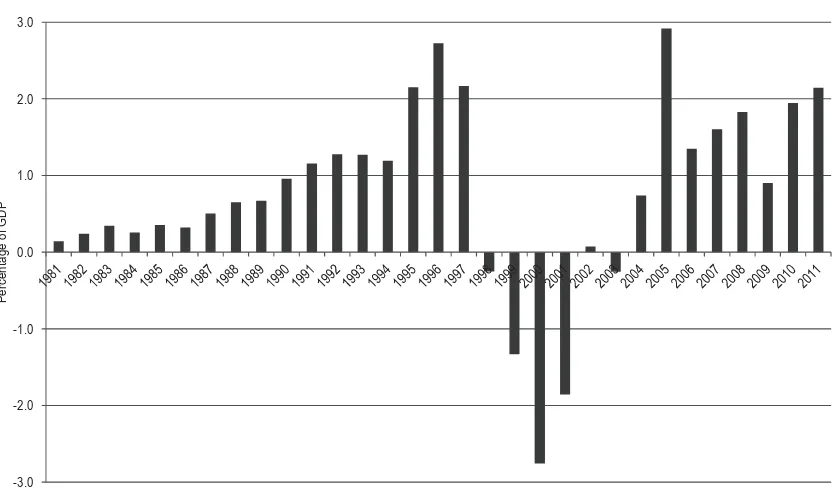
1970-Historically, the largest contribution to growth has been made by non-IT capital, which accounted for 69% of all growth over the period 1970-2008 (Table 6.2), though the contribution from foreign direct investment (FDI) has been relatively small, especially since the Asian crisis (OECD, 2010c). Policy reforms favouring greater openness brought an increase of net FDI flows as a percentage of GDP in the mid-1980s, with Indonesia benefiting as currency appreciation pushed Japan and other newly-industrialising countries to relocate production in lower cost countries in Asia. Consequently, large amounts of FDI flowed into labour-intensive manufacturing sectors such as textiles. The Asian crisis, however, precipitated a severe decline in FDI, a net flight of capital for some years afterwards, and a relatively slow recovery compared to other Asian countries. Inward FDI flows finally rebounded in 2004 and averaged USD 7 billion per year over 2004-2009 (Bank Indonesia), a period characterised by political stability, favourable economic growth performance and the prospect of further trade integration in East Asia following the announcement of ASEAN-China Free Trade Area – CAFTA in 2002 and its sub-sequent implementation in 2010.
As a percentage of GDP, however, FDI inflows to Indonesia (1.9% of GDP in 2010; see Figure 6.6) have still been modest compared to inflows in other countries in Asia, e.g.
Figure 6.6. Net FDI inflows in Indonesia, percentage of GDP (1981-2011)
Source: World Bank World Development Indicators.
Overall, Indonesia’s economic performance can be summarised simply. It is a middle-income economy that has appreciable levels of economic growth and exports of natural resources, but only modest levels of foreign direct investment. It has not developed a technology-intensive industry structure and imports of high-technology products outweigh exports. Increases in TFP have contributed to economic growth, but TFP growth levels have been lower than in competitor countries. Similarly, FDI inflows have been modest and volatile relative to other ASEAN countries.
6.1.2. Framework conditions for innovation
Indonesia ranked 46th on the World Economic Forum’s Global Competitiveness in 2011-2012, down two places from 2010-2011 but an improvement from 55th in 2008. However, it still trailed regional competitors like Singapore (2nd), Malaysia (21st) and Thailand (39th), though it was ahead of Viet Nam (65th) and Cambodia (97th).
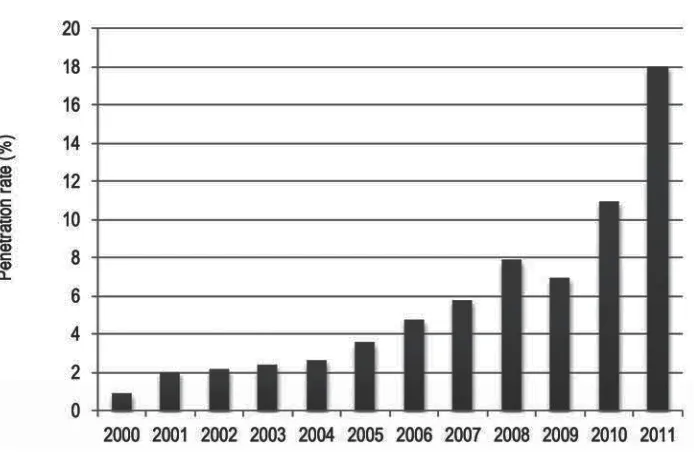
In terms of the sophistication of its ICT infrastructure the proportion of individuals using the Internet jumped from 10.9% in 2010 to 18.0% in 2011(ITU, 2012) (Figure 6.7). These figures still compare poorly with the ITU’s estimates of Internet penetration in 2011 in Singapore (75%), Malaysia (61%), Viet Nam (35%) and Thailand (24%), but nevertheless represent a high rate of growth in the past few years. The number of fixed broadband subscriptions per 100 inhabitants in 2010, standing at 1.1, was also very low compared to levels in Singapore (25.5), Malaysia (7.4), Viet Nam (4.3) and Thailand (5.4).
-3.0 -2.0 -1.0 0.0 1.0 2.0 3.0
P
erc
ent
age of
There is also evidence of a clear digital divide. Sixty-seven per cent of personal computer owners and 70% of households with Internet access are concentrated in Java and Bali alone (Kominfo, 2010), and cable broadband distribution, which is currently not expanding, covers less than 9 million users and is only available in major cities in Java, Bali, Sumatera, Kalimantan and Sulawesi, with more than 50% of the capacity installed only in Jakarta and its satellite cities.
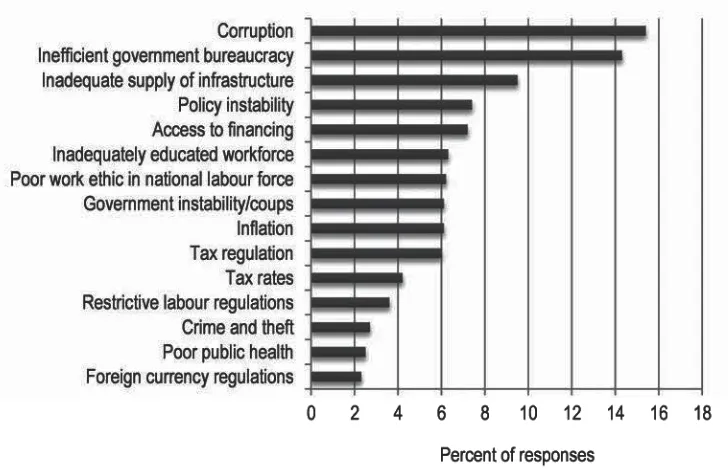
Apart from inadequate infrastructural elements, many other factors in the overall environment in which businesses operate in Indonesia are not conducive to either smooth operation or innovation (Figure 6.8). Perceived levels of bureaucratic inefficiency and corruption are high, with Transparency International ranking Indonesia joint 100th out of 183 in terms of perceived levels of corruption, and Indonesia ranked 129th out of 183 countries in the World Bank’s ‘Ease of Doing Business’ list in 2011 (World Bank/IFC, 2012). Setting up a new business in Indonesia is also more complex and costly than in most other countries in the world.
Access to finance is another factor limiting the establishment of new, innovative businesses (Figure 6.8). Banks are the primary source of finance, but the banking sector was badly affected by the Asian crisis and recovery has been slow, with productivity in the financial and business service sector still at 61% of its 1996 level and inefficiency a deterrent to risk-taking. What finance there is also tends to find its way to established firms rather than new ventures, and sources such as the World Bank and the Asia Development Bank have not prioritised efforts to raise the innovative potential of SMEs.
Figure 6.7. Internet users per 100 inhabitants, Indonesia, 2000-11
Figure 6.8. The most problematic factors for doing business in Indonesia
Source: World Economic Forum (2012). Percentages represent the weighted results of a ranking of the five most problematic factors from a list of 15 by respondents to the WEF survey.
At the turn of the century, Mertins (2002) noted that venture capital and other sources of risk financing for newly established technology-based companies were almost non-existent in Indonesia, while in the same year Kenney, Han and Tanaka (2002) reported that Indonesia, Thailand and Malaysia lacked the necessary conditions for a thriving venture capital industry, namely plentiful investment opportunities, liquid and well developed capital markets, talented venture capitalists and strong property protection and corporate governance. More recently, in 2012, the Global Venture Capital Private Equity Attractiveness Index ranked Indonesia as 55th out of a total of 116 countries in terms of its attractiveness to venture capital. Factors related to the lack of adequate property protection and the weak ICT infrastructure still make Indonesia relatively unattractive for venture and equity investors. Some venture capital firms have been created, but they tend to act in similar ways to normal banks, mainly channelling finance to established enter-prises. There is also a lack of qualified VC project evaluators capable of assessing the technological and innovation potential of newly established companies.
Lack of transparency and weak implementation of tax regulations are also impedi-ments to investment in innovation in Indonesia. Laws allowing taxes to be reduced when companies invest in R&D exist, but there is little evidence that they have been implemented. The lack of a consistent and transparent tax system also does nothing to reduce uncertainty concerning future financial burdens and decisions to invest in R&D (Mertins, 2002).
changes to Indonesia’s IPR legislation regime were then made in 1991 and again in 1997 after Indonesia had joined the WTO. These changes involved the introduction of the Patent Amendment Law (1997), the Copyright Amendment Law (1997) and the Trademark Amendment Law (1997), all of which were intended to bring Indonesia in line with the Agreement on TRIPS (Trade Related Aspects of Intellectual Property Rights).
Subsequent revisions were also made in 2000 with the introduction of the Protection of New Plant Varieties Law, the Trade Secrets Law, the Industrial Designs Law and the Layout Designs of Integrated Circuits Law. The passage of a new copyright law in July 2002 and accompanying regulations in 2004 further strengthened Indonesia's IPR regime. During the same period, the delegation of IPR matters to specialised commercial courts helped to build expertise in the legal system. This has sped up the process, and resulting IP decisions have been judged to be largely sound (Antons, 2007). In addition, special measures have been taken to meet the needs of SMEs, raise their IPR awareness, diffuse knowledge about the variety of intellectual property instruments, lower the cost and time for application, and encourage firms to develop their own IPR strategies (OECD, 2012).
Despite the government's significantly expanded efforts to improve enforcement, intellectual property piracy remains a major concern. A lack of company confidence in enforcement mechanisms deters them from accessing the system in the first place. It is costly to monitor potential infringement of IPRs, and the threat of litigation by more resourceful firms can sometimes intimidate SMEs (ibid.). Using an index designed to measure the strength of patent regimes in terms of coverage (inventions that are patentable), membership of international treaties, duration of protection, enforcement mechanisms and restrictions, Park (2008) concluded that Indonesia lagged behind many other countries. In 1995, Indonesia scored 1.56 compared to an average over 122 countries of 2.58; in 2000, Indonesia scored 2.47 compared to an average of 3.05; and in 2005 Indonesia scored 2.77 compared to an average of 3.34. Indonesia had narrowed the gap between its score and the sample average, but its score in 2005 was still less than the scores for Singapore (4.21), Malaysia (3.48) and Viet Nam (3.03).
6.2. Innovation performance
In terms of the World Bank’s Knowledge Economy Index, which captures the ability of countries to generate and diffuse knowledge, Indonesia ranked only 108th out of 146 countries, three places lower than in 2000. In comparison, Singapore ranked 23rd, Malaysia 48th, Thailand 66th and Viet Nam 104th (Table 6.3).
Table 6.3. Knowledge Economy Index and Knowledge Index, Indonesia, 2012
Indicator Value
Knowledge Economy Index (KEI) # 3.11
Knowledge Index (KI) * 2.99
Economic incentive and institutional regime 3.47
Innovation 3.24
Education 3.20
ICT 2.52
Position in world rank 108
Change in rank from 1995 -3
# The Knowledge Economy Index (KEI) is calculated based on the average of the normalised scores of a country on all four pillars related to the knowledge economy: economic incentive and institutional regime; education; innovation; and ICT.
* The Knowledge Index (KI) measures a country’s ability to generate, adopt and use knowledge. The index is based on key variables in the three knowledge pillars: education; innovation; and ICT.
Source: World Bank (2012a).
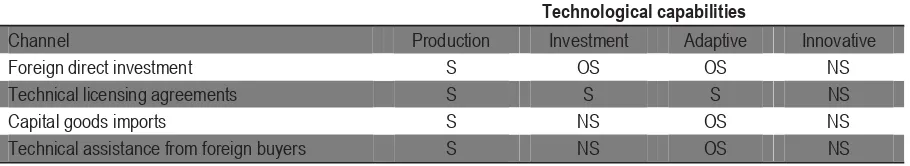
Table 6.4. Major channels of International technology transfer to Indonesia and their impact on the development of local technological capabilities
Technological capabilities
Channel Production Investment Adaptive Innovative Foreign direct investment S OS OS NS Technical licensing agreements S S S NS Capital goods imports S NS OS NS Technical assistance from foreign buyers S NS OS NS
Note: S = successful, OS = occasionally successful, NS = not successful. Source: Wie (2005).
Indonesia’s investment in R&D is also low. Over the period 1987-97, there were only 182 scientists and engineers per million inhabitants engaged in R&D, and total expenditure on R&D (GERD) amounted to 0.07% of GDP. It had fallen to 0.05% by 2005 but rose to 0.06% in 2006 and reached 0.08% in 2009. These levels are comparable to the level of expenditure in Cambodia (0.05% of GDP in 2002), but very low compared to Singapore (2.2% in 2009), Malaysia (0.64% in 2006 and rising to 0.82% in 2008), Viet Nam (0.19% in 2002) and Thailand (0.21% in 2007).
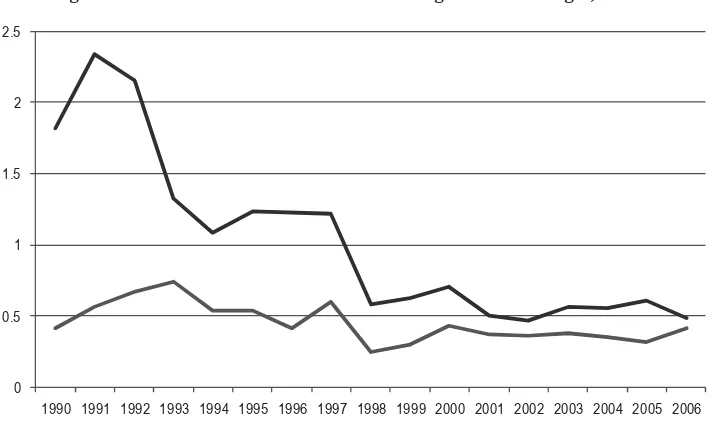
The Indonesian Government’s budget for ‘science and technology’ (which includes R&D, science services for information systems and statistical activities, and education and training in universities, ministries and non-ministerial institutions) as a share of the total state budget (or APBN), has decreased over the past thirty-five years. In 1970 it stood at 6.11% at a time when the Soeharto administration realized the importance of science and technology to development, but by 1991 it was 2.34% and had fallen to 0.49% in 2006 (Figure 6.9). Similarly, the proportion spent on R&D fell from 0.74% in 1994 to 0.42% in 2006.
Figure 6.9. Ratio of state S&T and R&D budget to state budget, 1990-2006
Source: Based on Pappiptek-LIPI and Central Bureau of Statistics, 1996-2007.
Indonesia’s publication performance improved steadily over the period 2000-2010 (Figure 6.10), growing from a low base of around 1 000 publications a year to just under 4 000 publications per year in 2010. Publications grew across all major scientific disciplines from 2000-2009 with information science and technology, engineering and medicine being three particular sources of growth. However, the growth rate compared to other Southeast Asian countries was relatively low – only Singapore, which started from a much higher base, experienced slower growth. Over a similar period, the number of publications in English language journals also grew although there was a decrease in the share of publications published in English. One explanation for this could be growth in co-publications with Japanese partners which increased more rapidly than co-publications with EU-27, United States and Australian partners. Overall, 74% of publications involve international collaboration, with Japan the largest source.
0 0.5 1 1.5 2 2.5
1990 1991 1992 1993 1994 1995 1996 1997 1998 1999 2000 2001 2002 2003 2004 2005 2006
Figure 6.10. Trends in scientific publications in Indonesia, 2000-10
Source: Science Metrix analysis of Scopus (Elsevier) database.
Figure 6.11. Positional analysis of Indonesia’s scientific publications, 2000-10
Source: Analysis of Scopus (Elsevier) database by Science Metrix. This combines the number of publications by scientific field (area of circles), the specialisation index (a measure of relative intensity in a field compared to the World average) and the average of relative citations (citations relative to the World average controlling for age and field).
0 500 1 000 1 500 2 000 2 500 3 000 3 500 4 000 4 500
2000 2001 2002 2003 2004 2005 2006 2007 2008 2009 2010
Pu
Analysis of the field of publications (Figure 6.11) shows that life sciences (clinical medicine, biology and biomedical sciences) are among the largest publication fields alongside ICT, enabling and strategic technologies, and physics and astronomy. However these three latter fields had a low relative citation impact compared with the World average between 2000 and 2010. The largest relative specialisation is in the fields of agriculture, biology and earth and environmental sciences. General science and tech-nology and historical studies were the highest-performing areas in terms of relative citation impact.
Indonesia’s patenting performance in terms of USPTO patents granted is very weak, averaging around 15 per year over the period 2000-2011 (Figure 6.12). In comparison, over 180 USPTO patents were granted to Malaysian-based applicants in 2011 alone whilst Thailand accounted for over 70. The number of patents registered in Indonesia itself is much higher, but the picture is dominated by the patenting behaviour of foreign-owned firms (Figure 6.13).
Figure 6.12. Trends in USPTO patents granted to Indonesia, 2000-11
Figure 6.13. Number of patents registered in Indonesia
Source: Directorate for Patent, Directorate-General for Intellectual Property Right, the Indonesian Ministry of Justice and Human Rights (2010).
6.3. Innovation policy: Institutional framework and policy orientations
Science and technology were considered important for development in the 1970s and government funding was substantial, but the perceived importance of S&T faded and support dwindled. Indonesia’s economic growth to middle-income status was trade-driven rather than science and technology-trade-driven, and industrial and related policies did not, until recently, attempt to nurture innovative capacity.
S&T-related policies and support programmes were developed within a legal framework based on the Fourth Amendment of the Indonesian Constitution (1945) and governed, since 2002, by Law 18/2002, which covers with the National System of Research, Development and the Application of Science and Technology. Currently, however, new legislation is being drafted to provide a better footing for the development of broader-based R&D and innovation policies geared towards improving the national innovation system.
Although Indonesia spends remarkably little on R&D and innovation, the public sector institutional landscape in which policies are formulated and implemented and in which most R&D is conducted is densely-populated, labyrinthine and highly fragmented, though there have recently been significant attempts to improve coordination. In essence, the institutional landscape has been and still is populated by multiple ministries or departments with an interest in research, some of which also have an interest in innovation; multiple agencies/institutions that both implement policies (e.g. by launching support programmes) and conducting R&D in their own multitudinous research institutions and laboratories; a small number of high-level advisory bodies that advise on overall strategic direction and help formulate policies affecting different parts of the national innovation system; and numerous other lower-level co-ordination mechanisms,
e.g. meetings and fora such as National Coordination Meeting for Research and
0
2001 2002 2003 2004 2005 2006 2007 2008
Technology and the Forum for Research and Technology Planning that are supposed to link and inform different elements of the innovation system. Until the recent formation of the National Innovation Committee (KIN), however, there was no single, independent high-level body with an oversight, steering and co-ordination function across the innova-tion system as a whole.
There are at least 19 ministries/departments with an interest in R&D, including the Ministry of Finance, the National Development and Planning Agency (BAPPENAS), and the Coordinating Ministry of Economic Affairs. The ministry with the largest budget for R&D is the Ministry of Research and Technology (RISTEK), which is responsible for the formulation, co-ordination and implementation of S&T policy at a national level and the promotion of technological development. RISTEK’s expenditure on R&D, however, is only 29% of the total government R&D budget. Other big departmental spenders are the Department of Agriculture (DEPTAN – 23.5%), the Department of Energy and Natural Resources (DESDM – 13.9%) and the Department of National Education (DEPDIKNAS – 12%), which organises R&D programmes involving universities.
RISTEK oversees seven agencies/institutions (LPNK RISTEK) that operate in a fairly autonomous fashion and report not only to RISTEK but also directly to the Presidential Office. Six of them conduct R&D. The largest R&D spenders are the Indonesian Institute of Sciences (LIPI) and the Agency for the Assessment and Application of Technology (BPPT).
x LIPI accounted for 14.1% of the government R&D expenditure in 2006 and supports research nearer the ‘science’ end of the spectrum, though it opened a Centre for Innovation in 2005 in an attempt to establish links with industry.
x BPPT accounted for 5.8% of the R&D budget and focuses primarily on work at the ‘technology’ end of the spectrum, but it also seeks to strengthen the competitive-ness of industry via support for technology transfer and related activities. At any one time, BPPT operates around 12 R&D programmes and receives funds both from RISTEK and directly from the Ministry of Finance, the Ministry of Education and others. Concerning innovation, it supports the Business Innovation Centre, set up in 2005 to promote innovation in industry and provide incubators for start-ups, and greater emphasis is being placed on the construction and management of high-tech parks. By 2025, it hopes to work 100% for industry and to receive only 50% of its budget from government.
Along with RISTEK, the ministry with the biggest interest in innovation is the Ministry of Industry (DEPPERIN), which is responsible for 4.1% of government spending on R&D. Its R&D and innovation-related activities are co-ordinated by the Agency for Research and Development of Industry, which oversees 32 different applied research and service organisations (10 focusing primarily on applied research; 11 specialising in specific commodities; and 11 operating as regional centres). The Ministry of Industry is also responsible for setting R&D priorities for the transportation, ICT, agribusiness and basic manufacturing sectors.
programme development, innovation in business and industry, innovation cluster development, innovation-related incentives and regulations, and the economic, social and cultural aspects of innovation. KIN is charged with advising the government on matters concerning the development of the innovation system. It is currently contributing to the government’s proposal for a new bill designed to embed national innovation system concepts in the legal framework governing innovation, though its main task is to produce a plan for a National Innovation Policy by 2014.
Around the time KIN was formed, another advisory body, the National Economy Committee (KEN), was set up to work closely with the Coordinating Ministry for Economic Affairs, and one of KIN’s first tasks was to contribute, along with KEN, to the formulation of the Master Plan for the Acceleration and Enlargement of Indonesian Economic Development (MP3EI) launched by the President in 2011 – an ambitious attempt to maintain high growth (7%-9% annually) while transforming the economy from a natural resource and trade-driven economy to an investment and innovation-driven economy. The plan has three main pillars: the development of six economic corridors throughout the archipelago; the development of strong links with other ASEAN countries and other countries in the world; and strengthening human resource, science and innovation capacity.
Other advisory bodies established before KIN and KEN continue to function, though how they will all interact in the future is as yet unclear. The National Research Council (DRN) was set up in 1984 to identify and define S&T development paths and priorities and to advise on the national S&T policies formulated by RISTEK. It is charged with producing National Research Agendas (NRAs) and has produced two to date covering the periods 2005-2009 and 2010-2014. Since 2010, it has also managed ‘Incentive Research’, a programme funded by RISTEK. There is also the Indonesian Academy of Science (AIPI), established in 1991, which continues to advise the government on the course of scientific developments, and numerous Local Research Councils (DRDs) that help local government to map S&T needs and suggest S&T development paths.
Figure 6.14. The S&T vision in the Indonesian Development Plan, 2010-14
Source: RISTEK.
6.4. Actors of the national innovation system (NIS)
6.4.1. Business sector
The service sector accounted for 38% of total valued added in 2011, with industry accounting for 45% and agriculture the remaining 17%, though agriculture still employed 38% of the labour force (of 118 million) in 2010 (World Bank, 2012b). Moreover, in 2006, 96.2% of the workforce was employed in SMEs, which accounted for 53.3% of GDP (APEC SME Innovation Centre, 2007).
Private sector R&D and innovation activity is limited and largely concentrated in the manufacturing sector, which is still predominantly composed of medium-low and low technology SMEs and a much smaller number of larger firms and MNCs. As shown earlier, however, private sector investment levels in R&D are very low, with the public sector dominating expenditure. The vast majority of Indonesian companies do not invest in R&D and many are reliant instead on technologies developed elsewhere. Some, however, especially those located in high tech sectors with export potential, are increasingly interested in raising R&D competence levels and have started to co-operate with foreign research institutions.
As noted earlier, FDI levels in Indonesia are modest, accounting for just 2.1% of GDP in 2011. Most of this is in medium-high and high tech manufacturing, but little R&D is performed by MNCs in Indonesia. There would seem to be limited productivity spillovers, technology transfer and technological learning, which could increase the propensity of indigenous companies to invest in R&D and innovation.
A number of surveys over the last decade or so have thrown a little light on the extent of innovative activity in Indonesia and the barriers to it. One survey of 167 000 SMEs in 1999 (Kawasanto, 1999) found that 68% of SMEs encountered considerable techno-logical difficulties, while another, conducted a few years later (Sakya, 2005), found that innovation was largely confined to medium-sized firms (15% of the population) and that only 11.5% of this sub-group attempted to manage technological change and innovation. These indications of low levels of innovative activity were further supported by the results of a survey of 14 000 large and medium-sized enterprises in 2007 (reported in Hidayat et al, 2011), which revealed that nearly 90% of firms had not conducted any innovation-related activities in the previous three years.
6.4.2. Higher education institutes (HEIs)
The size of the student body has increased rapidly in recent years. In 1970, 237 000 students were enrolled in 450 private and government-funded HEIs; in 1990, there were 1.5 million students in 900 HEIs (Schüller et al, 2011); but by 2008/9 there were over 4.28 million students in 2 975 HEIs (Indonesian Ministry of Education, 2011). This figure includes universities, academic institutes, schools of higher learning, academies and polytechnics. Of these, 83 were state/public institutions, while the remainder were privately owned. The four most renowned universities are the Universitas Indonesia (UI), the Universitas Gadja Mada (UGM), the Institut Partanian Bogor (IPB) and the Institut Teknologi Bandung (ITB) (Schüller et al, 2011).
Funding for research comes largely from government sources (74% in 2004 – see LIPI, 2006), and many state-owned HEIs, have their own research centres. The univer-sities’ share of GERD, however, is low. During 2000-2002, for example, it stood at just 5.6% (UNESCO, 2008). R&D also accounted for a relatively low share (5.0%) of the overall HEI budget in 2007, although 40% of academics are said to engage in research (Indicator IPTEK, 2009).
Given the very modest levels of expenditure on R&D in the university sector, it is not surprising that publication performance in international journals is low, patenting activity is rare and interaction with the private sector limited, although some researchers within the HEI sector do perform contract research for industry and some competitive government schemes do exist to encourage university-industry research linkages. However, constraints on both spending research budgets (e.g. the need to return all unspent allocations at the end of every fiscal year) and on the accumulation of additional funds (all income generated from industry projects has to be transferred to the Ministry of Finance) act as major disincentives to the increased involvement of universities in joint activities with industry.
6.4.3. Public research institutes (PRIs)
The bulk of R&D in Indonesia is performed by PRIs, specifically government research institutions (GRIs). As noted in Section 6.3, there are seven research institutes/agencies that report to RISTEK and the presidential office (only one of which – BAPETEN, the Nuclear Energy Regulatory Board – does not undertake research), and 16 other research institutes/agencies that report to other government ministries or departments. The GRIs associated with the seven ‘non-departmental’ agencies account for nearly 29% of government expenditure on R&D in the government sector, while the ‘departmental’ GRIs account for around 70%. The small residual funds the R&D activities of local government.
The actual number of research centres or laboratories conducting research is difficult to ascertain with any accuracy, though it is very much larger than the number of GRIs since some conduct research on a number of sites. According to one source, for example, BPPT had “24 centres and an equal number of labs” (IDRC, 2007), while the BPPT website states that BPPT has 17 research centres covering the areas of climate and artificial rain; aero gas dynamics and pressures; ceramics; energy; starch production; structural testing; oceanic surveys; information science and technology; machine production and automation; biotechnology; hydrodynamics; seashore dynamics; polymers; environmental technology; thermodynamics; engineering centres; and technology incubators.
electronics, components and material sciences; and calibration, instrumentation and metrology. Furthermore, outside of the RISTEK GRIs there are at least 45 other research institutions concerned with agriculture, veterinary science, medicine, the natural sciences and technology. Moreover, as noted earlier, the 32 research centres of the Agency for Research and Development of Industry conduct applied research and offer a range of services to industry, while at a local level, 78 research institutions are co-ordinated by the Ministry of Internal Affairs (Nugroho et al., 2011).
What can be said with more certainty, however, is that most of the money spent by GRIs on R&D supports projects in engineering and technology (32%) and agricultural and environmental sciences (30%), with natural sciences and social science each taking 18% of the budget and medical sciences and the humanities each taking a further 1% (RISTEK, 2010b).
6.4.4 Linkages between innovation actors
Historically, the linkages between the various R&D and innovation performers in the Indonesian national innovation system have been tenuous. Most research is conducted within GRIs, which tend to operate independently, and there are few research connections between the GRIs and university research units. Similarly, research linkages between GRIs and universities and the small industrial R&D community have been rare, with public sector inputs into the innovation process conspicuous by their absence. Some of the policies and programmes mentioned in Section 6.3 are attempting to rectify these weak linkages, but much still remains to be done.
6.5. Human resources
The proportion of GDP that Indonesia spends on education has increased over the past twenty years, as has the proportion spent on higher education. In 1990 the education share of GDP was 0.7%. In 2007 it was 3.5%. Similarly, the higher education share increased from 0.14% to 0.27%. Comparing trends internationally, however, Indonesia still lags considerably behind some of its ASEAN neighbours. Even by 2002, for example, the share for education had reached 8.1% in Malaysia and 5.0% in Thailand, while the share for higher education had reached 2.6% in Thailand and 2.2% in South Korea. The proportion of first degree holders in the workforce in 2005 was also low (3%) compared to the situation in countries such as the United States (39%), Japan (23%) and the Philippines (19%), which had the highest ratio amongst the ASEAN countries (Pappiptek LIPI, 2009a).
The scientific workforce is also static in terms of mobility. BPPT’s Annual Report (BPPT, 2010), for example, notes that there has been little movement of its researchers to industry or vice versa. There are a very limited number of co-operative projects (the Annual Report mentions 46), and there are some short-term secondments, but real mobility between the public and private sectors is extremely limited. Scholarships are available, however, for bright Indonesian students to study abroad, providing them with an opportunity to enhance their own career prospects and Indonesia with an opportunity to enhance its scientific competence levels, but the fear of students pursuing their careers elsewhere in the world is very real.
6.6. SWOT analysis
Based on the material presented above, several strengths and weaknesses of Indonesia’s NIS can be identified, along with future opportunities and threats. These are summarised in Table 6.5.
In terms of strengths, Indonesia’s rise to middle-income status and continued high GDP growth, notwithstanding the dip and recovery associated with the Asian crisis of the late 1990s, has largely been based on trade related to its plentiful supply of natural resources, e.g. gas, oil, coal and forest and marine produce. Good trade links with Japan and the United States have also recently been complemented by improved links with its ASEAN neighbours and China, following the signing of trade agreements, and Indonesia has risen to 44th in terms of the World Economic Forum’s ranking of international competitiveness.
Innovation has played little role to date in Indonesia’s success, but there has been an improved contribution of total factor productivity (TFP) to output growth and there are indigenous pockets of concentrated S&T and R&D expertise, especially in the public sector, where most expenditure on research occurs. A small number of well-known universities produce qualified scientists and conduct research in an expanding higher education sector, while in the private sector a small cadre of innovation-oriented companies have grown to appreciate the benefits of innovation. There have also been marked recent attempts by government to develop policies geared towards knowledge- and innovation-related growth, with an accompanying emphasis on new co-ordination mechanisms to oversee and ensure coherent approaches to policy development.
Table 6.5. Summary SWOT (strengths, weaknesses, opportunities, threats) analysis
Strengths Weaknesses
x Strong natural resource base
x High trade-based growth rates largely based on natural resources
x Good trade links with Japan and the United States and improving trade links with regional neighbours and China
x Reasonable levels of international competitiveness
x Improved contribution of TFP to output growth
x Pockets of concentrated S&T and R&D expertise, though primarily in the public sector
x Expanding higher education sector and small number of well-known universities
x Small cadre of companies appreciative of the benefits of innovation
x Recent attempts to focus government policy on innovation-related growth
x Recent attempt to improve overall co-ordination of government R&D and innovation policies
x Low GDP per capita and high poverty levels
x Slow shift away from a low technology base
x Low productivity levels and TFP growth rates
x Modest and highly volatile levels of FDI, with few technology or innovation-related spillovers
x Underdeveloped infrastructure, including the ICT infrastructure
x High perceived levels of bureaucratic inefficiency and corruption
x High barriers to business formation
x Limited access to capital for innovation
x Low public and private investment in R&D
x A system-wide failure to generate and diffuse technology
x A low-ranked higher education and training system
x Small number of researchers and scientists for a country of its size
x Poor publication and patent performance
x Highly fragmented R&D and innovation governance structure, with few attempts at overall co-ordination until recently
x Lack of indicators and evidence base to underpin innovation policy
Opportunities Threats
x Appreciable innovation potential and scope for moving up value chains
x Large, young population
x Scope for improving qualified human resource base
x Market expansion in Southeast Asia and China
x Scope for more coherent R&D and innovation policies
x Scope for more innovation-friendly FDI
x Scope for raising S&T competence levels via greater international co-operation
x Scope for making public sector R&D more relevant to industry needs
x Scope for increasing private sector involvement in R&D and lowering the barriers to innovation
x Scope for service sector innovation
x Volatile global financial situation
x Increased competition from emerging and developed countries
x Depletion of natural resource base and/or related problems of environmental degradation
x Continued emphasis on trade-based rather than knowledge-based growth
x Continued underinvestment in infra-structure, higher education and R&D
x Failure to attract/retain qualified human resources
x Inadequate incentives for innovation generally
x Inadequate incentives for innovation-friendly FDI
Many aspects of Indonesia’s overall infrastructure remain underdeveloped, and the ICT infrastructure in particular lags behind developments in some of its closest neighbours. Perceived levels of bureaucratic inefficiency and corruption are high and there are many barriers to the formation of new companies and the efficient functioning of existing firms. These include limited access to capital for innovation, a weak venture capital sector and inefficient regulatory, tax and IPR regimes. There is low public and private investment in R&D, limited S&T and R&D capability in industry and a system-wide failure to generate and diffuse technology adequately, as demonstrated by Indonesia’s low ranking in terms of the World Bank’s Knowledge Economy Index.
Despite the fact that Indonesia’s expenditure on education and higher education is expanding, expenditure as a proportion of GDP is still low compared to some of its neighbours. Correspondingly, Indonesia produces a low number of scientists and researchers for a country of its size; publication and patent performance is weak; and there are very weak links between the public sector, where most S&T competence is to be found, and industry.
Although S&T was seen as an important determinant of development in the 1970s, this focus disappeared almost entirely over the next 30 years, with a very limited government focus on S&T, R&D and innovation until very recently. Declining levels of expenditure also created problems of critical mass given the extremely diverse and fragmented set of public sector actors concerned with both the implementation of policies and the conduct of R&D and innovation-related support services. Policy formulation also continues to be hindered by a paucity of adequate data and intelligence on the nature and scope of R&D and innovation-related activities in the country.
The limited steps Indonesia has taken towards an innovation-oriented economy represent both a weakness to date and an opportunity to take such steps in the future, since there is considerable innovation potential and scope for moving up innovation-oriented value chains. The country has a large, young population and there is ample scope for improving the education system and the quality of the human resource base. A large indigenous market and expanding markets in both the ASEAN area and China also augur well for the future.
All this will require more coherent approaches to the formulation and implementation of innovation-related policies, with a particular emphasis on strategies geared towards the attraction of innovation-friendly FDI, efforts designed to raise scientific competence levels via increased international co-operation, and initiatives designed to make public sector R&D more relevant to industry’s needs. Better mechanisms to stimulate private sector involvement in R&D and lower the barriers to innovative activities are also needed, and given the increasing importance of the service sector in the national economy, there is scope for a new emphasis on service sector innovation.
References
Alisjahbana, A. (2009), “Revisiting Indonesia’s Sources of Economic Growth and its Projection Toward 2030”, Working Paper in Economics and Development Studies, No. 2009/05, Padjadjaran University Bandung.
APEC SME Innovation Centre(2007), Innovation Briefing, No. 3, June 2007, www.apec-smeic.org/newsletter/newsletter_read.jsp?SEQ=387.
APJII (2010), Statistics of APJII. APJII (Indonesian Internet Service Providers
Association), www.apjii.or.id/dokumentasi/statistik.php, viewed 12 December 2010.
APO (2012), APO Productivity Databook 2012, Asian Productivity Organization, Tokyo.
BPS, 2011. Data Strategis (Strategic Data). Report. Jakarta: Biro Pusat Statistik (Central Bureau of Statistics), available: www.bps.go.id/download_file/data_strategis_2011.pdf
[online].
Branstetter, L., R. Fisman and C.F. Foley (2006), “Do Stronger Intellectual Property Rights Increase International Technology Transfer? Empirical Evidence from US firm-level Panel Data”, Quarterly Journal of Economics 121(1), pp. 321-349.
DRN (2010), “Agenda Riset Nasional”, Report, Dewan Riset Nasional (DRN), Jakarta.
Hidayat, D., M. Simamora and D. Prihadyanti (2011), Review of Indonesian National Innovation System, Bangkok (forthcoming).
Indikator IPTEK (2009), Indikator Iptek [Science and Technology Indicators], LIPI, Jakarta.
ITU (International Telecommunications Union ) (2012), “World Telecommunications and ICT Database”, International Telecommunications Union,
www.itu.int/ITU-D/ict/statistics/.
Kenny, M., K. Han and S. Tanaka (2002), “Scattering Geese: The Venture Capital Industries of East Asia: A Report to the World Bank”, Berkeley Roundtable on the International Economy, Paper BRIEWP146.
Kominfo (2010), Komunikasi dan Informatika Indonesia: Whitepaper 2010 [2010 Indonesia ICT Whitepaper], Pusat Data Kementrian Komunikasi dan Informatika, Jakarta.
Manggalanny, M.S. (2010), “Indonesia Infrastructure - Internet Statistic 2010 and Projection: The Latest Trend. Presentation at Satudunia Workshop on Internet and Civil Society”, July.
Nugroho, Y. ( 2011), Citizens in @ction: Collaboration, participatory democracy and freedom of information – Mapping contemporary civic activism and the use of new social media in Indonesia. Report. Research collaboration of Manchester Institute of Innovation Research, University of Manchester and HIVOS Regional Office Southeast Asia. Manchester and Jakarta: MIOIR and HIVOS.
Nugroho, Y. (2011b), “Opening the black box: The adoption of innovations in the voluntary sector – The case of Indonesian civil society organizations”, Research Policy 40(5), pp. 761-777.
OECD (2010a), Economic Surveys: Indonesia 2010, OECD, Paris.
OECD (2010b), Investment Policy Reviews: Indonesia 2010, OECD, Paris.
Pappiptek LIPI, (2009a), Indikator Iptek (Science and Tehcnology Indicators). Report. Jakarta: LIPI.
Pappiptek-LIPI (2009b), Survei Inovasi Sektor Industri Manufaktur [Innovation Survey in the Manufacturing Industry Sector], LIPI, Jakarta.
Park, W.G. (2008), “International Patent Protection: 1960-2005”, Research Policy 37, pp. 761-766.
RISTEK (2010a), Statistics on “R&D of Government Research Institutions – 2006”, paper version provided to the OECD delegation, RISTEK, Jakarta.
RISTEK (2010b), Indikator Ekonomi Berbasis Pengetahuan Indonesia 2010
[Knowledge-based Economy Indicator Indonesia 2010], Ministry of Science & Technology, Jakarta.
Scheidt, B., D. Tunger, S. Haustein and C. Holzke (2011), “Bibliometric Analysis: Asia-Pacific Research Area 2010”, Commissioned by the International Bureau of BMBF at DLR. Julich Forschungzentrum.
Sulaeman, A. and I. Pawennei (2010), Jejaring Riset Pusat dan Daerah: Perspektif Kelembagaan dan Kebijakan, Dewan Riset Nasional [National Research Council], Jakarta.
Taufik, T.A. (2004), “Penyediaan Teknologi, Komersialisasi Hasil Litbang, dan Aliansi Strategis”, P2KDT – BPPT dan KRT. BPPT.
UNCTAD (2006), World Investment Report 2006, UNCTAD, Geneva.
UNCTAD (2009), World Investment Report 2009, UNCTAD, Geneva.
UNCTAD (2010), World Investment Report 2010, UNCTAD, Geneva.
UN (2012), United Nations Commodity Trade (Comtrade) Statistics Database, United Nations, New York.
USPTO (US Patent and Trademark Office) (2012), “Patents by Country, State, and Year - All Patent Types”, A Patent Technology Monitoring Team Report, December 2011.
WEF (World Economic Forum) (2012), The Global Competitiveness Report 2011–2012, World Economic Forum.
Wie, T.K. (2005), “The Major Channels of International Technology Transfer to
WIPO (2006), Compilation of Manuals, Guidelines and Directories in the Area of Intellectual Property (IP) Portfolio Management Customized for the Association of Southeast Asian Nations (ASEAN) Member Countries, World Intellectual Property Organization, Geneva.
World Bank (2012a), Knowledge Assessment Methodology (KAM) website,
http://web.worldbank.org/WBSITE/EXTERNAL/WBI/WBIPROGRAMS/KFDLP/EXTU NIKAM/0,,menuPK:1414738~pagePK:64168427~piPK:64168435~theSitePK:141472 1,00.html.
World Bank (2012b), World Development Indicators, accessed July 2012.
http://databank.worldbank.org.