Isolation rate of influenza specimens from influenza surveillance at several
public health centers and hospitals in Indonesia in 2013
Nur Ika Hariastuti, Eka Pratiwi, Vivi Setiawaty
Center for Research and Development of Biomedical and Basic Health Technology, National Institute of Health Research and Development, Ministry of Health, Jakarta, Indonesia.
Corresponding address: Nur Ika Hariastuti, MS Email: [email protected]
Received: May 02, 2016; Revised: October 28, 2016; Accepted: November 25, 2016
Abstrak
Latar belakang: Surveilans influenza di Puskesmas dan Rumah Sakit diperlukan untuk memantau aktivitas
virus influenza dan tingkat keparahan penyakit di masyarakat. Data surveilans kemudian dilaporkan ke WHO, untuk merumuskan rekomendasi dalam menentukan jenis kandidat vaksin influenza tahun berikutnya. Penelitian ini bertujuan untuk mengisolasi virus influenza yang dikumpulkan dari berbagai kepulauan Indonesia, baik dari kasus ringan maupun berat.
Metode: Studi ini merupakan bagian dari surveilans Influenza Like Illness (ILI) dan Severe Acute Respiratory Infection (SARI) yang rutin dilakukan oleh Badan Litbangkes. Dalam sistem ILI ada 26 sentinel Puskesmas tersebar di berbagai provinsi di Indonesia. Sementara surveilans SARI dilakukan di 6 rumah sakit pada 6 pulau besar di Indonesia. Isolasi spesimen influenza dilakukan dengan menggunakan sel Madin Darby Canine Kidney (MDCK) menurut pedoman WHO.
Hasil: Rata-rata jumlah spesimen Polymerase Chain Reaction (PCR) positif dari masing-masing daerah adalah
24,12 untuk ILI dan 8,33 untuk SARI. Sedangkan rata-rata jumlah spesimen yang dapat diisolasi dari masing-masing daerah untuk ILI adalah 1,77 dan 0,83 untuk spesimen SARI. Spesimen tersebut terdiri dari influenza B (Brisbane, Florida, dan Wisconsin), H1N1pdm09, dan H3N2. Tingkat isolasi yang diperoleh pada penelitian ini (7,3% untuk ILI dan 10% untuk SARI) sebanding dengan lamanya waktu perjalanan yang juga mempengaruhi suhu spesimen.
Kesimpulan: Persentase spesimen influenza yang dapat diisolasi adalah 7,3% untuk ILI dan 10% untuk
SARI. Mayoritas virus influenza yang beredar di Indonesia yang ditemukan dalam penelitian ini sesuai dengan rekomendasi WHO untuk komposisi vaksin. (Health Science Journal of Indonesia 2016;7(2):75-79)
Kata kunci: Isolasi influenza, ILI, SARI
Abstract
Background: Influenza surveillance in the public health centers (PHC) and hospitals is conducted to monitor influenza activity and severity in the community. The data reported to the WHO, to generate recommendations for the next vaccine candidate. This study aimed to isolate the influenza virus that spread in the Indonesia archipelago, from mild and severe cases.
Methods: The study is part of ILI and SARI surveillance which routinely conducted by the NIHRD. In ILI system there were 26 PHC sentinels spread in various provinces in Indonesia. While SARI surveillance conducted in 6 hospitals representing 6 major islands in Indonesia. We isolated the influenza specimens in the Madin Darby Canine Kidney (MDCK) cells according to WHO guideline.
Results: The average number of Polymerase Chain Reaction (PCR) positive specimens from each area was 24.12 for ILI and 8.33 for SARI. While the average number of specimens that can be isolated from each region for ILI was 1.77 and 0.83 for SARI specimens. It consists of flu B (Brisbane, Florida, and Wisconsin), H1N1pdm09, and H3N2. The isolation rate in this study (7.3% for ILI and 10% for SARI) is correspond to the transportation length that also affecting the specimens temperature.
Conclusion: The percentage of influenza specimens that can be isolated for ILI was 7.3% and 10% for SARI. The majority of influenza viruses circulating in Indonesia that found in this study are in accordance with WHO recommendation for vaccine composition. (Health Science Journal of Indonesia 2016;7(2):75-79)
Influenza is a disease that is often underestimated. However, in some cases of influenza the viruses
can cause devastating effects such as pandemics.1
More than 50 million people died in the case of the
Spanish flu in 1918, after that there were also the Asian flu pandemic, Hong Kong flu, Russian flu, and most recently the swine flu pandemic in 2009.2
This occurs because influenza viruses can change
rapidly through the mechanism of antigenic drift and antigenic shift.3,4 Even though this disease can be prevented by vaccination especially for seasonal
influenza, it must be done regularly. It is due to a person’s immune response against influenza is
decreased over time and the virus continues to make genetic changes.5,6
Indonesia once got the world’s attention with the
finding of deadly avian influenza cases in humans
cluster in 2006. Until June 2014, the highest number
of H5N1 human case is still in Indonesia with 197 confirmed.7 As geographical conditions and the
vast Indonesian archipelago calls for high vigilance
to control influenza virus transmission. Moreover
is the climate uncertain condition, dry and rainy
seasons mix through the year. Influenza surveillance to monitor the pattern of the spread of influenza in Indonesia conducted by Influenza Like Illness (ILI)
system which consist over the area of Ambon, Banda Aceh, Bangka Belitung, Bandung, Banjarmasin, Balikpapan, Batam, Bengkulu, Denpasar, Jambi,
Jayapura, Kupang, Lampung, Makassar, Malang,
Mamuju, Mataram, Medan, Merauke, Padang, Palu, Palembang, Palangkaraya, Pekan Baru, Semarang, Yogyakarta. While the Severe Acute Respiratory
Infection (SARI) surveillance conducted a hospital-based system in Medan-North Sumatra, Wonosari-DIY, Mataram-NTB, Balikpapan-East Kalimantan, Bitung-North Sulawesi, and Ambon-Maluku.
This study aimed to isolate the influenza virus that
spread in the Indonesia archipelago, from mild and severe cases. The information about the spreading virus will be reported to the WHO, as database to generate recommendations to determine the next vaccine seed in order to prevent the infection from dominant viruses in the area.
METHODS
The research is part of ILI and SARI surveillance
which routinely conducted by the NIHRD. In the
ILI system there were 26 sentinels spread in various
provinces, while SARI surveillance conducted in six hospitals in six different islands in Indonesia.
The ILI samples obtained were sent to examiner
laboratories from the PHCs to be examined by PCR, and then sent to the Center for Biomedical and
Basic Technology of Health (CBBTH) laboratory
as part of the National Institute of Health Research
and Development (NIHRD) for virus isolation. As
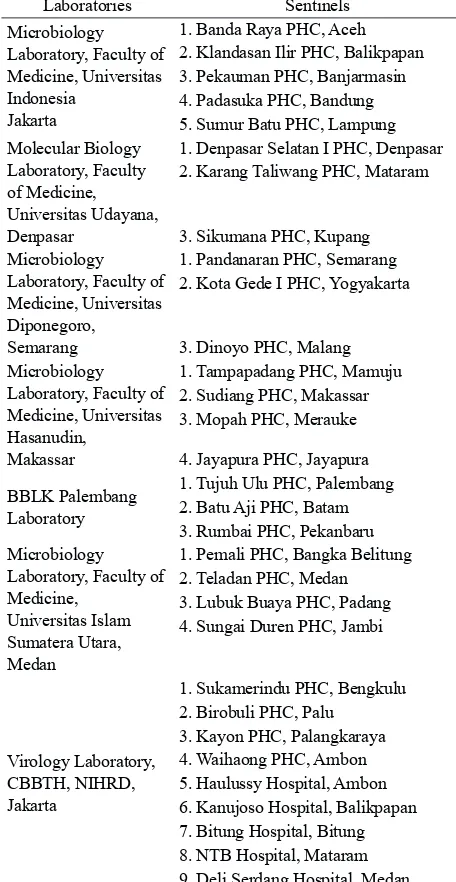
for SARI samples from hospitals directly sent to CBBTH laboratory for PCR test. Samples positive in the molecular examination then countinued for virus isolation. Sentinels grouping based on the examiner laboratory is shown in Table 1.
Table 1. Regional Laboratories Grouping for Sentinels
Laboratories Sentinels
Microbiology
Laboratory, Faculty of
Medicine, Universitas Indonesia
Jakarta
1. Banda Raya PHC, Aceh 2. Klandasan Ilir PHC, Balikpapan
3. Pekauman PHC, Banjarmasin
4. Padasuka PHC, Bandung
5. Sumur Batu PHC, Lampung
Molecular Biology
Laboratory, Faculty
of Medicine, Universitas Udayana, Denpasar
1. Denpasar Selatan I PHC, Denpasar 2. Karang Taliwang PHC, Mataram
3. Sikumana PHC, Kupang
Microbiology
Laboratory, Faculty of
Medicine, Universitas Diponegoro,
Semarang
1. Pandanaran PHC, Semarang
2. Kota Gede I PHC, Yogyakarta
3. Dinoyo PHC, Malang
Microbiology
Laboratory, Faculty of
Medicine, Universitas Hasanudin,
Makassar
1. Tampapadang PHC, Mamuju 2. Sudiang PHC, Makassar
3. Mopah PHC, Merauke
4. Jayapura PHC, Jayapura
BBLK Palembang Laboratory
1. Tujuh Ulu PHC, Palembang 2. Batu Aji PHC, Batam
3. Rumbai PHC, Pekanbaru
Microbiology
Laboratory, Faculty of
Medicine, Universitas Islam Sumatera Utara, Medan
1. Pemali PHC, Bangka Belitung 2. Teladan PHC, Medan
3. Lubuk Buaya PHC, Padang
4. Sungai Duren PHC, Jambi
Virology Laboratory,
CBBTH, NIHRD, Jakarta
1. Sukamerindu PHC, Bengkulu 2. Birobuli PHC, Palu
3. Kayon PHC, Palangkaraya
4. Waihaong PHC, Ambon 5. Haulussy Hospital, Ambon 6. Kanujoso Hospital, Balikpapan 7. Bitung Hospital, Bitung 8. NTB Hospital, Mataram
Virus isolation performed using the confluent MDCK
cells covered with inoculation sample and incubated
for 30 minutes at 37oC. Afterwards, cells were added
with media containing 2 µg/mL TPCK-trypsin. The inoculated cells were then incubated in humidified incubator with an atmosphere 5% CO2 for 5-7 days and observed for cytopathic effect (CPE). The viral titers tested with Hemagglutination Assay (HA). If the titer ≥4, then it can be proceeded with the Hemagglutination Inhibition (HI) test to determine
the strain. If the titer is <4, the isolate should go to the second passage.8,9,10
RESULTS
During 2013 the total specimens with positive PCR result were 627 for ILI and 50 for SARI. The total isolate obtained is 51 (ILI-SARI) and the isolation rate for ILI is 7.3% and SARI is 10%. All specimens
were shipped in cold chain procedures, despite of that the temperature increase was often occured. The virus isolations were conducted more than 1 week
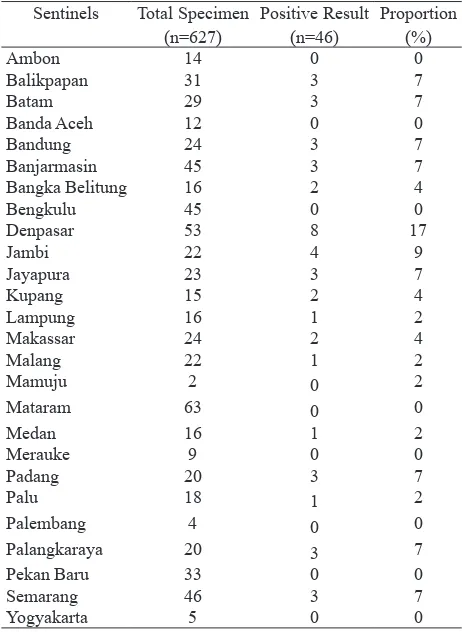
period from specimens collection (data not shown). Table 2. shows the most ILI specimens obtained from
Mataram Nusa Tenggara Barat. However the highest rate of isolated specimens comes from Denpasar
Bali. (17% out of 46 isolated specimens). Samples
from the Bangka Belitung, Bandung, Banjarmasin, Balikpapan, Batam, Jambi, Jayapura, Kupang,
Lampung, Medan, Makasar, Malang, Padang, Palu,
Palangkaraya, and Semarang that successfully
isolated were each ranging between 2-8%. Whereas
there were no samples from areas of Ambon, Banda Aceh, Bengkulu, Mamuju, Merauke, Mataram, Palembang, and Pekan Baru can be isolated. The average number of PCR positive specimens from each area was 24.12 and the average number of specimens that can be isolated from each region was only 1.77 isolates.
In SARI, the total specimens with positive PCR result
were 50 with the total isolate obtained is 5 (10.0%).
The most specimens were obtained from Balikpapan hospital East Kalimantan. While the least sample came from Ambon. The average number of PCR
positive specimens from each region was 8.3 and the
average number of specimens successfully isolated
from each hospital was 0.8 isolate (Table 3).
Table 2. Proportion of isolated specimens from ILI sentinels
Sentinels Total Specimen (n=627)
Positive Result (n=46)
Proportion (%)
Ambon 14 0 0
Balikpapan 31 3 7
Batam 29 3 7
Banda Aceh 12 0 0
Bandung 24 3 7
Banjarmasin 45 3 7
Bangka Belitung 16 2 4
Bengkulu 45 0 0
Denpasar 53 8 17
Jambi 22 4 9
Jayapura 23 3 7
Kupang 15 2 4
Lampung 16 1 2
Makassar 24 2 4
Malang 22 1 2
Mamuju 2 0 2
Mataram 63 0 0
Medan 16 1 2
Merauke 9 0 0
Padang 20 3 7
Palu 18 1 2
Palembang 4 0 0
Palangkaraya 20 3 7
Pekan Baru 33 0 0
Semarang 46 3 7
Yogyakarta 5 0 0
Table 3. Proportion of isolated specimens from SARI sentinels
Sentinels Total Specimen
Positive Result
Proportion (%)
Ambon 14 0 0
Balikpapan 31 3 7
Bitung 29 3 7
Mataram 63 0 0
Medan 16 1 2
Yogyakarta 5 0 0
Table 4. shows that 76% of the ILI total sample that were able to be isolated is fluB, which is consist of fluB-Brisbane, fluB-Florida, and fluB-Wisconsin. The H1N1pdm09 subtype has 15% part from the total ILI isolates and followed by H3N2 subtype with 9% of the total isolates. For SARI specimens 80% of the isolates were FluB and 20% of it were H1N1pdm09 (Table 4). While there is no specimen
H3N2 successfully isolated from SARI specimens.
Table 4. Total proportion of influenza type/subtype isolated from ILI and SARI
ILI SARI
Flu-B 76% 80%
H1N1pdm09 15% 20%
DISCUSSION
The successful isolation rate in this study is 7.3% for ILI specimens and 10% for SARI specimens.
According to Dr. Shailesh Pawar from India National
Influenza Center, the successful rate of specimens that isolated within 3 days from collection is about 20%.
If the specimens cannot be isolated within 48 hours, it
should be kept frozen and avoid freeze-thaw practice.11
Therefore the isolation rate in this study is adequate considering the time needed from specimen collections to the virus isolations is more than a week. The lenght of the shipment is due to the geographical conditions in Indonesian and limited modes of transportation that also affecting the specimens temperature.
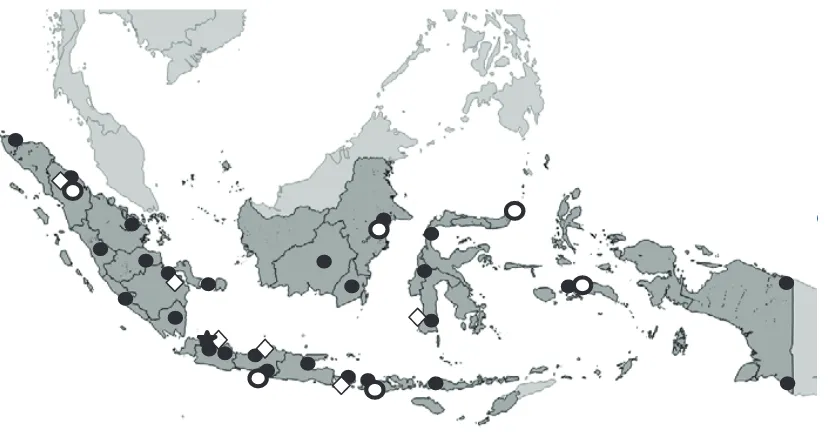
In addition to that, the regional laboratories for performing PCR is still limited; only 6 to support an
area of 1,904,569 km2 (Figure 1). Although influenza A and B viruses can last 24-48 hours without media,
but the ideal shipping period cannot be obtained in this study. Moreover, the success of virus isolation
is strongly influenced by the proper techniques of
specimen collection and handling to prevent damage to the virus in transport.12,13 Although the method (MDCK
cell culture) selected is known to be consistently good in influenza virus propagation.14 However passage
number is also play a role to the succesful virus isolation.
Based on the results it is known that most samples can be isolated were from the area of Denpasar Bali. These samples were obtained from the South Denpasar I PHC. PCR examination for the samples obtained was directly performed in the same city, since one of the six regional laboratories for molecular examination is in the city
of Denpasar Bali. Furthermore the human resources
in Denpasar regional laboratory has an excellent
qualification, since they always make good results in the external quality control organized by CBBTH. As the
most popular tourist destination in Indonesia, Bali also
provide sufficient transportation services. Therefore the
samples can be directly sent to CBBTH laboratory in
Jakarta with many choices of flight schedule. This is an
ideal condition that is expected to be implemented in all parts of Indonesia archipelago.
In cases of severe influenza requiring hospitalization,
it is often accompanied by other diseases. Infection with some bacteria such as Staphylococcus aureus,
Streptococcus pneumonia and Streptococcus pyogenes
is also very possible. The bacteria co-infection is
also affects the success rate of isolation, because the amount of bacteria that over dominant the virus. The
influenza virus usually enter the human body deeper after few days of infection, and more difficult to obtain
by nasal and throat swab collection.15
Influenza isolation rate
Flu
80%
H1N1pdm09
15%
20%
H3N2
9%
0
Figure 1. Map of ILI SARI sites, regional laboratory and CBBTH
Indonesia.
: ILI sites,
-Figure 1. Map of ILI-SARI sites, regional laboratory and CBBTH-NIHRD Indonesia.
: ILI sites, : SARI sites, : regional laboratory, : CBBTH-NIHRD
Influenza isolation rate
Flu
80%
H1N1pdm09
15%
20%
H3N2
9%
0
Figure 1. Map of ILI SARI sites, regional laboratory and CBBTH
Indonesia.
: ILI sites,
-Influenza isolation rate
Flu
80%
H1N1pdm09
15%
20%
H3N2
9%
0
Figure 1. Map of ILI SARI sites, regional laboratory and CBBTH
Indonesia.
: ILI sites,
: S
-Influenza isolation rate
Flu
80%
H1N1pdm09
15%
20%
H3N2
9%
0
Figure 1. Map of ILI SARI sites, regional laboratory and CBBTH
Indonesia.
: ILI sites,
s, : r
-Influenza isolation rate
Flu
80%
H1N1pdm09
15%
20%
H3N2
9%
0
Figure 1. Map of ILI SARI sites, regional laboratory and CBBTH
Indonesia.
-From Table 4 it can be seen that the type B influenza
is a type of specimens which is easiest to grow.
Influenza B and influenza C is a common type of influenza virus that infects humans. While influenza type A was first known as fowl plague and generally
infecting animals. Although in certain circumstances
influenza type A can also infect humans.2,4 It is also
one of the determining factors of success rate of
isolation of influenza A (H1N1pdm09 and H3N2)
that smaller when compared with specimens of
influenza B.
This study has some limitations both in the sentinel
setting and data collection. The small sample size is
caused by the specimens only chosen from PCR positive results. The sentinels are not randomly assigned,
instead they are chosen by the District Health Office. Future studies that cover the whole area of Indonesia in
random sampling method may result in comprehensive data that could represent Indonesia.
Up to this time the WHO still recommends that the
pentavalent influenza vaccine consist of influenza H1N1pdm09, H3N2, flu B Yamagata and Victoria.
This is in accordance with the results of the study that
showed the majority of influenza viruses circulating in Indonesia are influenza B, H1N1pdm09, and H3N2.
In conclusion, the percentage of influenza specimens
that can be isolated for ILI was 7.3% and 10% for
SARI. This rate is good cosidering the geographical conditions and the vast Indonesian archipelago. Moreover, the study could give a description about
influenza virus activity in Indonesia in 2013.
Acknowledgments
We would like to thank to Influenza Surveillance team in NIHRD, Center for Disease Control and Prevention, Public Health Centers, Hospitals, District Health Offices for good collaboration and cooperation. Thank you to WHO-Indonesia, CDC-Atlanta Jakarta Office, WHO-CC Melbourne who provided technical support. A special gratitude for Dr. Shailesh Pawar for his suggestions and encouragement.
REFERENCES
1.
Thomas JK, Noppenberger J. Avian influenza: A review. Am J Health-Syst Pharm. 2007;64:149-65.2.
Taubenberger JK, Morens DM. 1918 Influenza: The mother of all pandemics. Revista Biomedica. 2006;17:69-79.3.
Gauthier-Clerc M, Lebarbenchon C, Thomas F. Recent expansion of Highly Pathogenic Avian Influenza H5N1: A Critical review. Ibis. 2007; 149:202-14.4.
Taubenberger JK, Kash JC. Influenza Virus Evolution, Host adaptation, and pandemic formation. Cell Host & Microbe. 2010; 7: 440-51.5.
Yu H, Alonso WJ, Feng L, et al. Characterization of regional influenza seasonality patterns in China and implications for vaccination strategies: Spatio-Temporal Modeling of Surveillance Data. PLOS Medicine. 2013; Vol 10. Issue 11.6.
CDC. Key facts about seasonal flu vaccine. 2014. Available at: http://www.cdc.gov/flu/protect/key-facts.htm Accessed June 30, 2014.7.
WHO. Influenza at the human-animal interface summary and assessment as of 27 June 2014. 2014. Available at: http://www.who.int/influenza/human_animal_interface/ Influenza Summary_IRA_HA_interface_27June14. pdf?ua=1 Accessed July 10, 2014.8.
WHO. WHO Manual on animal influenza diagnoosis and surveillance. 2002. Available at: http://www. who.int/csr/resources/publications/influenza/en/ whocdscsrncs20025rev.pdf Accessed October 7, 2012.9.
Kawaoka Y, Neumann. Influenza virus methods andprotocols. In: Methods in molecular biology. Humana Press, USA. 2012: p. 1-227.
10.
Eisfeld AJ, Neumann G, Kawaoka Y. Influenza A virus isolation, culture and identification. Nature protocols. 2014;9:2663-81.11.
WHO global influenza surveillance network. Manual for the laboratory diagnosis and virological surveillance of influenza. 2011.12. Bean B, Moore BM, Sterner F, et al. Survival of influenza viruses on environmental surfaces. Journal of Infectious Disease. 1982;146:47-51.
13. Johnson FB. Transport of viral specimens. Clinical Microbiology Review. 1990;3(2):120-31.
14. Moresco KA, Stallknecht DE, Swayne DE. Evaluation and attempted optimization of avian embryos and cell culture methods for efficient isolation and propagation of low pathogenecity avian influenza viruses. Avian Diseases. 2010;54:622-6.