Lampiran i
PROSES PEMILIHAN SAMPEL
No Nama Bank
11 PT Bank Eksekutif Internasional Tbk √ √ √ BEKS
12 PT Bank Himpunan Saudara 1960 Tbk √ √ SDRA
13 PT Bank Internasional Indonesia Tbk √ √ BNII Sampel 5
14 PT Kesawan Tbk √ √ √ BKSW
20 PT Bank Nusantara Parahyangan Tbk √ √ BBNP
21 PT Bank OCBC NISP Tbk √ √ NISP Sampel 10
27 PT Bank Victoria Internasioanal Tbk √ √ √ BVIC
28 PT Windu Kentjana Internasional Tbk √ √ MCOR
29 PT. Bank Tabungan Negara, (Persero) Tbk
Lampiran ii
Data Penelitian (1) : Capital Adequacy Ratio ( CAR ) tahun 2008 - 2010
Data Penelitian(3) : Return on Asset ( ROA ) tahun 2008 – 2010
No. KODE 2008 2009 2010
1 BBKP 0.02 0.01 0.02
2 BNBA 0.02 0.02 0.02
3 BABP 0.09 0.18 0.24
4 BDMN 0.02 0.02 0.03
5 BNII 0.01 0.02 0.01
6 BMRI 0.03 0.03 0.03
7 MAYA 0.01 0.01 0.01
8 MEGA 0.02 0.02 0.02
9 BNGA 0.01 0.02 0.02
10 BBRI 0.04 0.04 0.05
11 BNLI 0.02 0.01 0.02
12 BSWD 0.02 0.03 0.03
13 NISP 0.01 0.02 0.01
14 PNBN 0.02 0.02 0.02
Data Penelitian (4) : Return on Equity ( ROE ) 2008 - 2010
No. KODE 2008 2009 2010
1 BBKP 0.19 0.16 0.20
2 BNBA 0.09 0.09 0.08
3 BABP 0.01 0.01 0.02
4 BDMN 0.15 0.11 0.18
5 BNII 0.09 (0.77) 0.07
6 BMRI 0.18 0.22 0.24
7 MAYA 0.04 0.04 0.07
8 MEGA 0.20 0.19 0.27
9 BNGA 0.08 0.16 0.24
10 BBRI 0.35 0.35 0.44
11 BNLI 0.12 0.13 0.21
12 BSWD 0.10 0.13 0.12
13 NISP 0.09 0.12 0.08
Data Penelitian (5): Net Interest Margin ( NIM ) 2008 - 2010
No. KODE 2008 2009 2010
1 BBKP 0.05 0.04 0.05
2 BNBA 0.07 0.07 0.06
3 BABP 0.05 0.06 0.06
4 BDMN 0.11 0.11 0.11
5 BNII 0.06 0.06 0.06
6 BMRI 0.05 0.05 0.05
7 MAYA 0.07 0.07 0.06
8 MEGA 0.05 0.05 0.05
9 BNGA 0.06 0.07 0.06
10 BBRI 0.10 0.09 0.11
11 BNLI 0.06 0.06 0.05
12 BSWD 0.05 0.05 0.06
13 NISP 0.05 0.05 0.05
14 PNBN 0.05 0.05 0.05
Data Penelitian (6) : BOPO 2008 - 2010
No. KODE 2008 2009 2010
1 BBKP 0.84 0.87 0.85
2 BNBA 0.82 0.82 0.86
3 BABP 0.97 0.99 0.97
4 BDMN 0.54 0.50 0.50
5 BNII 0.94 1.07 0.92
6 BMRI 0.42 0.45 0.42
7 MAYA 0.90 0.94 0.90
8 MEGA 0.83 0.86 0.78
9 BNGA 0.88 0.83 0.77
10 BBRI 0.73 0.78 0.71
11 BNLI 0.89 0.89 0.85
12 BSWD 0.80 0.75 0.73
13 NISP 0.86 0.84 0.85
Data Penelitian (7) : Loan to Deposit Ratio ( LDR ) tahun 2008 - 2010
Data Penelitian (8) : Laba Bersih tahun 2008 - 2010 ( Dalam Jutaan Rupiah )
No. KODE 2008 2009 2010
1 BBKP 368,780 362,191 492,599
2 BNBA 27,621,355 28,213,676 26,979,475
3 BABP 1,925,744 5,043,438 12,168,621
4 BDMN 1,530,433 1,532,533 2,883,468
5 BNII 468,697 352,828 606,140
6 BMRI 5,312,821 7,155,464 9,218,298
7
MAY A
40,965 41,099 76,954
8 MEGA 502,320 537,460 951,800
9 BNGA 678,189 1,568,130 2,548,153
10 BBRI 5,958,243 7,308,292 11,472,385
11 BNLI 452,409 480,155 996,649
12 BSWD 19,221 36,950 35,092
13 NISP 316,922 435,865 320,986
Data Penelitian (9) : Pertumbuhan Laba tahun 2008 - 2010 ( Y )
No. Kode 2,008 2,009 2,010
1 BBKP (0.02) (0.02) 0.26
2 BNBA 0.33 0.02 (0.25)
3 BABP 0.97 0.62 0.58
4 BDMN 0.23 0.23 0.47
5 BNII 0.25 0.00 1.08
6 BMRI 0.22 0.26 0.23
7 MAYA 0.01 0.00 0.46
8 MEGA (0.04) 0.07 0.08
9 BNGA (0.55) 0.40 0.34
10 BBRI 0.23 0.23 0.36
11 BNLI (0.09) 0.06 1.07
12 BSWD 1.27 0.92 0.05
13 NISP 0.26 0.37 0.26
14 PNBN (0.17) 0.30 0.37
Lampiran iii
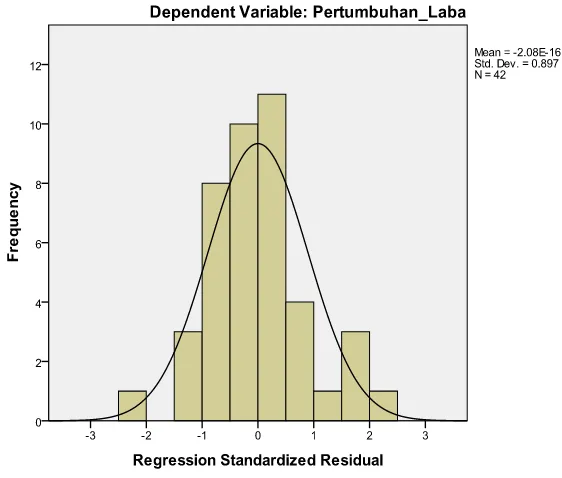
UJI ASUMSI KLASIK A. Uji Normalitas data
Gambar 4.1
Uji Kolmogorov- Smirnov
B. Uji Normalitas dengan Plot
Gambar 4.2
Uji Normalitas dengan Plot C. Uji Normalitas Data
Unstandardized
Residual
N 42
Normal Parametersa,b Mean .0000000
Std. Deviation .33974604
Most Extreme Differences Absolute .166
Positive .166
Negative -.117
Kolmogorov-Smirnov Z 1.076
Asymp. Sig. (2-tailed) .197
a. Test distribution is Normal.
b. Calculated from data.
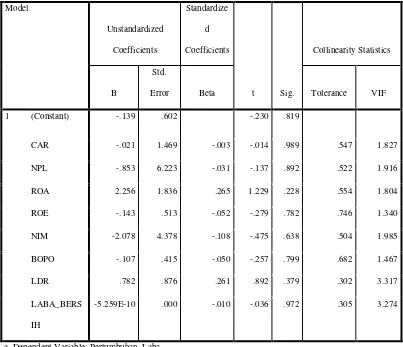
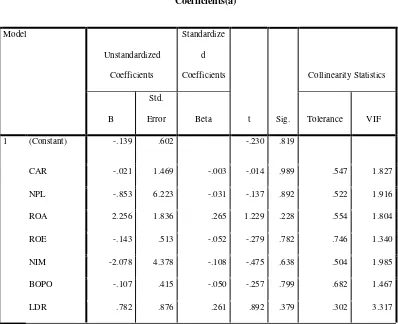
D. Uji Multikolinearitas
a. Dependent Variable: Pertumbuhan_Laba
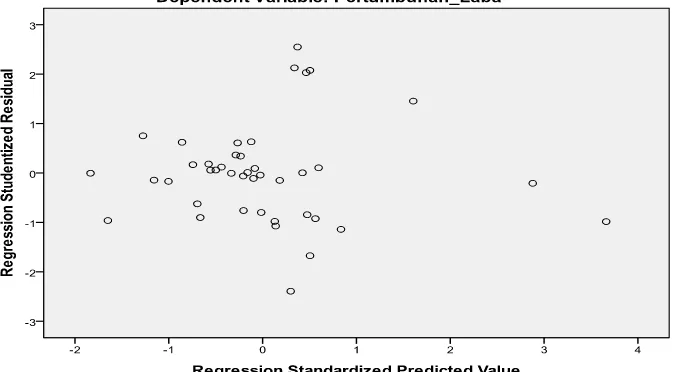
E. Uji Heterokedastisitas
Gambar 4.3 Uji Heterokedastisitas
Sumber: output SPSS yang diolah oleh penulis, 2012
F. Uji Autokorelasi
Tabel 4.3 Uji Autokorelasi
Model Summary(b)
Model R R Square Adjusted R
Square
Std. Error of the
Estimate Durbin Watson
1 .382a .146 -.061 .37869 1.941
c. Predictors: (Constant), LABA_BERSIH, NPL, ROE, BOPO, NIM, ROA, CAR, LDR
d. Dependent Variable: Pertumbuhan_Laba
Sumber: output SPSS yang diolah oleh penulis, 2012
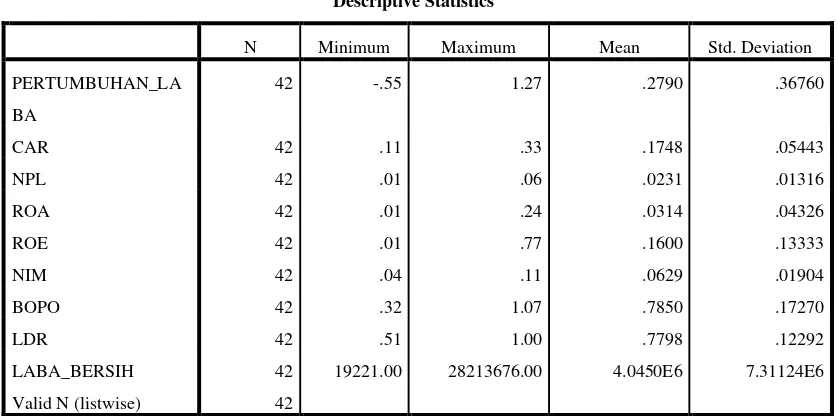
G. Statistik Deskriptif
LABA_BERSIH 42 19221.00 28213676.00 4.0450E6 7.31124E6
Valid N (listwise) 42
Sumber : output SPSS yang diolah oleh penulis, 2012
H. Uji Hipotesis
1. Uji Koefisien Determinasi
Tabel 4.5
c. Predictors: (Constant), LABA_BERSIH, NPL, ROE, BOPO, NIM, ROA, CAR, LDR
d. Dependent Variable: Pertumbuhan_Laba
Sumber: output SPSS yang diolah oleh penulis, 2012 2. Uji Signifikan Simultan (F-test)
Uji ANOVA (F-test)
a. Predictors: (Constant), LABA_BERSIH, NPL, ROE, BOPO, NIM, ROA, CAR, LDR b. Dependent Variable: Pertumbuhan_Laba
Tabel 4.7
Koefisien Uji ANOVA
Coefficients(a)
a. Dependent Variable: Pertumbuhan_Laba