Ca n dle st ick
Ch a r t in g
Ex pla in e d
An I n t r odu ct ion To Ca n dle st ick s
Br ou gh t t o you by:
FX - e book s.com
Forex Mentor by Peter Bain
The new
Leading Professional Currency Trading System
shows you how to trade currencies like the
Pros
!
Peter Bain
has put together a stunningly comprehensive forex course. He shows you exactly
how the professionals are doing it. All the benefits of a live trading seminar, but in the comfort
of your own armchair. We recommend checking out the video clips on the website
WHAT YOU WILL LEARN ...
•
Indicator
that beat out the other 99 as the most successful technical market pointer
•
How to use
futures data
to confirm the currency cash market trends.
•
Take money
from the Euro which puts an average $US760 on the table everyday!
•
How to use
hedge
your currency trades.
•
Learn these never revealed techniques in this
seminar video recording.
•
Watch and Listen
to a topic as many times as you need.
•
150 page
detailed trading manual.
See Table of Contents at the end of this page, 35
page Getting Started Guide
•
Real currency trading
examples
from the last
8 months
designed to further reinforce
every trading concepts
•
Access
to
daily pivots
for the 4 major pairs and "News not Noise" Forex news digest
and commentary.
Get on-going support from our members-only
mentorship
program which includes daily
examples, questions and answers, tips, articles, etc.
An I n t r odu ct ion To Ca n dle st ick s
There are t wo t ypes of ways t o analysis t he price of a st ock, fundam ent al analysis, and t echnical analysis. Fundam ent al analysis is used t o gauge t he price of a st ock based on t he fundam ent al at t ribut es of t he st ock, such as price/ earnings rat io, Ret urn on invest , and associat ed econom ic st at ist ics.
Technical analysis deals m ore wit h t he psychological com ponent of t rading a st ock, and is influenced for t he m ost part on em ot ionalism .
The t echnical analyst is seeking t o answer t he quest ion " how are ot her t raders viewing t his st ock, and how will t hat effect t he price in t he im m ediat e fut ure". in t he 1700s discovered t hat alt hough t here was link bet ween supply and dem and of t he rice, t he m arket s were also st rongly influenced by t he em ot ions of t he t raders.
Hom m a realized t hat he could benefit from underst anding t he em ot ions t o help predict t he fut ure prices. He underst ood t hat t here could be a vast difference bet ween value and price of rice.
This difference bet ween value and price is as valid t oday wit h st ocks, as it was wit h rice in Japan cent uries ago.
The principles est ablished by Hom m a in m easuring m arket em ot ions in a st ock are t he basis for t he Candlest ick Chart analysis, which we will present in t his sem inar.
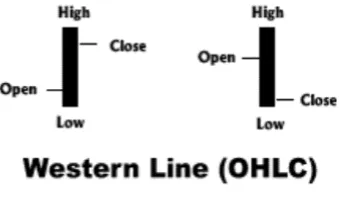
Ca n dle st ick vs. W e st e r n Ch a r t s
The West ern bar chart is m ade up of four parts com ponent s, open, high, low, and close. The vert ical bar depict s t he high and low of t he session, while t he left horizont al line represent s t he open and t he right horizont al line represent s t he close.
Figu r e 1
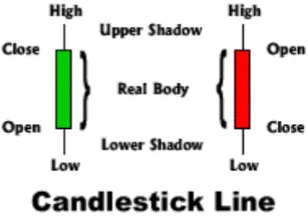
session’s price ext rem es. The shadow above t he real body is called t he upper shadow and t he shadow below t he real body is called t he lower shadow. The t op of t he upper shadow is t he high of t he day, and t he bot t om of t he lower shadow is t he low of t he day.
Figu r e 2
One of t he m ain differences bet ween t he West ern Line and t he Japanese Candlest ick line is t he relat ionship bet ween open and closing prices. The West erner places t he great est im port ance on t he closing price of a st ock in relat ion t o t he prior periods close. The Japanese place t he highest im port ance on t he close as it relat es t o t he open of t he sam e day. You can see why t he
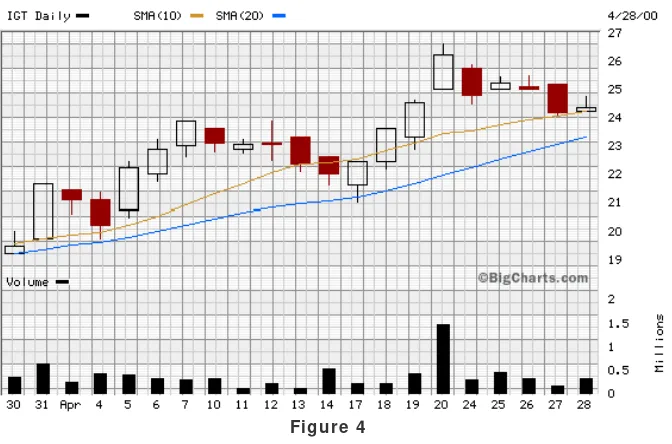
Candlest ick Line and it s highly graphical represent at ion of t he open t o close relat ionship is such an indispensable t ool for t he Japanese t rader. To illust rat e t he difference, com pare t he daily chart plot t ed wit h West ern Lines ( Figure 3) wit h t he exact sam e chart plot t ed wit h Japanese Candlest ick lines ( Figure 4) . I n t he West ern bar chart as wit h t he Japanese Candlest ick chart , it is easy t o int erpret t he overall t rend of t he st ock, but not e how m uch easier it is t o int erpret change in sent im ent on a day t o day basis by viewing t he change in real body color in t he Japanese Candlest ick chart .
Figu r e 4
Tr a de r 's Se n t im e n t
One of t he great est values of t he candlest ick chart is t he abilit y t o read m arket sent im ent regarding a st ock. To illust rat e consider t he following exam ple of a st ock t raded from t he eyes of a West ern chart t rader and t hen from t he eyes of a candlest ick chart t rader.
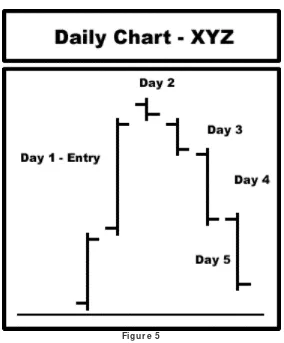
W e st e r n Cha r t Tr a de r
At t he close of t he day's session you observe t hat t he st ock closed well above your ent ry price ( 2) , which leaves you very cont ent wit h your t rade.
Aft er t he close of day 2, you open t he financial sect ion of t he paper and check t he closing price of t he st ock and observe t hat not only is your st ock well above your ent ry price, but also has gained slight ly ( it is wort h m ent ioning
t hat m ost west ern papers only publish closing prices while Japanese papers publish bot h opening and closing prices) .
You are now concerned about prot ect ing t he profit s t hat you had previously bragged about j ust days before.
On t he beginning of day 6, you call your broker ( or logon t o your online t rading account ) and place a m arket order t o sell at t he first opport unit y.
At t he day 5 m arket s open, t he st ock opens sharply lower and cont inues t o fall.
Your order is execut ed at a price several point s below where you ent ered.
Figu r e 5
Ca n dle st ick Ch a r t Tr a de r
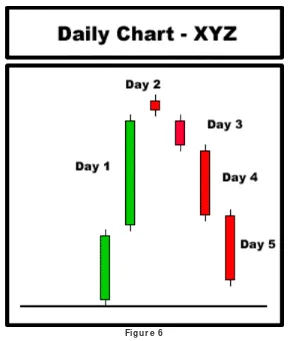
Now suppose you are a candlest ick chart t rader t rading t he sam e st ock using a candlest ick chart ( Figure 6) .
At t he beginning of Day 1 you ent er t he st ock based on a candlest ick pat t ern ent ry signal ( we will discuss proper ent ries in det ail lat t er in t his unit ) .
At t he close of t he day's session you observe t hat t he st ock closed well above your ent ry price ( 2) which leaves you very cont ent wit h your t rade, but also m oves you int o a st at e of caut ion for signs of a change in t rend or reversal.
Aft er t he close of day 2, you observe t he candlest ick form ed for t he day and not ice t hat t he real body is sm all indicat ing t hat t here was a t ug of war bet ween t he bears and t he bulls.
You also observe t hat t he real body is read in color indicat ing t hat t he st ock closed lower t han t he open indicat ing t hat t he bulls act ually lost t he t ug of war t o t he bears.
Based on t hese observat ions you conclude t hat t he bullish rally in t he st ock has ceased, and t he bullish sent im ent of t he m arket regarding t he st ock is changing.
You decided t o sell your posit ion at t he days close, or at t he m arket open on t he next day t o lock in your profit .
As you can see t he candlest ick chart t rader has t he advant age over t he west ern chart t rader in t hat he can use t he signals generat ed in each candlest ick t o
help foret ell t he changing sent im ent s of t he m arket regarding a st ock.
The open t o close relat ionship revealed in t he candlest ick is m ore effect ive t han t he close- t o-close relat ionship com m only used by west ern t raders.
Figu r e 6
Su pply a n d D e m a n d
A st ock's price will adj ust t o higher or lower prices based st rict ly on supply and dem and principles.
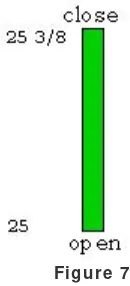
I n Figure 7 is shown a diagram of a green candlest ick.
Figu r e 7
As you will see, t he candlest ick's color and size provide very im port ant clues regarding t he TRADER'S SENTI MENT t oward a given st ock's fut ure price.
Not ice t hat 't rader's sent im ent ' is t he key phrase here. I n short t erm t rading, it is crit ical for t he t rader t o have a clear underst anding of what ot her t raders are t hinking. As you will see, t he m ost direct way t o get t hat underst anding is t hrough proper int erpret at ion of t he candlest ick.
Let 's look at an exam ple. I n Figure 8 is shown a candlest ick of XYZ Com pany, which opened at 25 and closed at 25 3/ 8.
Figu r e 8
The candlest ick is green in color, which gives us a quick visual signal t hat t he st ock price has rallied higher during t his period.
I n Figure 8, we see t he st ock opens at 25, and t hen quickly rallies t o 25 1/ 8. The reason t he
This process will repeat it self unt il t he buyers loose int erest in buying t he st ock result ing in a reduct ion of dem and.
The result of com bining t hese st eps is a green candlest ick wit h an opening price of 25, rallying t o a closing price of 25 3/ 8.
During t he rally period; however, t he ast ut e candlest ick reader will be able t o observe t he long green color of t he candlest ick, and deduce t hat buyer dem and is high.
Now t here is only one reason why t raders would increase dem and by st epping up t o buy t he st ock, and t hat is because t hey t hink t hat t he st ock will go up in t he
near fut ure. So by observing t he candlest ick color and size, t he ast ut e candlest ick reader is able t o deduce exact ly what ot her t raders are t hinking, and t hat is t hat t hey t hink t he st ock price will go higher in t he fut ure.
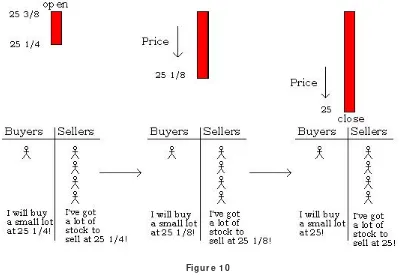
I n Figures 9 & 10 we show an exam ple of how t he sam e principle in reverse applies t o t he analyses of a red candlest ick.
Figu r e 1 0 During t he st ock's price fall; however, t he ast ut e candlest ick reader will be able t o observe t he long red color of t he candlest ick, and deduce t hat dem and for t he st ock is low.
Now t here is only one reason why t raders would increase t he supply of st ock t o sell, and t hat is because t hey t hink t hat t he st ock will go down in t he near fut ure.
So by observing t he candlest ick color and size, t he ast ut e candlest ick reader is able t o deduce exact ly what ot her t raders are t hinking, and t hat is t hat t hey t hink t he st ock price will go lower in t he fut ure.
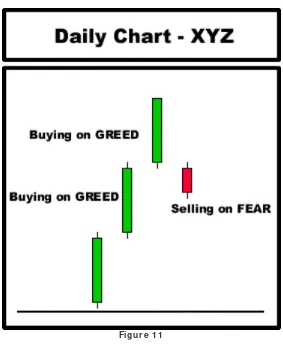
Bu y on Gr e e d, Se ll on Fe a r
There are only t wo forces behind t he supply and dem and forces t hat drive a st ock's price higher or lower.
Figu r e 1 1
Suppose you are a t rader observing t he bullish rally of St ock XYZ at t he beginning of t he 3rd bullish green candlest ick, and considering an ent ry.
You have wit nessed t he st ock rally huge for t wo days and know t hat each t rader who ent ered on t he first t wo days is now a big winner.
Based on t he em ot ion of greed you decide t o ent er at t hat beginning of t he 3 day, and m ent ally count your profit s as t he price rallies t o a new high.
Aft er t he st ock closes, you brag t o your friends at t he golf course regarding t he great t rade t hat you m ade t hat day.
You go hom e from t he golf course and celebrat e t he vict ory wit h your spouse and m aybe even discuss how you will use t he ext ra m oney t hat you have earned t hrough t he t rade.
Now keep in m ind t hat t he profit is only on paper and not one penny has been earned yet .
The next m orning you check t he price of your posit ion, wit h expect at ions t hat your bullish st ock will rocket t o t he m oon! Now im agine t he em ot ion t hat goes t hrough your m ind when your posit ion not only fails t o go higher, but also opens below your ent ry price.
What is t he em ot ion t hat flows t hrough your body as you not only see your profit s erode before your eyes, but now rob your account of precious capit al?
Now consider t hat t here were also 2 or 3 t housand addit ional t raders who ent ered t he sam e st ock at around t he sam e price wit h t he hopes of t he gaining t he sam e
profit .
All of t hese t raders will be t ripping over t hem selves t rying t o get out of t he st ock.
As was illust rat ed in t he previous sect ion, t his increase in fear result s in an increase in supply of t he st ock relat ive t o t he increase in dem and, and t riggers t he sharp decline in t he price.
The deeper t he red candlest ick cut s int o t he bullish green candlest icks, t he m ore t raders are t hrown int o loosing posit ions, and t hus t he furt her t he price decline.
Perhaps you are beginning t o realize t he power of em ot ions in price m ovem ent s of a st ock.
The t echnical analyst t hrough candlest ick reading is t rained t o read t his greed and fear em ot ions in t he m arket and capit alize on t hem .
Ca pit a liz in g on Fe a r a n d Gr e e d
From t he previous sect ion, we det erm ined t hat price m ovem ent s result from m assive em ot ions of fear and greed regarding t rader's posit ion in t he m arket wit h a given st ock.
Recognizing t he foot print s of greed and fear is not difficult . Recognizing t he signs t hat t he rally or decline before it happens is t he difficult part of t rading. How m any t im es has t his sit uat ion rally or fear sell off begins. There are; however, t echniques based on candlest ick pat t erns t hat help us locat e probable areas for t hese t urning point s. The rest of t his sect ion will explore t he t echniques in ident ifying t hose probable areas t hat properly m anaged will result in profit s for t he t rader in
t he long run.
Re cogn iz in g Re ve r sa l Sign a ls
Throw a baseball st raight up int o air. As t he ball approaches t he t op of it s proj ect ile pat h it will decelerat e t o a speed of zero, and t hen reverse downward picking up speed as it approaches t he ground.
When a st ock is com plet ing a m ove, it experiences a period of decelerat ion, which is referred t o by chart ist as price consolidat ion.
The m ove can be a cont inuat ion in t he sam e direct ion, or it can be a reversal in t he opposit e
During t he consolidat ion period or 'bat t le zone', t raders, bot h long and short are pat ient ly wait ing on t he sidelines wat ching t o learn t he out com e of t he bat t le.
As t hese winners em erge, t here is oft en a scram ble of t raders j um ping in wit h t he winning t eam .
The candlest ick pat t erns gives t he t rader excellent clues on when t his m ove is about t o t ake place, and helps t he t rader t im e his ent ry so t hat he can get in at t he very beginning.
There are four different consolidat ion pat t erns experienced by st ocks.
They are 1) Bearish Cont inuat ion, 2) Bullish Cont inuat ion, 3) Bearish Reversal, 4) Bullish Reversal.
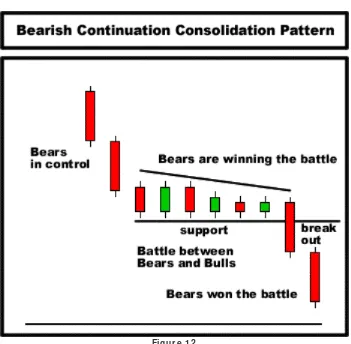
Th e Be a r ish Con t inu a t ion Con solida t ion Pa t t e r n
Several st rong bearish candlest icks precede t he Bearish Cont inuat ion pat t ern where t he bears are clearly in cont rol ( Figure 12) .
The bears and bulls t hen begin t o bat t le by pushing t he st ock up and down in price in a t ight ly form ed consolidat ion zone.
The narrowing size of t he candlest icks t oward a line of support indicat es t hat t he bears are winning t he bat t le.
The bulls finally weaken and allow t he bears t o penet rat e t he line of support , at which t im e t he bears quickly conquer new t errit ory by t aking t he st ock t o lower prices.
By recognizing t he consolidat ion pat t ern t he t rader is able t o short t he st ock j ust aft er t he st ock breaks t he line of support , and profit from t he sharp m ove downward.
The cause of t he sharp sell off is fueled by t he em ot ions of t he t raders wat ching for t he out com e of t he bat t le. Traders who bought t he st ock in t he area of consolidat ion in hope of a rally off of support , are now scram bling t o exit t heir losing posit ions.
Figu r e 1 2
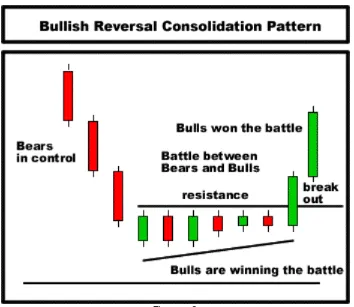
Th e Bullish Re ve r sa l Con solida t ion Pa t t e r n
Several st rong bearish candlest icks precede t he Bullish Reversal Cont inuat ion pat t ern where t he bears are clearly in cont rol ( Figure 13) .
The bears and bulls t hen begin t o bat t le by pushing t he st ock up and down in price in a t ight ly form ed consolidat ion zone.
The narrowing size of t he candlest icks t oward a line against upward resist ance indicat ing t hat t he bulls are winning t errit ory from t he bears.
The bears finally weaken and allow t he bulls t o penet rat e t he line of resist ance, at which t im e t he bulls quickly conquer new t errit ory by t aking t he st ock t o higher prices.
By recognizing t he consolidat ion pat t ern t he t rader is able t o buy t he st ock j ust aft er t he st ock breaks t he line of resist ance, and profit from t he sharp m ove upward.
The cause of t he rally is fueled by t he em ot ions of t he t raders wat ching for t he out com e of t he bat t le.
Addit ional t raders who j um p in t o buy t he st ock now t hat it s st rengt h has been confirm ed fuel t he sharp upward m ove.
Figu r e 1 3
Th e Be a r ish Re ve r sa l Con solida t ion Pa t t e r n
Several st rong bullish candlest icks precede t he Bearish Reversal Cont inuat ion pat t ern where t he bulls are clearly in cont rol ( Figure 14) .
The bears and bulls t hen begin t o bat t le by pushing t he st ock up and down in price in a t ight ly form ed consolidat ion zone.
The narrowing size of t he candlest icks t oward a line of support indicat es t hat t he bears are winning t he bat t le.
The bulls finally weaken and allow t he bears t o penet rat e t hrough t he line of support , at which t im e t he bears quickly conquer new t errit ory by t aking t he st ock t o lower prices.
By recognizing t he consolidat ion pat t ern t he t rader is able t o sell short t he st ock j ust aft er t he st ock breaks t he line of support , and profit from t he sharp spike downward.
Addit ional t raders who j um p in t o short t he st ock now t hat it s weakness has been confirm ed fuel t he sharp sell off.
Traders, who are current ly long t he st ock in t he area of consolidat ion wait ing in hope of a breakdown, are now scram bling t o sell t heir long posit ions.
Figu r e 1 4
Th e Bullish Con t inu a t ion Con solida t ion Pa t t e r n
Several st rong bullish candlest icks precede t he Bullish Cont inuat ion Consolidat ion Pat t ern where t he bulls are clearly in cont rol ( Figure 15) .
The bears and bulls t hen begin t o bat t le by pushing t he st ock up and down in price in a t ight ly form ed consolidat ion zone.
The narrowing size of t he candlest icks t oward a line of resist ance indicat es t hat t he bulls are winning t he bat t le.
The bears finally weaken and allow t he bulls t o penet rat e t he line of resist ance, at which t im e t he bulls quickly conquer new t errit ory by t aking t he st ock t o higher prices.
By recognizing t he consolidat ion pat t ern t he t rader is able t o buy t he st ock j ust aft er t he st ock breaks t he line of resist ance, and profit from t he sharp m ove upward.
The cause of t he sharp sell off is fueled by t he em ot ions of t he t raders wat ching for t he out com e of t he bat t le.
Traders, who short ed t he st ock in t he area of consolidat ion in hope of a sell off in t he area of consolidat ion, are now scram bling t o exit t heir losing posit ions.
Figu r e 1 5
I n cr e a sin g Th e Odds
As we learned in t he last sect ion, t he best t rading opport unit ies present t hem selves j ust aft er a breakt hrough in price consolidat ion.
Not every consolidat ion pat t ern; however, is t radable.
There are addit ional pat t erns, which significant ly increase t he odds of t he t rade following t hrough in t he desired direct ion.
The t ools, which we present , are 1) support / resist ance 2) t rends, 3) m oving averages.
Su ppor t a n d Re sist a n ce
Support and resist ance are general price areas t hat have halt ed t he m ovem ent of st ock in t he past .
Support lines are horizont al lines t hat correspond wit h an area where st ock previously bounced.
Resist ance lines are horizont al lines corresponding wit h an area where st ock resist ed m oving t hrough.
Support and resist ance lines are used t o help access how m uch t he st ock price will rem ove before it is halt ed.
M a j or Pr ice Su ppor t / Re sist a nce
Maj or Price Support is an art ificial horizont al line represent ing an area where a st ocks downward m ovem ent was halt ed t o give way t o a new upward m ovem ent ( Figure 16) .
Therefore, t he price level is support ing t he price of t he st ock.
Sim ilarly, Maj or Price Resist ance is an art ificial horizont al line represent ing an area where a st ocks u ward m ovem ent was halt ed t o give way t o a new downward
m ovem ent .
Therefore, t he price level is resist ing t he price of t he st ock.
When considering a st ock as a t rading opport unit y it is im port ant t o not e t he locat ion of t he nearest support and resist ance levels.
St ocks near areas of support m ake for bet t er buy opport unit ies and st ocks near areas of resist ance m ake for bet t er short opport unit ies.
I n t he sam e way, t he t rader should be m ore caut ious about short ing st ock above areas of support , and buying st ock near areas of resist ance.
Minor Price Support is an art ificial horizont al line represent ing an area, which previously served as price resist ance, but has now t ransform ed t o price support (
Figure 17) .
Likewise, Minor Price Resist ance is an art ificial horizont al line represent ing an area, which previously served as price support , and has now t ransform ed t o price resist ance ( Figure 18) .
When considering a st ock as a t rading opport unit y it is im port ant t o not e t he locat ion of t he nearest support and resist ance levels.
St ocks near areas of support m ake for bet t er buy opport unit ies and st ocks near areas of resist ance m ake for bet t er short opport unit ies.
I n t he sam e way, t he t rader should be m ore caut ious about short ing st ock above areas of support , and buying st ock near areas of resist ance.
For an in- dept h analysis of how m inor support & resist ance works, see t he free " Educat ional Sect ion" of our m ain websit e at ht t p: / / www.candlest ickshop.com / free
Figu r e 1 8
Tr e n ds
Every st ock is in one of t hree st at es: 1) Up Trend, 2) Down Trend, and 3) Sideways Trend ( Figure 20) .
An Up Trend is defined by a series of higher highs and higher lows.
A Down Trend is defined by a series of lower highs followed by lower lows.
Figu r e 2 0
Even t he st rongest st ocks will need a period of rest t hrough a pullback in price or a period of m arking t im e wit h lit t le t o no price m ovem ent .
A st rong st ock will oft en pull back in price as short t o m edium t erm t raders t ake t heir profit s off t he t able, and in t he process, increase selling pressure, which will t em porarily push t he st ock lower.
A st rong st ock, aft er rest will oft en resum e it s rally aft er t hese slight pullbacks.
The t rader has bet t er odds in his favor by playing t he st ock in t he direct ion of t he t rend.
For exam ple, st ocks in and up t rend can be bought , and st ocks in a downt rend can be short ed ( Figures 21& 22) .
A st ock in a sideways pat t ern can be eit her bought our short ed if t he st ock ison st rong price support or resist ance.
I n ot herwise, t he t rader should ent er long posit ions only on up t rending st ocks t hat have pulled back for rest ready t o resum e t he rally.
Figu r e 2 2
M ovin g Ave r a ge s
The m ost basic form of m oving average, and t he one we recom m end t o all our t raders is called t he sim ple m oving average.
The sim ple m oving average is t he average of closing prices for all price point s used.
For exam ple, t he sim ple 10 m oving average would be defined as follows:
10MA = ( P1 + P2 + P3 + P4 + P5 + P6 + P7 + P8 + P9 + P10) / 10
Where P1 = m ost recent price, P2 = second m ost recent price and so on
The t erm " m oving" is used because, as t he newest dat a point is added t o t he m oving average, t he oldest dat a point is dropped.
As a result , t he average is always m oving as t he newest dat a is added. Moving averages can be used as support and resist ance levels.
A m oving average can be plot t ed using any period; however, t he periods t hat seem t o provide t he st rongest support and resist ance for short t erm t rading are t he
10MA, 20MA, 50 MA, 100MA and 200MA.
Figu r e 2 4
Ca n dle st ick Lin e Tim e Fr a m e s
One of t he beaut iful at t ribut es of t he candlest ick line is t hat t he sam e analysis can be applied t o m ult iple t im e fram es.
The t im e fram e of a candlest ick line is t he t im e durat ion bet ween t he candlest ick's opening price and closing price.
For exam ple, a daily candlest ick chart would consist of candlest ick lines wit h opening prices corresponding wit h t he day's opening price, and closing prices corresponding wit h t he day's closing price ( Figure 25) .
A 5- m inut e candlest ick chart would have candlest ick lines wit h t im e durat ion of 5 m inut es bet ween each candlest ick's opening price and closing price.
Most good com put er chart ing soft ware allows easy conversion from one t im e fram e t o t he next .
Figu r e 2 5
D isse ct in g a Ca n dle st ick
Changing t im e fram es when viewing candlest ick pat t erns is useful t ool when looking for pat t erns leading up t o good t rading opport unit ies.
For exam ple, consider t he Bullish Haram i Pat t ern t hat is m anifest ed on t he Daily t im e fram e chart ( Figure 26) .
The sam e st ock plot t ed on a 15 m in t im e fram e chart shows t hat t he st ock is act ually set t ing up for a Bullish Reversal Consolidat ion pat t ern.
Using t he Daily chart and t he 15 m in chart t oget her m ake it easier t o find possible t rade opport unit ies.