ANALYSIS
Travel patterns and environmental effects now and in the future:
implications of differences in energy consumption among
socio-economic groups
Annika Carlsson-Kanyama
a,*, Anna-Lisa Linde´n
b,1aDepartment of Systems Ecology,Stockholm Uni6ersity,106 91Stockholm,Sweden bDepartment of Sociology,Lund Uni
6ersity,Box114,221 00Lund,Sweden
Received 6 July 1998; received in revised form 30 December 1998; accepted 4 January 1999
Abstract
Travel patterns among different socio-economic groups in Sweden are investigated. It is shown that elderly persons, persons with low incomes and women in general do not travel extensively. Middle-aged persons, persons with high incomes and men travel much farther. Cars are the dominant transportation mode for all population groups. Aeroplanes are used mostly by high-income earners and men, while public transportation is mostly used by young people and women. Energy consumption for the different travel patterns differs substantially. Men with high incomes consume the most energy, with 94 000 MJ during one year, while elderly women consume 12 000 MJ. When compared to a calculated sustainable level of energy consumption for travel, most population groups are in excess. The level for sustainable energy consumption is calculated based on an assumed global potential for renewable energy of 360 EJ per year, divided equally among the global population. A certain share of this energy potential is supposed to be used for travelling. A scenario for 2020 is presented in which vehicle energy efficiency has increased and travel patterns have changed from what they are today. Sustainability can only be reached when both travel patterns and vehicle technology have changed radically. Differences in energy consumption for travel due to age and gender are likely to remain in the future. Scientific knowledge from the social domains seems to be important for devising efficient strategies for a sustainable society. Current focus on policy measures has been mainly on technical issues. © 1999 Elsevier Science B.V. All rights reserved.
Keywords:Travel patterns; Energy consumption; Income; Gender; Age; Sustainability; Future
www.elsevier.com/locate/ecolecon
* Corresponding author. Tel.: +46-8-6747463; fax: +46-8-158417. E-mail address:[email protected] (A. Carlsson-Kanyama)
1Tel.: +46-46-2228834; fax: +46-46-2224794; e-mail: [email protected]
1. Introduction
A sustainable transportation system is certainly one of the most critical features for achieving a sustainable society. When changes in consump-tion patterns towards more sustainable ones are advocated, such as in Agenda 21 (United Nations, 1993), travel patterns of both people and goods are certain to be under scrutiny. In 1990, the transportation sector was responsible for about 25% of the world’s primary energy use and for 22% of CO2emissions from fossil fuel use (IPCC,
1996, p. 681).
Extensive movement of goods and people is deeply interconnected with the development of modern societies. For example, in the beginning of this century, the population travelled just a few kilometres per day, whereas during the 1990s, daily travel in Sweden had increased to about 40 km (Vilhelmsson, 1988). The development of mo-tor vehicles has made it easier to reach more distant places. Time travel surveys indicate that as societies become wealthier, not only does travel related to the localisation of places of work be-come important but so does social and leisure travel. The increasing tendency to travel indicates a close connection between individual lifestyles and the development of infrastructures in society (Linde´n and Carlsson-Kanyama, 1998). Even products for domestic consumption tend to come from more distant places (Carlsson-Kanyama, 1997).
With increasing general awareness of the lim-ited assimilative capacities of nature, the debate over how, and by whom, these capacities shall be used is increasing (Rahman et al., 1993; Parikh and Painuly, 1994) at the same time that reduc-tions in emissions of CO2, necessary to stabilise
the rate of climate change, are yet to be seen. While promises by the developed nations to cut emission rates are remaining unfulfilled (Climate Network Europe, 1997), the world population continues to grow, with a population of 8.9 billion projected for 2050 (United Nations, 1998, medium projection). Inequalities between rich and poor countries as regards pollution levels are striking with per capita emissions rates in the rich countries exceeding those in the poor countries by
several factors. This has spurred negotiations on the trade of emission rights on a global level as a means of coming to terms with both inequalities in resource use and climate change (Verhagen, 1998).
Little has, however, been mentioned about how differences in resource use and pollution can vary between different population groups in a single country, nor has much been said about how such differences should be treated by societies who realise that the overall environmental effects of current lifestyles must decrease by a factor of 10 over the next 40 – 50 years (Hinterberger et al., 1997). If differences in resources are shown to be large in a seemingly homogenous society, it seems plausible that negotiations analogous to those conducted at the global level will follow at coun-try levels as well. When preparing for such discus-sions, it is important to have a solid scientific understanding of how large the differences in resource use might be and to understand the reasons for these differences.
In this study, we present estimates of how the energy consumption for travel differs between so-cio-economic groups in Sweden today. We use these results to discuss possible levels of energy consumption for travel in the future. The out-comes are compared to calculated levels for sus-tainable energy consumption.
Our study attempts to shed light on the follow-ing questions:
How does the energy consumption for travel differ among socio-economic groups defined by age, income and gender in Sweden today, and why does it differ?
Which population groups already have travel patterns that tentatively can be considered as sustainable with regards to the amount of en-ergy consumed, and which population groups do not?
How will future population structures, chang-ing travel patterns and improvements in the energy efficiency of vehicles affect energy consumption?
How can sustainable transportation patterns be visualised if we wish to maintain a high degree of mobility for leisure purposes while still satis-fying our basic needs?
2. Data and methods
The quantitati6e part of this study, which was
to calculate energy consumption for different travel patterns, was based on a database devel-oped as part of the National Travel Survey (NTS). The NTS database covers a 5-year period from April 1994 to the year 1999. In this study, data from 1996 were used.
The NTS measures both domestic travel within Sweden and foreign travel to and from Sweden. The sample covers 45 000 people over the range of 6 – 84 years of age. The sample is drawn from the population register so that each person has a defined probability of being included. Telephone interviews were used to carry out the survey.
Statistics Sweden delivered data about the num-ber of kilometres travelled according to gender, income and age during 1996. The data were cate-gorised into the following modes of transporta-tion: (1) Aeroplane; (2) Car; (3) Bicycle; (4) Train; (5) Public transportation (other than trains); (6) Moped/motorcycle; (7) Walking; (8) Other means of transportation, including lorry, taxi, boat and ship, chartered bus, snow scooter, tractor and rented car.
The NTS also provided us with information about the number of kilometres travelled during 1996 for different purposes. The purposes were categorised into four groups, namely, leisure, work, service/shopping and other purposes.
In order to calculate the energy consumption for different travel patterns, we combined infor-mation about number of kilometres travelled by different means of transportation with estimates of the energy consumption for travel by different vehicles, expressed as MJ per person km.
Our scenario for travel patterns in the future were based on population projections according to age group and sex made by Statistics Sweden for the year 2020. These estimates were combined with our own projections of changes in travel
patterns in different socio-economic groups. Esti-mates of energy consumption for future vehicles were taken from other studies.
The qualitati6epart of the study, which was to
explain the reason for different travel patterns and to discuss the possibilities and constraints for change, was based upon our own studies as well as studies closely related to this kind of issue (Vilhelmsson, 1988, 1997; Berge and Nondal, 1994; Carlsson-Kanyama et al., 1999).
A more comprehensive account of the data is presented in Linde´n and Carlsson-Kanyama (1998).
3. Results
3.1. Tra6el patterns during 1996
3.1.1. Age and gender
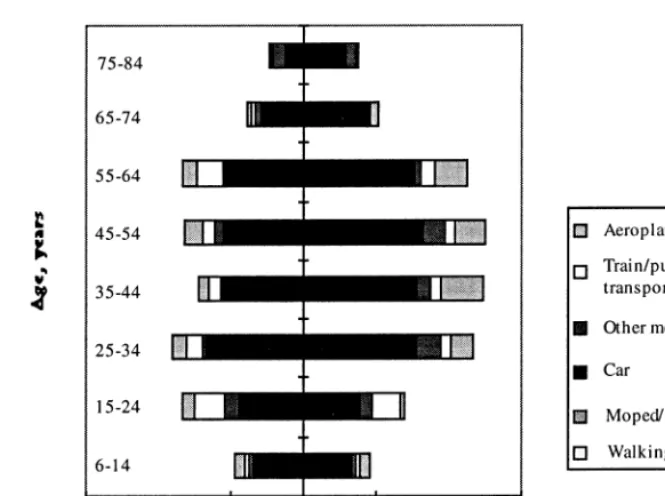
Fig. 1. Distances travelled in Sweden during 1996, according to age, gender and transportation mode (National Travel Survey, 1996).
Men between the ages of 35 and 54 years travel the farthest, with about 25 000 km per year, while elderly women travel only 4600 km (Fig. 1). Even young children aged 6 – 14 travel 10 000 km, which is farther than the elderly women travel. Children are passengers in differ-ent kinds of vehicles commuting to and from school and leisure activities. Young women (15 – 24 years) travelled more extensively than young men of the same age, but in the age group of 35 – 44 years and above, women travelled much less than men did.
The car is the dominant transportation mode for all age groups, regardless of gender. How-ever, women are more often passengers, while men are more often drivers (Carlsson-Kanyama et al., 1999). The gender differences are larger among older people because of differences in ac-cess to a driver’s licence and a car. Public trans-port was, however, used more often by young people than by other groups. Also, women used public transport somewhat more than men did. Aeroplanes were used mostly by middle-aged men.
3.1.2. Income and gender
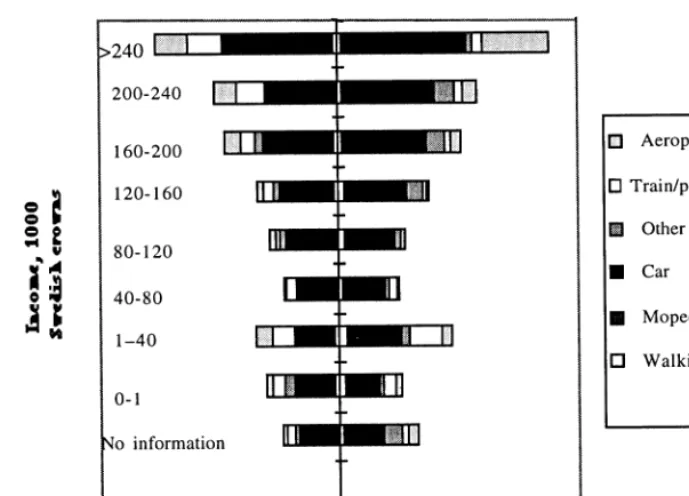
Income is highly determinant for travel patterns, as the distance travelled seemed to be almost proportional to income for both genders (Fig. 2). An exception is travel in income groups up to 40 000 Swedish crowns per year. This group includes many children and students who may travel with, or at the expense of, their parents. Women’s travel patterns resemble men’s travel patterns in the higher income groups. The explanation for this is that women with high incomes travel almost as extensively as men do to and from work, as well as in service. They have a driver’s licence more often than do women in other income groups. Changes in women’s attendance and working positions in the labour market have already meant that differences in travel patterns between men and women have decreased. This trend will certainly continue.
Fig. 2. Distances travelled in Sweden during 1996, according to income, gender and transportation mode (National Travel Survey, 1996).
with low incomes, here 40 000 – 80 000 Swedish crowns per year, travel only 9000 – 10 000 km.
Cars are the dominant mode of transportation for all groups regardless of income and gender. Trains and other modes of public transportation were used more often by women than by men, even in the higher income groups. Men with high incomes used aeroplanes to a larger extent than any other group. In the highest income group, men flew 11 000 km, while women in the same income group flew only 5400 km.
3.1.3. Tra6el for leisure,work and ser6ice
On average, more than 50% of all travel is related to leisure-time activities. Leisure-time travel has been increasing during the last decade (Vilhelmsson, 1988; Linde´n, 1994). About 25% of all travel is to and from work. There seems to be a reduction in travel related to work. If we look at the distances travelled, 53% of the distance is for leisure-time activities, 33% is for work-related ac-tivities and the rest is for service and shopping. The growing proportion of leisure-time travel
in-dicates that lifestyles have changed. At the same time, travel by car is most often used for leisure-time activities. Many destinations, such as sport arenas or summer houses, may not be very easy to reach by public transportation (Linde´n, 1994).
3.1.4. Today’s tra6el patterns in brief
We summarise today’s travel patterns as fol-lows (Figs. 1 and 2):
Elderly persons, persons with low incomes and women in general do not travel extensively. Middle-aged persons, persons with high in-comes and men travel much farther.
more extensively. There are, however, no ap-parent gender differences among young men and women and between children of both sexes concerning the distance travelled.
Income is a determinant for the distance trav-elled. The explanation for this is that a higher income enables people to travel farther for leisure and service purposes and that travel distances connected to work become longer with a higher income.
Differences in the distance travelled between different age groups is both a function of travel connected to work and of the travel experience of different generations. The younger genera-tions have become used to travelling extensively even as children, while the older generations grew up in a society in which mobility was much lower than it is today. These differences between generations are important for future travel patterns, as preferences for lifestyles are shaped in the very early phases of life.
The proportion of travel and the distances trav-elled are dominated by leisure-time activities. Travel for leisure purposes is steadily increas-ing, while travel to and from work seems to be decreasing proportionally.
3.2. Energy consumption for tra6el during1996 compared with a sustainable le6el for energy consumption
3.2.1. What is the potential supply of renewable energy and how much of this potential could be used for tra6elling?
Sustainable development (WCED, 1987) briefly means that the effect of human activities should be limited to what nature can bear in a long-term perspective, that resources should be preserved also for the needs of future generations, and that all people should have a fair share of the use of global resources. Included in this definition are the use of natural resources such as water and genetic resources and the use of ecological services such as the regulation of the global climate (Costanza and Folke, 1996).
Emissions of greenhouse gases can be sharply reduced if energy systems would be based on renewable energy instead of fossil fuel.
Estima-tions of the global potential for renewable energy supply have ranged from 100 to 220 EJ concern-ing fuels (fuel from biomass and solar H2) and
from 10.4 to 23 PW h concerning electricity (elec-tricity from hydropower, wind, photovoltaic cells, etc.) These estimations come the World Energy Council (Gru¨bler et al., 1995), Worldwatch Insti-tute (Lenssen and Falvin, 1996), Johansson et al. (1993) and IPCC (Ishitani and Johansson, 1996) and were summarised in Steen et al. (1997) and Hunhammar (1998).
Steen et al. (1997) and Hunhammar (1998) were, however, more optimistic in their estima-tions of the potential for renewable energy supply. They estimated that 360 EJ per year of fuels and electricity from renewable sources could become available if societies opted for renewable energy systems only. Increases in the energy price would then make new energy technologies more attractive.
Land and water may be important constraints for large-scale biomass production as pointed out by Giampietro et al. (1997). In this paper we have, however, adopted the level of 360 EJ per year as the tentative amount of renewable energy that could be produced in a sustainable manner. We use this level as guideline for sustainable energy consumption, calculating the level of en-ergy consumption for travel on a per capita basis in the following manner:
The global potential for renewable energy sup-ply (360 EJ per year) was divided equally among the global population for the years of 1996 and 2020. As the global population was about 5.8 billion people in 1996, this puts the renewable energy supply available for each indi-vidual to 62 000 MJ during that year. With an estimated global population of 7.5 billion peo-ple in 2020 (United Nations, 1998, medium projection), the corresponding figure is 48 000 MJ.
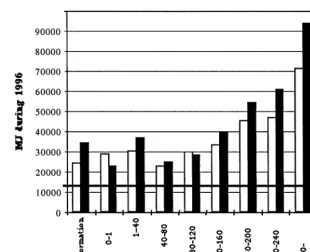
Fig. 3. Energy consumption for travel in the Swedish population during 1996, according to income and gender. The horizontal thick line is the calculated sustainable level of energy consumption for travel during 1996 (11 000 MJ per person).
countries. Of the remaining renewable energy available for each individual, we assume that travel will account for 25%. This is a reasonable assumption, as several studies have indicated that transportation accounts for 13 – 33% of the total energy consumed in a household (Vringer and Blok, 1995; Forbrugerstyrelsen, 1996; Wackernagel and Rees, 1996).
The resulting sustainable level of energy con-sumption for travel is 11 000 MJ per person dur-ing 1996 and 8400 MJ per person durdur-ing 2020. These levels are thus the goals which we use to compare today’s and future levels of energy con-sumption for travelling. It has to be mentioned, however, that these goals stem from a purely theoretical approach. So far, our calculations have nothing to do with accepted goals for Swedish policy. Also, for the individual consumer, it is of course optional to allocate more or less than 25% of the renewable energy available for each individual to travel. If travelling is given a high priority in life, allocation may be more generous.
3.2.2. Energy consumption for tra6el
The energy consumption for travel was calcu-lated assuming that all travel by cars consumes 2.8 MJ per person km and that all travel by train and public transportation consumes 0.65 MJ per person km. For aeroplanes, an energy consump-tion of 2.8 MJ per person km was assumed. For ‘other means of transportation,’ the energy sumption used for cars was assumed. Energy con-sumption for transportation with mopeds and motorcycles was assumed to be 0.43 MJ per per-son km. These figures are based upon estimates made by Steen et al. (1997) (pp. 70 and 74) and are relevant for the fleet of vehicles used in Swe-den during 1996. The figures include pre-combus-tion energy supplements but exclude conversion losses during electricity production.
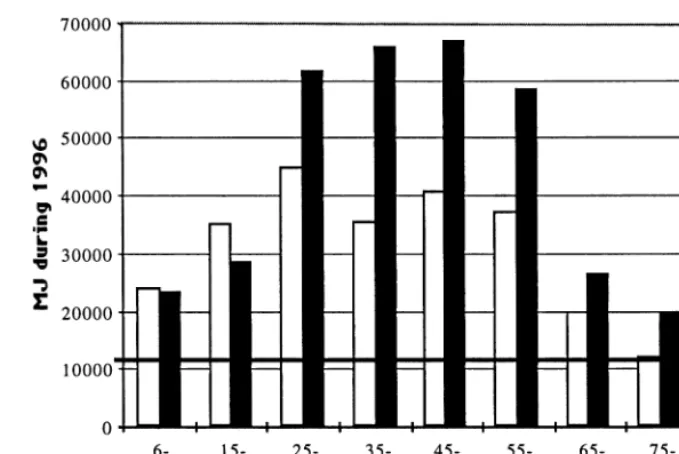
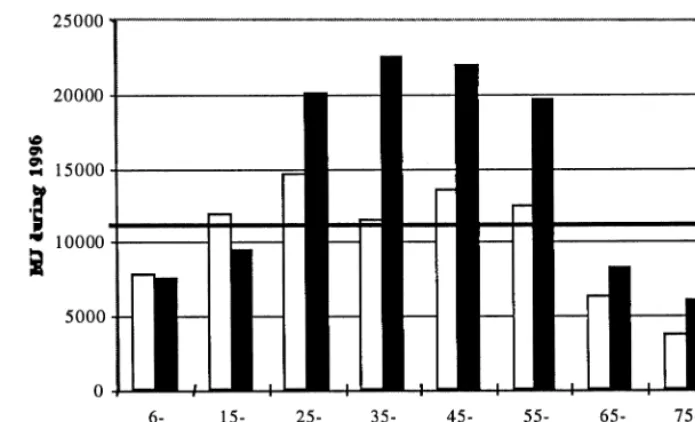
Fig. 4. Energy consumption for travel in the Swedish population during 1996, according to age and gender. The horizontal thick line is the calculated sustainable level of energy consumption for travel during 1996 (11 000 MJ per person).
The energy consumption for travel differed a lot within the Swedish population. This is certainly not surprising, as the data on travel patterns showed large differences in distance travelled and differ-ences in the type of vehicles used (Figs. 1 and 2). As a result of these patterns, men with high incomes consumed the most energy, with 94 000 MJ, while elderly women consumed less than all other groups did, with 12 000 MJ.
Almost all of the studied population groups exceeded the sustainable level of energy consump-tion for travel. Middle-aged men had the highest energy consumption when age and gender divided the population. Men aged 45 – 54 years consumed 67 000 MJ for their travel, but children aged 6 – 14 years also exceeded the sustainable level of energy consumption for travel set here. Elderly women (75 – 84 years) were the only ones who came close to the goal. The implications of our results are that if all Swedes had the same travel patterns that men with high incomes have, Sweden could have only just over 1 million inhabitants if the goal for sustainable energy consumption for travel is to be reached. Today, Sweden has almost 9 million inhabitants.
3.2.3. Is technology enough to make today’s tra6el patterns sustainable?
The potential for increasing the energy efficiency of vehicles is large (IPCC, 1996, p. 693; Steen et al., 1997, p. 70). The potential for reducing the energy consumption of cars is between 60 and 80% when compared to the 1990 intensity. The same potential for aeroplanes is 40 – 60%, and for trains and public transport, the same potentials could well be around 30 – 60%. These are the technical reduction poten-tials for new vehicles with reduced speed and performance. Reductions of the energy use per vehicle – kilometre for road vehicles can be achieved through changes in maintenance practice, vehicle-body design changes, more energy efficient engines and drive-train designs, and changes in operating practice. Options that have high potentials for reducing the energy consumption of road vehicles are low-weight cars with a vehicle design that reduces air resistance. For aircraft, new and fuel saving engine concepts are an important step to-wards energy conservation (IPCC, 1996, pp. 691 – 694).
Fig. 5. Energy consumption for travel in the Swedish population with travel patterns as in 1996 but with very energy-efficient vehicles (according to age and gender). The horizontal thick line is the calculated sustainable level of energy consumption for travel during 1996 (11 000 MJ per person).
themselves. Therefore, we re-calculated our results on energy consumption for travel during 1996, assuming a very high increase in energy efficiency for vehicles over today’s levels.2
The result is shown in Fig. 5. The energy consumption for several population groups defined by age and gender is still not sustainable. So, even if by magic future technology would already be available to-day, the travel patterns for many groups would still be problematic. To further complicate the issue, travel patterns for a given population are not static. Instead, they change over time as will be discussed in the next section.
3.3. Energy consumption for tra6el in2020
Travel patterns 20 years from now will reflect
the generations already born. The middle-aged of today are tomorrow’s pensioners, and today’s young grown-ups will have become middle-aged in the year 2020. A new generation of children and teenagers will have been born by their par-ents, today’s children. Our assumptions for the year 2020 are that the fleet of vehicles will be more energy-efficient than it is today3and that the
population structure will be as projected by Statis-tics Sweden (1997). We assume that travel pat-terns among the population defined by age and gender will have changed as follows:
All children and all men and women up to the age of 34 will travel as the corresponding age groups did in 1996. It cannot be assumed that substantially more young people will own their own cars. Before the age of 34, most individuals
2We then assumed that the energy consumption for cars was −70% of the energy consumption during 1996. The corresponding reduction for aeroplanes was−50%, for trains and public transportation, it was−50% and for ‘other means of transportation,’ it was−50%. Travelling with mopeds and motorcycles was assumed to consume −40% of the energy consumed in 1996.
are still at the beginning of their professional careers; consequently, their work-related travel cannot be expected to increase.
Men in the age group of 35 – 44 years will travel as men did in the same age groups during 1996 but with a 5% increase in distance travelled. Women in the age groups of 35 – 44 years will travel as women of the same age groups did in 1996 but with a 10% increase in distance travelled due to an ongoing change in women’s participa-tion and posiparticipa-tion in the labour market. Men in the age group of 45 – 54 years will travel as they did in 1996 when they were 25 – 34 years old, but the distance travelled will have increased by 20%. Women in the age group of 45 – 54 years will travel as they did in 1996 when they were 25 – 34 years old, but the distance travelled will have increased by 30%. We can assume that the use of Information Technology (IT) will lead to a reduction in short-distance travel for men. On the other hand, at least some men in high-income groups will travel over longer distances when they have to travel for work. Women will be working in sectors that cannot as easily make use of IT (such as the care and service sectors), but increasing income for women will make it easier for them to hold a driver’s licence and to get access to a car than is possible today.
Men aged 55 – 64 years will travel as they did in 1996 when they were 35 – 44 years old, but the distance travelled will have increased by 10%. Women aged 55 – 64 years will travel as they did in 1996 when they were 35 – 44 years old, but the distance travelled will have increased by 50%. The middle-aged generations of today can be expected to continue their travel patterns when they grow older. They have been raised in more affluent times than older people today were, which influences the distances they travel and their choice of mode of transport compared to corresponding age groups.
Both men and women aged 65 – 74 years of age will travel as they did during 1996 but with work-related travel excluded. We have assumed that cars will be used for 80% of the distance travelled and aeroplanes for 20% of the distance. Both men and women aged 75 – 84 years old will
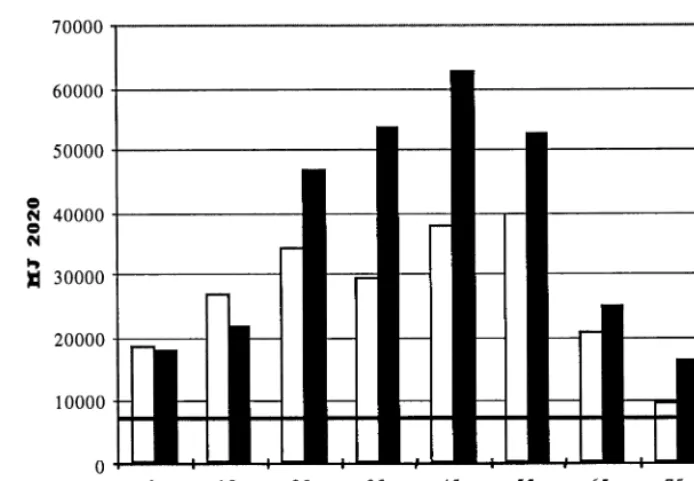
travel as men and women of that age did in 1996, but the distance travelled will have increased by 10% for both men and women. Old people in the future can be expected to be healthier than old people are today, which will make it easier for them to travel for leisure purposes than is possi-ble for the corresponding age groups today. The resulting energy consumption for travel according to age and gender is shown in Fig. 6. No group, except for elderly women, comes close to the sustainable level of energy consumption for travel, which is 8400 MJ. Middle-aged men continue to be the largest energy consumers for travel. Gender differences are still apparent for most age groups. In spite of our assumption that middle-aged women will increase their distance travelled more than middle-aged men, the difference in energy use for travel is still quite large. If women aged 45 – 54 years were to reach the same levels of energy consump-tion as men of the same age in 2020, women would have to increase their distance travelled by 90% between 1996 and 2020. Our conclusion is that gender differences in energy consumption for travel are likely to remain even 20 years from now.
The energy consumption for travel within the whole population in Sweden became 280 PJ in our example for the year of 2020. This level can be compared to the total Swedish energy consumption for travel during 1996 which was 320 PJ (Linde´n and Carlsson-Kanyama, 1998). So, in spite of changes in distances travelled, more energy-effi-cient vehicles have led to a reduction in energy use. At least from a theoretical point of view, it seems possible to expand travel and at the same time reach a reduction in energy use.
4. Discussion
Fig. 6. Energy consumption for travel in the Swedish population in 2020, according to age and gender. The horizontal thick line is the calculated sustainable level of energy consumption for travel during 2020 (8400 MJ per person).
their own cars (Cavalini et al., 1995). As high-in-come earners are more likely to get cars from their company than are low-income earners, high-in-come earners could well consume more energy for travel than we assumed in our study. We assumed that energy consumption per person km was the same for all car trips.
Our study has, however, clearly shown the im-portance of identifying the target groups when sustainable transportation patterns are sought. For example, it seems neither reasonable, nor very efficient, to inspire elderly women to travel less than they do now. Their travel patterns are already quite sustainable today. Instead, it might be more worth-while to devote efforts into changing the travel patterns of the middle-aged population and of high-income earners. Those population groups have the most unsustainable travel patterns today and will probably also have them in the future.
Our results indicate that changing travel patterns and energy consumption for travel is not just a matter of lifestyle changes, vehicle technology or transportation policy and infrastructure. A multi-factorial effort is needed.
We showed that changes in vehicle technology cannot by themselves achieve sustainability. This conclusion is relevant even if we adopt definitions of sustainable consumption patterns that are more liberal towards developed countries than we did here. One example of this comes from the Climate Fund in which emission rights are allocated ac-cording to each country’s proportion of the total population today only so as to avoid any encour-agement of population growth in the future (Ver-hagen, 1998). In our study, the individual goal for sustainable energy consumption was a moving target, depending on the size of the global popula-tion at any given point in time. Had we adopted the method used in the Climate Fund, the Swedish goal for sustainable energy consumption for travel would have been 98 PJ both now and in the future.4But even with this approach, technical
reduction potentials would not be enough, ac-cording to our calculations. Our estimations
showed that the energy consumption of transporta-tion patterns in 2020 would largely exceed the level of 98 PJ if technical reduction potentials only were considered.
Lifestyle changes seem to be very dependent on an individual’s position in a social structure. The location of workplaces in relation to housing makes it more or less easy for a person to choose public transportation instead of a private car when com-muting. The structure of modern societies contains obstacles that, for example, make it difficult for a certain proportion of working men, women with small children and households living in sparsely populated areas to change their travel patterns. Individual lifestyles are dependent on the availabil-ity of transportation and the related aspects of time schedules, technical efficiency of vehicles and mode of transport. Individual factors such as attitudes, income and subjectively defined needs for travel and transport are also important.
However, we do remain optimistic about the possibility of achieving sustainable travel patterns. In Linde´n and Carlsson-Kanyama (1998) we pre-sented a scenario for the year of 2050 where the sustainable level of energy consumption for travel in Sweden was not exceeded. Still travels for leisure purposes were longer than today for many popula-tion groups. As an example, a women aged 45 – 54 years in 2050 could travel 12 000 km for leisure purposes. This can be compared with the distance travelled for leisure purposes by today’s (1996) women of the same age, which is only 8100 km. Certainly, our scenario for sustainable travel in 2050 portrays a society very different from that at the present. Cars are no longer the dominant transportation mode; all age groups are walking or cycling much longer distances than they are today; and use of energy-consuming vehicles for shopping and services is almost non-existent. Clearly, in order to achieve such a future, infrastructure, planning and attitudes towards transportation would have to change significantly.
5. Conclusions
The differences in energy consumption for travel among socio-economic groups in Sweden are so
large that they can be compared to differences in resource use commonly found among average citi-zens in rich and poor countries.
Differences in energy consumption for trans-portation can be explained by factors related to age, gender and income. People of working age travel in connection with work, while children and elderly people do not. Women often work closer to home than men do, and women’s leisure activities are also located closer to home. Income influences both the amount of travel done for work and the amount of travel during leisure time. The higher the income, the longer the distance travelled.
The only population groups that have sustain-able transportation patterns today are the elderly women. Men with high incomes consume more energy than all other population groups for their travel.
Sustainability cannot be reached by relying on improvements in vehicle energy efficiency only. Travel patterns will have to change towards more deployment of public transport and less depen-dence on cars and aeroplanes. This implies substan-tial lifestyle changes as well as changes in planning and infrastructure.
Acknowledgements
This work was financed by the Swedish Commit-tee on Climate Change and the Foundation for Strategic Environmental Research.
References
Berge, G., Nondal, T., 1994. Livsstil som barriere. (Lifestyle as a barrier). TO8I rapport 1994:267. Institute of Transport Economics, Oslo, 55 pp. In Norwegian, summary in Swedish.
Carlsson-Kanyama, A., 1997. Weighted average source points and distances for consumption origin — tools for environ-mental impacts analysis? Ecol. Econ. 23, 15 – 23. Carlsson-Kanyama, A., Linde´n, A.-L., Thelander, A,., 1999.
Gender, travelling and environmental impacts. Soc. Nat. Resour. 12 (4).
Climate Network Europe, 1997. Independent NGO evaluations of national plans for climate change mitigation OECD countries — Fifth review, September 1997, Brussels, 102 pp. Costanza, R., Folke, C., 1996. The structure and function of ecological systems in relation to property-rights regimes. In: Hanna, S., Folke, C., Maler, K.-G. (Eds.), Rights to Nature. Ecological, Economic, Cultural, and Political Principles of Institutions for the Environment. Island Press, Washington, DC, pp. 13 – 34.
Forbrugerstyrelsen (National Consumer Agency), 1996. Miljo-belastning ved familiens aktiviteter. Resultater fra en kort-laegning af ressourceforbrug og udledninger till miljoet fra 22 aktiviteter i en modelfamilie. (Environmental loads from family activities. Results from a survey of resource require-ments and emissions to the environment from 22 activities in a model family.) Rapport 1996, Copenhagen. In Danish. Giampietro, M., Ulgiati, S., Pimentel, D., 1997. Feasibility of large scale fuel production — Does an enlargement of scale change the picture? Bioscience 47 (9), 587 – 600.
Gru¨bler, A., Nakicenovic, N., Jeffersson, J.M., 1995. A sum-mary of the joint IIASA and WEC study on long-term energy perspectives. WP-95-102, International Institute of Applied Systems Analysis, IIASA, Laxenburg, 29 pp. Hinterberger, F., Luks, F., Schmidt-Bleeks, F., 1997. Material
flows vs. ‘natural capital’: What makes an economy sustain-able? Ecol. Econ. 23 (1), 1 – 14.
Hunhammar, S., 1998. Energy and Climate Criteria for Sustain-able Transportation. Paper No 759, revised version, pre-sented at the 8th World Conference on Transport Research, Antwerp, Belgium, 12 – 17 July 1998.
IPCC (Intergovernmental Panel on Climate Change), 1996. Climate change 1995. Impacts, adaptations and mitigation of climate change: Scientific-technical analysis. Contribution of Working Group II to the Second Assessment Report of the Intergovernmental Panel on Climate Change. Cam-bridge University Press, CamCam-bridge, 879 pp.
Ishitani, H., Johansson, T.B., 1996. Energy supply mitigation options. In: IPCC’s Climate Change 1995. Impacts, Adapta-tion and MitigaAdapta-tion. Scientific-technical analysis. Contribu-tion of Working Group II to the Second Assessment Report of the Intergovernmental Panel on Climate Change. Cam-bridge University Press, CamCam-bridge, pp. 585 – 647. Jochimsen, M., Knobloch, U., 1997. Making the hidden
invis-ible: the importance of caring activities and their principles for any economy. Ecol. Econ. 20 (2), 107 – 112.
Johansson, T.B., Kelly, H., Reddy, A.K.N., Williams, R.H (Eds.), 1993. Renewable Energy. Sources for Fuels and Electricity. Island Press, Washington, DC, p. 1160. Lenssen, N., Falvin, C., 1996. Sustainable energy for
tomor-row’s world. Energy Policy 24 (9), 769 – 781.
Linde´n, A.-L., 1994. Manniska och miljo¨. Om attityder, va¨rderingar, livsstil och livsform. (Man and environment. Attitudes, values, lifestyles and forms of life.) Carlssons, Stockholm, 184 pp. In Swedish.
Linde´n, A.-L., Carlsson-Kanyama, A., 1998. Dagens livsstilar
i framtidens perspektiv. (Lifestyles in the perspective of the future. Environmental behaviour and patterns of trans-portation.) Research Report 1998:4, Department of Sociol-ogy, Lund University, Sweden, 74 pp. In Swedish. Also published by the Swedish Environmental Protection Agency, 1998. Report 4870, 55 pp. In Swedish.
National Travel Survey (NTS), 1996. Statistics Sweden. Parikh, J.K., Painuly, J.P., 1994. Population, consumption
patterns and climate change: A socio-economic perspective from the South. Ambio XXII (7), 434 – 437.
Pietila¨, H., 1997. The triangle of the human economy: House-hold-cultivation-industrial production. An attempt at mak-ing visible the human economy in toto. Ecol. Econ. 20 (2), 113 – 128.
Rahman, A., Robins, N., Roncerel, A. (Eds.), 1993. Exploding the population myth. Consumption versus population. Which is the climate bomb? Climate Network Europe, Belgium, 105 pp.
Statistics Sweden, 1997. Befolkningsprognos 1995 – 2050. Popu-lation Prognosis 1995 – 2050. Available at htpp://www.scb./
scbswe/borhtm/borbe3sw.htm. In Swedish.
Steen, P., Dreborg, K.H., Henriksson, G., Hunhammar, S., Ha¨jer, M., Rigne´r, J., A,kerman, J., 1997. Fa¨rder i framtiden. Transporter i ett ba¨rkraftigt samha¨lle. (Travelling in the future. Transportation in a sustainable society.) Kommu-nikationsforskningsberedningen, KFB-Rapport 1997:7, Stockholm, 263 pp. In Swedish.
United Nations, 1993. Agenda 21. United Nations Conference on Environment and Development, Rio de Janeiro, Brazil, 3 – 14 June 1992. United Nations Department of Public Information, New York, 294 pp.
United Nations, 1998. The 1998 Revision of the World Popu-lation Estimates and Projections. Department of Economic and Social Affairs, Population Division, New York. Infor-mation available at: http://www.popin.org/pop1998/. Verhagen, H., 1998. A Climate Fund based on equity. Change,
Research and Policy Newsletter on Global Change from the Netherlands, No. 41, April – May, 14 – 15.
Vilhelmsson, B., 1988. Befolkningen resvanor i ett tidsperpektiv. Livscykel och gerenationsaspekter perioden 1978 – 1985. (Time perspectives on travel patterns in Sweden. Lifecycle and generational changes in the access and use of transporta-tion from 1978 to 1985.) Department of Human and Economic Geography. University of Gothenburg, Sweden, Choros 1988:1, 106 pp. In Swedish.
Vilhelmsson, B., 1997. Vad pa˚verkar resvanorna? (Which fac-tors influence travelling?). In: Andersson H.E.B. (Ed.), Trafik och miljo¨. (Traffic and Environment.) Studentlitter-atur, Lund/Stockholm, 392 pp. In Swedish.
Vringer, K., Blok, K., 1995. The direct and indirect energy requirements of households in the Netherlands. Energy Policy 23 (10), 893 – 910.
Wackernagel, M., Rees, W., 1996. Our ecological footprint. Reducing human impacts on the Earth. New Catalyst Bioregional Series No. 9. New Society Publishers, Gabriola Island, BC, 160 pp.