36 CHAPTER III: RESEARCH METHODOLOGY
This chapter discusses research methodology which covers (1) research problems, (2) research design, (3) data collection, and (4) data analysis.
3.1 Research Problems
The research problems are formulated through the following research questions:
1. What is the correlation between students’ competence in writing narrative texts in Bahasa Indonesia and their competence in writing narrative texts in English?
2. Does the correlation of aspects of a narrative text in the two languages relate to its textual features?
3.2 Research Design
37 adds that correlational research is also sometimes referred to as associational research by means of studying the relationships among two or more variables without any attempt to influence them.
3.3 Data Collection
This section presents concerns related to data collection, including population and sample, research instrument, and phases of data collection.
3.3.1 Population and sample
The population of this study is the third grade students of MTsN (State Islamic Junior High School) Pagedangan Tangerang, which is located on Jl. Gunung Batu, sub-district of Pagedangan, the district of Tangerang, Banten. The population is all of the third year students of the school in 2008/2009 academic year. The way on how to take the sample of the study is the purposive sampling
technique. It means that the researcher assumes he can use their knowledge of the population to judge whether a particular sample will be representative (See Fraenkel and Wallen, 1993:87). The way was preferred since the researcher had consulted the teachers who taught Bahasa Indonesia and English to the student population.
38 3.3.2 Research instrument
This research uses two composition tests of students’ competence in writing narrative texts. Based on the 2006 curriculum of English, the tests have students write narrative texts both in Bahasa Indonesia and in English. The tests adapts the example of national examination specification for Sekolah Menengah
Pertama/Madrasah Tsanawiyah (Junior High School) in 2004. This test
specification was proposed by Pusat Penelitian Pendidikan Badan Penelitian dan
Pengembangan DEPDIKNAS (Center of educational research and development of
Department of National Education).
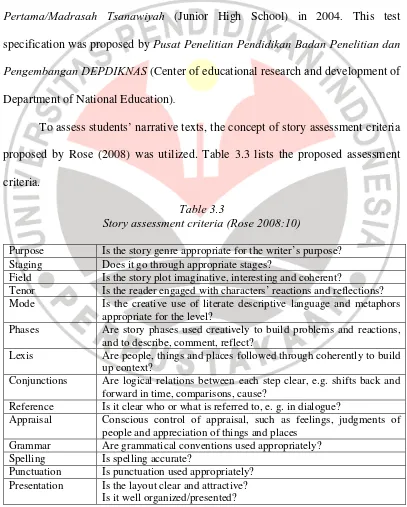
To assess students’ narrative texts, the concept of story assessment criteria proposed by Rose (2008) was utilized. Table 3.3 lists the proposed assessment criteria.
Table 3.3
Story assessment criteria (Rose 2008:10)
Purpose Is the story genre appropriate for the writer’s purpose? Staging Does it go through appropriate stages?
Field Is the story plot imaginative, interesting and coherent?
Tenor Is the reader engaged with characters’ reactions and reflections? Mode Is the creative use of literate descriptive language and metaphors
appropriate for the level?
Phases Are story phases used creatively to build problems and reactions, and to describe, comment, reflect?
Lexis Are people, things and places followed through coherently to build up context?
Conjunctions Are logical relations between each step clear, e.g. shifts back and forward in time, comparisons, cause?
Reference Is it clear who or what is referred to, e. g. in dialogue?
Appraisal Conscious control of appraisal, such as feelings, judgments of people and appreciation of things and places
Grammar Are grammatical conventions used appropriately? Spelling Is spelling accurate?
Punctuation Is punctuation used appropriately? Presentation Is the layout clear and attractive?
39 The numerical score is obtained by giving each criterion a score from 0 to 3, giving a total score out of 42 (14x3). 0 means there is no evidence of the criterion, while 3 means it is the top standard (Rose 2008:14). In assessing students’ composition in Bahasa Indonesia, the criteria above were adapted. The instruments (the tests) were enclosed in appendix 1.
3.3.3 Phases of Data collection
Data collection is carried out through some phases. The first phase is arranging the writing tests as the instrument of the study. The second is testing students with the arranged tests. The third is rating the narrative texts written by the students to obtain the data in the form of scores.
There were four raters engaged in evaluating the texts. The teacher who taught the language to the students at the selected setting firstly evaluated students’ narrative texts written in Bahasa Indonesia. The English teacher at that school also firstly evaluated students’ narrative texts written in English. Then, all students’ narrative texts were evaluated then by a student of Post-graduate studies of English Education Program at Indonesia University of Education Bandung (UPI Bandung). The university student was considered familiar with the concept of narrative assessment proposed by Rose (2008). Finally, the texts were reevaluated by the researcher himself.
40
Furthermore, the score on the two variables were calculated and analyzed by the following tabulation:
No. Sample X Y X2 Y2 XY
1. 001 …. …. …. …. ….
…. …. …. …. …. …. ….
∑ …. …. …. …. …. ….
3.4 Data Analysis
1988:136-41 137, Coolidge 2000:121-122,), and normality of each variable (See Brown 1988:136-137, Priyatno, 2008:28). The two tests are established using “SPSS 12.0 for Windows”.
When the collected data fulfil the criteria of normality and linearity . the correlation analysis uses “Pearson Product Moment” correlation formula. The formula stands as follows (See Hatch and Farhady 1982:198, Fraenkel and Wallen, 1993:175, Coolidge, 2000:116 ):
]
Y = students’ competence in writing narrative text in English
42 competence in writing narrative text in English. Besides manual analysis and computation using the above formula, the analysis also used “SPSS 12.0” for Windows (Priyatno, 2008:53-56).
To know the correlation between each aspect of students’ competence in writing narrative texts, the Pearson correlation will be used if the raw data of a component is normally distributed, (See Hatch and Farhady 1982:198, Brown 1988:136-137, Fraenkel and Wallen, 1993:175, Coolidge, 2000:116). On the other hand, when each raw data of a component is not normally distributed and two variables do not perform linear relationship, the correlation is analyzed using “Spearman Rho” (See Hatch and Farhady 1982:198, Cohen and Manion 1994:127, Sugiyono, 2007, 2008:244-245). For the statistical computation, the data analysis uses “SPSS 12.0 for Windows”.
Furthermore, the results of the analysis are used to test the stated hypothesis. The following are step-by-step procedures to test the hypothesis (Brown, 1998:121):
1. Look at the Ho (null-hypothesis) 2. Look at the αlevel
3. Comparing the robserved and rcritical
4. a. if the robserved was less than rcritical , it accepted the null-hypothesis and stopped.
b. if the robserved was greater than rcritical , it rejects the null-hypothesis and continues.
5. Decide which alternative hypothesis was more logical 6. Making interpretation and conclusion.
The interpretations of correlation are as follow (Burns, 2000): 1. 0.90 – 1.00 is very high correlation or very strong relationship 2. 0.70 – 0.90 is high correlation or marked relationship
43 4. 0.20 – 0.40 is low correlation or weak relationship
5. less than 0.20 slight correlation or the relationship is so small as to be negligible
The second step is analyzing the textual features of the narrative texts. The textual features include purpose, stages, field, tenor, mode, phases, lexis, conjunction, reference, appraisal, grammar, spelling, punctuation, and
presentation (Rose, 2008). The analysis is concerned with the similarities and the
differences of each aspect found in the two narrative tests: narrative texts written
in Bahasa Indonesia and narrative texts written in English.