M – 5
SOFTWARE DESIGN TO RISK ANALYSIS OF PADDY PRODUCTION WITH ENSO
INDICATORS
(CASE-STUDY: EAST JAVA)
Nisa Miftachurohmah1, Imam Mukhlash2, Sutikno3 1,2
Department of Mathematics, Sepuluh Nopember Institute of Technology Surabaya 3
Department of Statistics, Sepuluh Nopember Institute of Technology Surabaya
Abstract
Indonesia known as agrarian country, it caused by most its people are farmers. The level of paddy production in East Java was highest compared to other provinces. However, its level of production has decreased in recent years. This was caused by the lack of knowledge about risk management in paddy production. One of knowledge should be known is the change of seasons. In fact, the change of seasons was difficult to predicted due to global climate disruption. In previous study, ENSO was used to climate forecasts for decision-making in agriculture. A risk assessment framework could be used in policy decision-making processes. In this paper, we discuss about architecture design for decision support system (DSS) to risk of paddy production in East Java with ENSO indicators. ENSO indicators are SST (Sea Surface Temperature) anomalies, as predictor variables. Harvested area in East Java as respons variable. Predictor and respons variables is identified their correlation using Copula correlation. Estimation of harvested area is constructed using Robust regression model. The prediction level of risk of paddy production is determined using confidence interval (CI). The last, we construct DSS components, database systems, and user interface design. Key words: Decision Support Systems (DSS), agriculture, ENSO, copula correlation, robustregression
INTRODUCTION
Tropical country like Indonesia has two seasons, the dry season and the rainy season. The ground state in Indonesia is very suitable for agriculture. The most people of Indonesia are farmers, so that Indonesia is known as an agrarian country. The level of paddy production in East Java was highest compared to other provinces. On the other hand, its level of production was unstable in 2000 to 2013, even it has decreased in recent years (BPS, 2013). This was caused by the lack of knowledge about risk management in paddy production. One of knowledge should be known is the change of seasons. The El-Nino Southern Oscillation (ENSO) phenomenon results from the two-way interaction between ocen and atmosphere in the tropical Pasific Ocean (Podesta, 2002). Podesta also has explain that the phenomenon involves two extreme phases: warm events known as El-Nino, and cold events known as La Nina.
disruption. The climate disruption is related with rainfall impact on agricultural activity, especially paddy production, began from paddy planting until harvest time. The indicators that are sensitive to extreme circumstances which impact on the weather and climate ENSO indicators. The indicators are SST (Sea Surface Temperature) anomalies.
The overall goal of this paper are how algorithm to modelling data set for risk analysis of paddy production; and the architecture design for DSS to risk analysis of paddy production in East Java using ENSO indicators.
RESEARCH METHODS
In this study, we use data of harvested area from Department of Agriculture East Java (Dinas Pertanian Propinsi Jawa Timur). We use five areas in East Java as case study area, those are Banyuwangi, Jember, Ngawi, Lamongan and Bojonegoro. We also use SST anomalies data set; SST anomaly area 1+2, 3, 4 and 3.4. Those data set obtained from National Oceanic and Atmospheric Administration (NOAA).
Stages for the architectural design of decision support systems include: identification correlation between harvested area and SST anomalies using Copula correlation, constructing estimation of harvested area of paddy using robust regression model, constructing components of DSS.
a. Copula
Copula Gaussian, known as Copula Normal, obtained by transformation from random variables to multivariate standard normal distribution.
( , , …, , ) = ( ,Σ) ( , )( ) , ( , )( ) , …, ( , )( ) , ( , )( ) ( 1)
then density of Copula Gaussian as follows:
( , ,…, , )( , …, , )
= . … . . ( , , …, , )
= ( ,Σ)( ( , )( ) , ( , )( ) , …, ( , )( ) , ( , )( ) ) ( , )( ( , )( )∏ ( ( , )( ( , ) ) )
( 2)
Copula Archimedean has distributions with tail dependencies shows the conditional probabilities in the extreme regions. If : [ 0,1] →[ 0,∞) is continues, decreases, and a convex function, then ( 0) = ∞ and ( 1) = 0. : [ 0,∞) →[ 0,1] is inverse of . Copula Archimedean function : [ 0,1] →[ 0,1] can be written in equation (Nelsen, 1998 dalam ‘Anisa’, 2015):
( , , …, ) = { ( ) + ( ) + ⋯+ ( ) } ( 3)
with : [ 0,1] →[ 0,∞) is a perfect monotone, as follows:
(−1) ( ) ≥0, ∈Ν ( 4)
Generator of Copula is and its parameter is (Kpanzou, 2007). Several types of Copula Archimedean families namely: Copula Clayton, Gumbel, and Frank along with their generator are presented in Table 1.
Table 1. Family of Copula Archimedean
Copula Generator ( ) Copula Bivariat ( , )
Clayton −1
, ∈( 0,∞) + −1
Gumbel (−log( ) ) , ∈[ 1,∞)
exp − (−log( ) ) + (−log( ) )
Frank
log −1
−1 , ∈ \ {0}
1
log 1 + −1 −1
b. Robust Regression
Regression analysis is a model that describes the relationship between the predictor variable ( ) and the response variable ( ), such as the following equation:
= + + ( 5)
with is regression parameter and is residual with asumption ~ ( 0, ). The estimation of equation (5) can be expressed in the equation:
= + ( 6)
The value of (robust estimation scale) obtained by iteration.
( ) = −
( )
( 8)
with = 1, 2, … is the iteration, Φ is the inverse of the standard normal cumulative function,
( ∗) is a symmetric function of residual or functions that contribute to each of the residuals in the objective function. The influence function = ′ to minimize equation ( 7) is calculated as the value of the first partial derivatives to 0. It can be shown equation ( 9).
Equation ( 10) is denoted to a matrix, known as weighted least squares (WLS) and presented to equation ( 11).
= ( 11) with is a matrix for predictor variables, is a matrix for response variables, is a matrix for regression parameters, and is a matrix for weights.
WLScan be used to calculate M-estimation, then the estimation of parameter equation becomes:
= ( ) ( 12)
Table 2. The Objective Function, The Influence Function, The Weight Function in M-Estimation Tukey Bisquare
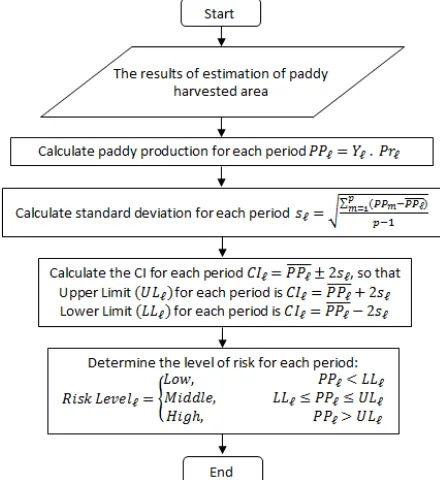
The confidence. How to calculate the confidence interval with 90% opportunities confidence shown in equation ( 13).
= ± 2 ( 13)
where is mean of population and s is the standard deviation that presented to equation ( 14).
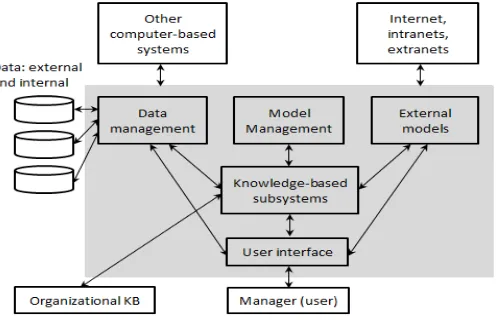
= Data-management subsystem, it includes a database contains relevant data for the situation and is managed by softwaer called the database management system (DBMS); Model management subsystem, this is a software that includes financial, statistical, management science, or quantitative models that provide the system’s analytical capabilities and appropriate software management; User interface subsystem, the user communicates with and commands the DSS through this subsystem. The Web browser provides a familiar, consistent graphical user interface structure for most DSS; and Knowledge-based management subsystem, this subsystem can support any of the other subsystems or act as an independent component. It provides intelligence to augment the decision-maker’s own (Turban, 2007).
Figure 1. A schematic view of DSS (Turban, 2007)
RESULT AND DISCUSSION
to be estimate.
Figure 2. Flowchart of identification the correlation and estimation
a. Identification of the Relationship Between Harvested Area of Paddy and ENSO indicators
The data set of harvested area of paddy and SST anomalies tested their normality using Komolgorov-Smirnov dan Anderson Starling. If the results of the normality of one or both methods are declared normal, then we calculate the correlation using Copula Gaussian followed by Copula Archimedean. However, if the results of the normality of the two methods is not normal, we calculate the correlation only using Archimedean Copula. The parameter of estimation in Copula Gaussian using Pearson approach, in Copula Archimedean using Tau-Kendall approach. Maximum Likelihood Estimation (MLE) is used to fitting and choosing copula with the best correlation results.
In general, the stages that must be passed in the identification of the relationship between the area harvested and ENSO indicators can be seen in Figure 3.
b. Estimation Modeling of the Harvested Area of Paddy Using Robust Regression
Figure 4. Flowchart of robust regression using M-estimation algorithm
In this study, we use M-estimation methods to estimation modelling in regression robust models. Based on regression equation generally, it always exist the parameter that calculated using OLS. After known, then we calculate the residual and robust estimation scale. The next step, we calculate the weight function of Tukey, and then we calculate the new parameter of estimation using WLS. The new parameter of estimation calculated iteratively into the value of parameter of estimation is convergent.
c. Determining the Level of Risk Prediction in Paddy Production
d. The model of DSS Components
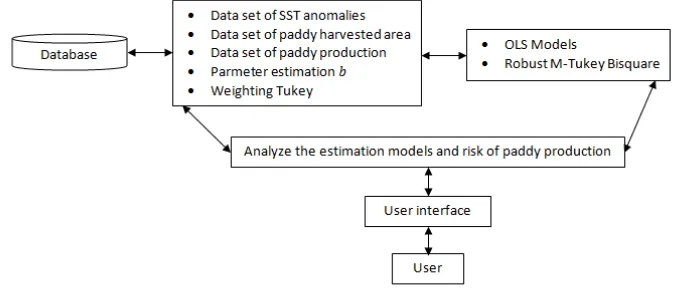
Turban (2007) have explained that there are four fundamental components in DSS, namely: data-management subsystem, model management subsystem, user interface subsystem and knowledge-based management subsystem. Therefore, we follow the architecture, so that we purpose the architecture design for DSS to risk analysis of paddy production shown in Figure 6.
All of data set related with DSS saved in database. Data management subsystem includes: input data set composed of data set of paddy harvested area, SST anomalies and paddy production; estimation and weight data obtained by estimation process using robust regression. Model management subsystem includes: initial estimation model using OLS, then continued using the estimated M-Tukey Bisquare. Knowledge-based subsystem includes: we analyze and determine the level of risk estimates paddy production using CI. The last, user interface subsystem includes: the results of the data information shall be transmitted to end user, and we will represent the result by thematic map.
CONCLUSION AND SUGGESTION
In this study, we have discussed the algoritm to identification the relatioship between harvested area and SST anomalies data; and estimation of harvested area. We also have discussed the architectural design of DSS to risk analysis of paddy production in East Java. We disucussed components of DSS includes: data management subsystem manage input data set composed of data set of paddy harvested area; SST anomalies 1+2, 3, 4 and 3.4; and paddy production, estimation and weight. In model management subsystem use OLS models and M-Tukey Bisquare. Analyzing and determining the level of risk estimates paddy production using CI in knowledge-based subsystem. The results are three levels of risk i.e: low, medium and high.The last, user interface subsystem transmit the data information to end user by graphical user interface, and represent the result by thematic map. In the next study, we continue to discuss about implementation of the software design to risk analysis of paddy production in East Java with ENSO indicators.
REFERENCES
Badan Pusat Statistik (BPS). (2013). Data Tanaman Pangan – Luas Panen, Produksi dan Produktivitas Padi Provinsi Jawa Timur, website: http://www.bps.go.id/tnmn_pgn.php. Fox, John. (2002). Robust Regression, Appendix to An R and S-PLUS Companion to Applied
Regression, accessed on Februari 24th, 2015, http:// cran.r-project.org/doc/...Companion/appendix-robust-regression.pdf.
Kpanzou, T. A. (2007). Copulas in Statistics, African Institute for Mathematical Science
(AIMS).
of Rice Production in East Java, Surabaya: Department of Mathematics, Sepuluh Nopember Institute of Technology.
National Oceanic and Atmosphere Administration (NOAA). 2015. http://www.cpc.ncep.noaa.gov/data/indices/sstoi.indices, acceessed on Desember 15th, 2014.
Paramitha O., Pratnya. (2012). A Copula Approach to Construct Vulnerability Rice Puso Maps in East Java with El-Nino Southern Oscillation (ENSO) Indicator, Surabaya: Department of Statistics, Sepuluh Nopember Institute of Technology.
Podesta, Guillermo., et. al. (2002). Use of ENSO-related climate information in Agricultural Decision Making in Argentina: A Piot Experience. Agricultural Systems, Vol. 74, Page. 371-392.
Qian, et.al. (2009). Interactions among ENSO, the Monsoon, and Diurnal Cycle in Rainfall Variability over Java, Indonesia, American Meteorological Society, Vol. 67, Page. 3509-3524.
Roberts, et. al. (2008). El-Nino Southern Oscillation Impacts on Rice Production in Luzon, Philipines, Journal of Applied Meteorology and Climatology, Vol. 48, Page. 1718-1724. Turban, Efraim, dan Aronson, Jay E. (2007). Decision Support Systems and Intelligent Systems,
New Jersey: Prentice-Hall International, Inc.
Xiangzheng, et. al. (2010), Impact of El Nino-Southern Oscillation Events on China’s Rice Production, Journal of Geographical Sciences, Vol. 20, Page. 3-16.