3D Building Façade Reconstruction Using Handheld Laser Scanning Data
F. Sadeghia*, H. Arefia, A. Fallah a and M. Hahn ba School of Surveying and Geospatial Engineering, University of Tehran, Tehran, Iran–[email protected]
(alaleh.fallah, hosein.arefi)@gmail.com
b Stuttgart University of Applied Sciences , Stuttgart, Germany –[email protected]
KEY WORDS: 3D Modelling, Grammar-based algorithm, Point cloud, Density histogram, RANSAC
ABSTRACT:
3D The three dimensional building modelling has been an interesting topic of research for decades and it seems that photogrammetry methods provide the only economic means to acquire truly 3D city data. According to the enormous developments of 3D building reconstruction with several applications such as navigation system, location based services and urban planning, the need to consider the semantic features (such as windows and doors) becomes more essential than ever, and therefore, a 3D model of buildings as block is not any more sufficient. To reconstruct the façade elements completely, we employed the high density point cloud data that obtained from the handheld laser scanner. The advantage of the handheld laser scanner with capability of direct acquisition of very dense 3D point clouds is that there is no need to derive three dimensional data from multi images using structure from motion techniques. This paper presents a grammar-based algorithm for façade reconstruction using handheld laser scanner data. The proposed method is a combination of bottom-up (data driven) and top-down (model driven) methods in which, at first the façade basic elements are extracted in a bottom-up way and then they are served as pre-knowledge for further processing to complete models especially in occluded and incomplete areas. The first step of data driven modelling is using the conditional RANSAC (RANdom SAmple Consensus) algorithm to detect façade plane in point cloud data and remove noisy objects like trees, pedestrians, traffic signs and poles. Then, the façade planes are divided into three depth layers to detect protrusion, indentation and wall points using density histogram. Due to an inappropriate reflection of laser beams from glasses, the windows appear like holes in point cloud data and therefore, can be distinguished and extracted easily from point cloud comparing to the other façade elements. Next step, is rasterizing the indentation layer that holds the windows and doors information. After rasterization process, the morphological operators are applied in order to remove small irrelevant objects. Next, the horizontal splitting lines are employed to determine floors and vertical splitting lines are employed to detect walls, windows, and doors. The windows, doors and walls elements which are named as terminals are clustered during classification process. Each terminal contains a special property as width. Among terminals, windows and doors are named the geometry tiles in definition of the vocabularies of grammar rules. Higher order structures that inferred by grouping the tiles resulted in the production rules. The rules with three dimensional modelled façade elements constitute formal grammar that is named façade grammar. This grammar holds all the information that is necessary to reconstruct façades in the style of the given building. Thus, it can be used to improve and complete façade reconstruction in areas with no or limited sensor data. Finally, a 3D reconstructed façade model is generated that the accuracy of its geometry size and geometry position depends on the density of the raw point cloud.
1. Introduction
The three dimensional building modelling has been an interesting topic of research for decades and it seems that photogrammetry provides the only economic means to acquire truly 3D city data (Fӧrstner, 1999). According to the enormous developments of 3D building reconstruction with several applications such as navigation system, location based service, and urban planning, the need to consider the semantic features (such as windows and doors) becomes more essential than ever, and therefore, a 3D model of building as block is not any more sufficient and the generation of the three dimensional detailed models is still an open question that needs research yet.
1.1. Related works
We can classify the modelling methods according to type of input data. The first class for 3D façade modelling is the image based modelling. It is a classic topic research and many academicians tender several methods. Ripperda used single image to detect façade elements and named terminals that used for façade grammar. Facade grammar describes the façade style. Reconstruction of façade is a stochastic process of interpreting a sensor data with the grammar (Ripperda, 2006). Cornelis used essential video frames, then dense matching between stereo
basic elements, then the façade grammar will be used to reconstruct vacant facades (Becker, 2009).
1.2. Overview of algorithm
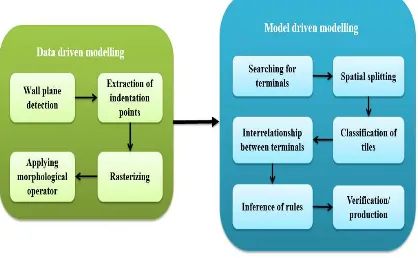
At first, the façade plane is detected and then it is decomposed to find the internal plane which contains façade elements using depth histogram. Then the rasterized inner plane is partitioned to extract structures, and the depth values are added to features using histogram. After bottom up modelling, the repeated components are detected and then clustered to find hierarchical interrelationship between them in order to infer the rules. Finally, the façade grammar that contains 3D basic elements and rules are used to complete the rest of façade. Figure 1 shows a flowchart of the grammar-based façade reconstruction with two bottom-up and top-down modelling steps. The following subsections are discussed each step of flowchart in details.
1.3. Dataset
The point cloud data that is used acquired by handheld laser scanner Zebedee, it is consist of 2d laser scanner and an inertial measurement unit mounted on one or two springs, it has 270 degrees field of view. Its mass is 210 g which makes it ideal for low measurement and it is maximum range is 30 m.
2. Plane Detection
The captured data by handheld laser scanner not only have information about buildings and façade planes but also irrelevant
objects such as tree, sign traffic, pedestrians and etc. are distinctive. So the façade plane must be separated from other objects. For this, the conditional RanSAC is used to detect walls in a way of keeping the windowsill and niches information, detect the major planes and increase the robustness of method. Figure 2 shows depth histogram that the highest peak is relative to main wall points, and the left peak shows the inner plane with façade elements points.
3. Cutting Out Non-Quality Data
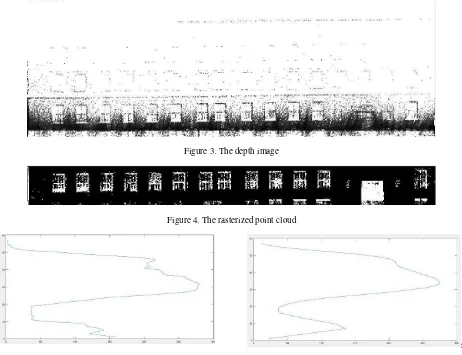
Because the low range of Zebedee, upper parts of façade were not scanned and also obstacles cause occluded area, the point cloud density is not homogenous and causes to bad influence on output model. Due to uncertainty and lack of details at top of façade plane, the properties and characteristics of basic elements cannot be inferred, so the low density parts are eliminated and the lower parts of façade plane with an acceptable density is just used. At first, the density histogram is plotted in both x and y direction to find the range which the number of points will decrease abruptly. After that, the data are clipped based on this range and used for the further process. Figure 3 shows the depth image that was used for clipping the dense data.
4. Decomposing Façade Plane
In this step, a histogram is plotted to find out the distribution of point cloud perpendicular to façade plane. This histogram have normally three picks that they indicate the protrusion, wall and indentation ranges. The inner points indicate the information about windows and doors (façade elements). A planeis fitted on points that situate in internal range and the next processes will be done on this plane.
Figure 2. The depth histogram
5. Rasterizing
In this step, the point cloud data is converted to low resolution binary image. For this, a two dimensional grid is created on façade points. The size of grid element is arbitrary and should be chosen by user. Each cell may contain point or not, that results in one and zero values, respectively. Binary image makes it possible to remove noises by image processing’s tools. Figure 4 shows the rasterized inner plane.
6. Feature Detection
For feature detection, the sum of values of each row and column are calculated separately. Based on the obtained values, the
vertical and horizontal histograms are plotted to determine the floors and basic elements of façade, respectively. It means that rows with minimum values in vertical histogram are probably the best candidate that floor separator lines pass through them must pass. Figure 5.a shows the horizontal histogram and Figure 5.b shows the smoothed one that it is easier to find the minimums. So each floor has the particular horizontal histogram. The columns with zero values of this histogram are selected and then a line passes through the middle of these adjacent columns. Figure 6.a and figure 6.b shows the vertical histogram and smoothed histogram for each floor, respectively. The advantage of our method related to previous researches is that there is no need to move the lines and change their positions. Figure 7 shows the partitioned façade without noise and extracted features.
After reticulation, each cell has a feature that the noise and isolated pixels are removed and the openings borders are refined by morphological operators. Then the searching process is started to find the pixels with one value. The pixels with the minimum and maximum row and column is used to discover the range of features. Then a rectangle is fitted to them. In proposed method, we can compute the planner coordinates of features and for determining depth we use the histogram that generated in section 4.
Figure 3. The depth image
Figure 4. The rasterized point cloud
Figure 5.a. The horizontal histogram
s
Figure 6.a. The vertical histogram for each floor Figure 6.b. The smoothed vertical histogram for each floor
Figure 7. Partitioned façade without noise and extracted features
7. Façade Grammar
The output model of data-driven reconstruction has all the information and is the base for further process in top down modelling. The façade grammar describes the architectural appearance of façade and can add details to areas with no sensor data. It can also modify façade in areas with non-accurate data. Indeed façade grammar is composed of vocabularies or terminals (T), production or replacement rules (R), non-terminals that can be replaced by terminals (N) and vacant façade that is a starting point for substitution that named V, and the façade elements constitute the vocabulary of the grammar and the interrelationship between the vocabs form the rules.
The rest of the process is divided to three steps; at first step, the basic component of façade that are known as geometry tiles must be identified and their properties such as width and height are stored, blank space between geometries are considered as wall
tiles and just the width property will be saved for this kind of elements. The second step is formation of higher order structure from terminals and inferring the rules and the last step is about completion of façade and adding façade elements to areas with no data.
7.1. Floor determination
The binary image that was created in section 5, is used to diagnose the floors. The arrangement of geometries effects on determination of floors, i.e. if upper side of geometries are approximately in a line , the rows with zero values are chosen, then a line is passed through the middle of these adjacent rows. For the case one of geometries is shifted vertically and top side of geometries aren’t in a line, the same work is done for columns, then the area between two vertical delimiter is just considered. Floor lines are specified then those situated near each other are merged. Figure 8 shows façade and separator horizontal lines.
Figure 8. Detected floors using vertical and horizontal lines
7.2. Detection of terminals
As mentioned before, the basic irrefrangible elements of façade form the vocabularies of the grammar. Detection of geometries is based on shifting vertical line for each floor to find changes in binary image and then geometries, walls and their width will be stored for each floor. Height is an additional property which is just stored for the geometries.
7.3. Clustering the tiles
Due to the large volume that was occupied by information, the information should be summarized by clustering the tiles and grouping them. Classification of wall tiles is based on width property and walls with same width will be situated in a group, while for clustering the geometry tiles, depth image is used. For this aim, we lay a two dimensional grid over the façade points. The grid elements size is a bit larger than point sampling size. For cells with more than one point, the nearest point to the façade plane and its perpendicular distance as its pixel value are
considered. For the cell with no point, the pixel value is set zero, and then the pixel values are normalized into the range [0, 1]. For classification, the correlation values of depth images are evaluated, and a threshold is determined, so if correlation value is higher than the threshold, two geometry are in a same cluster.
7.4. Interrelationship between terminals
1. The proposed method is able to remove three adjacent symbols in the form of gwg (g, w is the symbol of geometry terminal and wall terminal respectively) contrast to SEQUITUR that it just considers two adjacent symbols.
2. No triples occur more than once while the SEQUITUR removes the replaced structure that appears once. 3. The proposed method first prioritize triplets with small
wall terminal but in SEQUITUR there is no priority.
So, the algorithm is applied in order to compress the tile sequences, this is done fully automatically until there is no repeated triple (gwg).
The hierarchical interrelationship between terminals can be stored, and each terminal and structure can have a hierarchical value. Terminals and structures in compressed string will have the highest value and lower order structures and terminal will get lower hierarchical value gradually.
7.5. Rule inference
Based on sets of terminals and non-terminals, rules which are the most important parts of façade grammar can be inferred. In rest of subsection the rules are categorized and introduced in details.
The rules p1 and p2 corresponds to horizontal and vertical partitioning of façade, rule p1 divides façade into floors, so the horizontally partitioned façade is indicated by Ws. Floor is split into tiles by rule p2, and it substitutes the floor to the sequence of tiles in the form of wall tile, geometry tile and wall tile. Rule p3 substitute geometry non-terminal to structures that explained section 7.4. Geometries and wall terminals produce rules p4 and p5, respectively. The first condition is to ensure that there is enough space in façade, and second condition in rule p5 is for preventing generate structures, for example the wall tile wi which is part of structure Sk cannot be nearby Sk.
P1: VWs P2: W WGW
If width (W)≥width (WGW)
P3: GSi: P �|p If width (G)≥width (Si) P4:Ggi: P �|p If width (G)≥width (gi)
P5:Wwi: P �|p
width (W)≥width (wi) & &
hierarchy left-context≤left_hierarchy wi & & hierarchy right-context≤right_hierarchy wi
8. Production
As mentioned before, we use just dense areas to extract features and infer the grammar, then remaining parts of façade should be enriched during production process.
At first, wi terminals at façade borders are replaced by non-terminals, then the geometry non terminal is selected in the string and a rule with this non terminal is chose. After that, the terminals are substituted by non-terminals and it is repeated until all terminals are situated, otherwise the process will be continued by another non-terminal. Sometimes, there is more than one rule to replace nonterminal, so it needs to determine the probability of occurrence of each rule at any position, and select the rule with highest probability. The (pi|x) is calculated as follows:
P ��|� =P(�|pP ��).P �� (1)
Where� ��|� denotes the required posterior probability of the rule pi for a given position x on the façade.� �� is the probability for the occurrence of pi that it can approximated by hierarchical of rules.
The � � is marginal probability of x
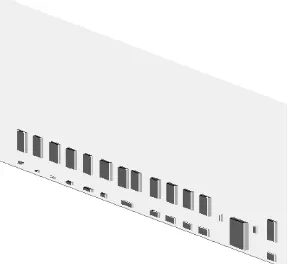
Figure 9 shows the data-driven output model that is restricted to dense data, figure 10 shows the grammar based model that has predicted features in no data area. It is obvious non reconstructed features during data-driven modelling are not predicted in grammar based façade reconstruction.
Figure 9. The data driven output model
Figure 10. The grammar-based output model
9. Conclusion
homogeneous dense data for façade reconstruction is not possible. In this paper, a grammar based façade reconstruction was implemented. We restricted data-driven modelling to areas with dense data and we just used the dense data related to lower floors, using dense parts of data caused to derivate vivid elements, and removing noise aims to preventing generate unrealistic features also using vertical histogram for each floor increase the automation level of data driven process, we extracted three dimensional structures from data driven output model, then the remaining part of façade was completed via inferenced grammar.
10. References
Becker, S., Haala, N., Fritsch, D., 2008. Combined Knowledge Propagation for Facade Reconstruction. IAPRS & SIS Vol. 37 (B5), pp. 1682-1750
Becker, S. and Haala, N. 2009, Grammar Supported Facade Reconstruction from Mobile LIDAR Mapping. In Proc. CMRT (XXXVIII, Part 3/W4; Paris, France: Int. Arch. Photogramm., Remote Sens. Spatial Inf. Sci), 229–234.Becker, S., 2009. Generation and application of rules for quality dependent facade reconstruction. ISPRS Journal of Photogrammetry and Remote Sensing, 64(6), pp. 640-653.
Bosse, M., Zlot, R. and P. Flick. Zebedee: Design of a spring mounted 3D range sensor with application to mobile mapping. IEEE Transactions on Robotics, 28(5), pp. 1104–1119
Cornelis, N., Leibe, B., Cornelis, K., Gool, L., 2008. 3d urban scene modeling integrating recognition and reconstruction. International Journal of Computer Vision Vol. 78, No. 2-3, pp. 121-141
Forstner, W., 1999. 3D-city models: Automatic and semiautomatic acquisition methods. In: D. Fritsch and R. Spiller (eds), Photogrammetric Week 99, Wichmann Verlag, pp. 291– 303
Frueh, C., Jain, S. and Zakhor, A. 2005. Data processing algorithms for generating textured 3d building facade meshes from laser scans and camera images. Int. J. Comput. Vision, 61(2), pp. 159-184.
Haala, N., Becker, S., Kada, M., 2006. Cell Decomposition for the Generation of Building Models at Multiple Scales. IAPRS Vol. 36 (3), pp. 19-24
Schnabel, R., Wahl, R., and Klein, R. 2007, Efficient RANSAC for Point-Cloud Shape Detection, Computer Graphics Forum, 26 (2), pp. 214-26.
Ripperda, N. and Brenner, C. 2009, Application of a Formal Grammar to Facade Reconstruction in Semiautomatic and Automatic Environments, AGILE International Conference on Geographic Information Science
Pu, S. and Vosselman, G. 2009, Knowledge based reconstruction of building models from terrestrial laser scanning data, ISPRS Journal of Photogrammetry and Remote Sensing, 64 (6), pp. 575-84.
Nevill-Manning. 1997. Compression and explanation using hierarchical grammars. The Computer Journal 40 (2-3), pp. 103-116.
Ripperda, N., Brenner, C., 2006. Reconstruction of façade structures using a formal grammar and rjMCMC. In: Proceedings of the 28th Annual Symposium of the German Association for Pattern Recognition DAGM 2006. pp. 750-759.