ROLE OF TIE-POINTS DISTRIBUTION IN AERIAL PHOTOGRAPHY
S. Kerner a
, I. Kaufman a
, Y. Raizman a
a
VisionMap, 19D Habarzel, Tel Aviv, Israel - {slavak, itay, yuri}@visionmap.com
KEY WORDS: Photogrammetry, Image matching, Tie-Points, Feature-based matching, RANSAC, Von Gruber positions
ABSTRACT:
Automatic image matching algorithms, and especially feature-based methods, profoundly changed our understanding and requirements of tie points. The number of tie points has increased by orders of magnitude, yet the notions of accuracy and reliability of tie points remain equally important. The spatial distribution of tie points is less predictable, and is subject only to limited control. Feature-based methods also highlighted a conceptual division of the matching process into two separate stages – feature extraction and feature matching.
In this paper we discuss whether spatial distribution requirements, such as Von Gruber positions, are still relevant to modern matching methods. We argue that forcing such patterns might no longer be required in the feature extraction stage.However, we claim spatial distribution is important in the feature matching stage.
We will focus on terrains that are notorious for difficult matching, such as water bodies, with real data obtained by users of
VisionMap’s A3 Edge camera and LightSpeed photogrammetric suite.
1. INTRODUCTION
Image matching is a key stage in photogrammetric adjustment. It is a problem of great interest in computer vision. Specific matching algorithms were developed in the context of aerial photography. One of the methods discussed in this paper is specifying tie-points’ spatial patterns. Von Gruber positions are the standard method used in photogrammetry.
We start by giving a brief historic overview of image matching, from the manual to the automated era, specifically in aerial photogrammetry.
We proceed to analyze different use-cases, emphasizing the most difficult scenarios for matching.
Finally we discuss tie-points’ spatial distribution patterns in modern aerial triangulation, focusing on feature-based matching as the currently dominant method. We argue that forcing such patterns might be no longer required in feature extraction stage. However, we claim spatial distribution is important in the feature matching stage.
2. IMAGE MATCHING OVERVIEW
2.1 Manual Matching
In the manual matching era, identifying tie-points was the most time-consuming process in aerial triangulation. Consequently, minimizing the number of tie-points, while preserving photogrammetric accuracy and stability, was a major challenge. Much research was carried out, and several distribution patterns were advised, with Von Gruber positions being most popular. A typical pattern had several tie-points spread in a gridded manner across image. One of the underlying assumptions was an accurate flight with guaranteed high overlaps, both along and across-track. Another assumption was that most of the image was "matcheable", that is – one could reliably find tie-points throughout the whole image.
2.2 Automated Matching
Starting in the 1990s, the matching process became automated. Various approaches were employed: spatial vs. frequency domain, featured points vs. lines vs. contours, area correlation based vs. feature based, etc.
Extracting tie-points became "cheap", yet it was still desirable to limit the number of tie-points, as the run-time of matching, and subsequent photogrammetric adjustment, was of great importance.
2.2.1 Area-based matching
Probably the most common method during the 2000s was area-based: identifying highly featured points in a source image (e.g. (Shi, 1994)), extracting image patches around the points, and recognizing these patches in the target image, most often using NCC (e.g. (Lewis, 1995)). It was common to force source points to lie on a grid, or to be close to the grid vertices. An image pair typically yielded dozens of tie-points.
One of the limitations of this approach was performance: if relative transformation between the source and target image was not well estimated, one would have to choose between a long processing and pyramid approach, running the risk of mis-match. Additionally, while being stable over radiometric changes, this approach wasn't robust enough for scale and rotation.
2.2.2 Feature-based matching
Prior to the 2000s, aerial photography was one of the driving forces behind computer vision. During the 2000s, an abundance of digital cameras (and later cellular phones) and overall computerization led computer vision to focus on general image matching problems. Much progress was made over the last decade, particularly in feature-based matching, as this approach proved to be most robust and efficient for the generic setting. Several new matching methods were proposed (e.g. (Bay, 2006) and (Lowe, 2004))
Also during the 2000s, hardware improvements, the continued growth of clusters, and particularly the introduction of The International Archives of the Photogrammetry, Remote Sensing and Spatial Information Sciences, Volume XL-3/W4, 2016
EuroCOW 2016, the European Calibration and Orientation Workshop, 10–12 Feb 2016, Lausanne, Switzerland
This contribution has been peer-reviewed.
(GP)GPU led to a dramatic runtime reduction. As runtime decreases rapidly, storage/network IO becomes the bottleneck. Consequently, it is highly desirable to read each image only once. Feature-matching proves suitable: at stage 1, each image is read, and its featured points are extracted alongside descriptors. These are stored in DB, typically requiring x10-100 less storage than the original imagery. At stage 2, featured points of each overlapping image pair are matched. A common practice is to fit a transformation (e.g. homography) based on the matches (typically using RANSAC (Fischler, 1981) or RANSAC-like majority voting scheme), and remove matches
that don’t agree with the transformation. This encouraged developing numerous variations and improvements on RANSAC (Torr, 2000), (Torr, 2002), (Chum, 2004), (Feng, 2003), (Choi, 2008).
Hundreds of tie-points become the norm. Tie-point abundance also leads to improved robustness and accuracy of following photogrammetric adjustment.
3. IMAGE MATCHING IN AERIAL PHOTOGRAPHY
3.1 Problem is simple
We argue that image matching in aerial photography is usually an easier problem than image matching in the general settings of computer vision. Some of the reasons:
Images are captured in a controlled manner, and one knows which pairs of images actually overlap, Images are taken with significant overlaps, All objects are of similar depth,
Images come from the same camera, Images are large, high-quality,
Images are taken in good light conditions, Scene is large, diverse,
Most of the scene is static.
On the other hand, some of image matching challenges in the context of aerial photography are well met by robust feature descriptors:
Invariance to rotation, Invariance to scale,
Invariance to lightning conditions, exposure time,
Little or no prior knowledge of transformation between images (that's usually the case when IMU is not present).
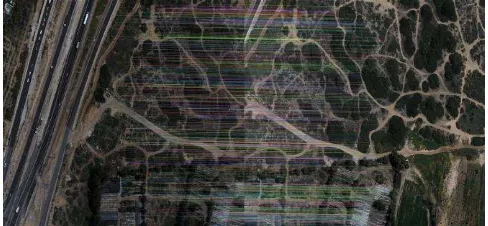
As a result, feature-based image matching in aerial photography is now a very accurate and reliable procedure, most of the time (fig. 1).
Figure 1: Typical problem; numerous correct tie-points
3.2 Problem is complicated
3.2.1 Clouds
While cloudy images have been somewhat difficult to match using area-based methods, this is less the case when feature-based matching is used. Assuming some parts of the image are not covered by clouds (otherwise the image is of no use anyway) - these are easily identified and matched by any of the common feature-based methods (fig. 2).
Figure 2: Matching clouded images
3.2.2 Repetitive areas
Areas of repetitive pattern are difficult to match, as the correct
match area is almost identical to that of the outlier. That’s
sometimes the case with perfectly gridded agricultural areas, large solar fields etc.
Using a ratio test (e.g. (Lowe, 2004)) is critical; it allows ignoring featured points at high risk of being outliers, and choosing less-featured points that are unique. Any prior estimation of transformation between images is of great use, for example – based on GPS, gyro accelerometers or IMU.
Based on our experience, the absolute majority of repetitive images are reliably and accurately matched (fig. 3).
Figure 3: Matching images with repetitive areas
3.2.3 Desert
While desert was always notorious for difficult matching, that’s not necessarily true with modern matching. Almost all desert images we encounter have grains of featureness scattered across the image (stones, dunes, plants etc.). Most importantly – these features are stable during a flight.
3.3 Problem is difficult
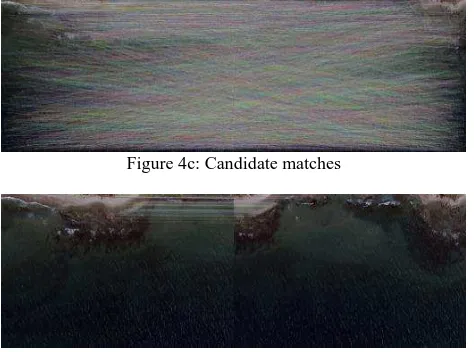
In our experience, water bodies with small objects like small islands or rocks, stones or natural or manmade objects surrounded by water are the biggest challenge in aerial photography image matching. It is necessary that every image containing any information (bridge, pierce, rocks, islet etc.) will be robustly matched (fig. 4A, 5A). A large river or strait often breaks a project into two disconnected areas, leading to inconsistent adjustments of both areas, or to the need for additional GCPs. It is therefore crucial to match all images that allow connecting both components. Also, often images with ground features or structures surrounded by water might be lost. The International Archives of the Photogrammetry, Remote Sensing and Spatial Information Sciences, Volume XL-3/W4, 2016
EuroCOW 2016, the European Calibration and Orientation Workshop, 10–12 Feb 2016, Lausanne, Switzerland
This contribution has been peer-reviewed.
Unlike desert, images of water bodies contain numerous pixels of high featureness (such as reflections, waves, sea foam, ripple etc.), that move over time. These are bound to become outliers (fig. 4b, 5b). That risk is especially high between consecutive images: with a typical difference of 1 sec, a wave might move these points consistently, leading a RANSAC-like scheme to select these as compatible matches. In practice, this might lead to a mismatch of a few pixels.
Figure 4a: Water with small objects - source (l.) and target (r.).
Figure 4c: Candidate matches
Figure 4c: Matches filtered by RANSAC-fitted homography
Figure 5a: Water with small objects: source (l.) and. target (r.).
Figure 5b: Candidate matches
Figure 5c: Matches filtered by RANSAC-fitted homography
4. TIE-POINTS’ SPATIAL DISTRIBUTION
4.1 Forcing spatial constraints in the feature extraction stage
As claimed above, the challenging scenarios occur when there are few small matchable objects in image. We argue that in these cases, forcing tie-points to behave according to some spatial distribution is detrimental.
A typical scheme to which most spatial constraints can be reduced is:
Split the image into N regions,
Select the best M features in each region.
In the case in question, it often occurs that all features fall within one region. Spatial constraints might produce two negative effects:
Selecting only M points from the whole image – might result in too few points,
Forcing or encouraging the extraction of featured points in regions where there are none – increases the risk of incorrect matches.
4.2 Forcing spatial constraints in the feature matching stage
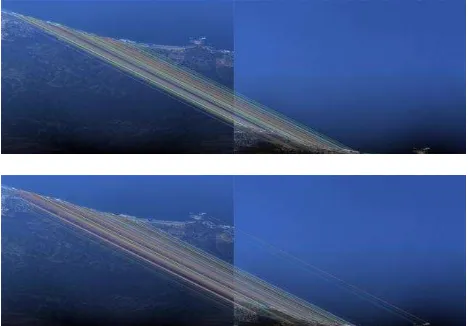
We argue that forcing spatial constraints may be beneficial at the stage of fitting transformation (RANSAC-like step). Spatial distribution of tie-points becomes critical when most tie-points in the image are clustered in a spatially degenerate configuration: either in a small part of the image, or in a linear alignment. In that case, fitted transformation is unstable and unreliable. As a result, correct tie-points outside the cluster will be filtered out.
We suggest giving preference, at the RANSAC-like step, to transformation agreeing on spatially scattered points. There are two steps in RANSAC causing the above phenomenon:
The fitting subset is small (often 4 candidates), and selected randomly. As a result, when one cluster contains the vast majority of candidate matches in an image, most fitting subsets will be based on that cluster only; therefore most transformations will be degenerate.
The voting step gives identical weight to all candidates. One could say RANSAC prefers quantity over quality. RANSAC might choose transformation supported by all points in a cluster, rather than transformation supported by part of cluster, and other points outside the cluster.
We tried several modifications to the RANSAC step:
Apply RANSAC iteratively, with converging tolerance threshold. That allows keeping, at least in the first iterations, tie-points outside the cluster, even when fitted transformation is degenerate.
Encourage RANSAC to construct a fitting subset from spatially distributed points. For example, after three points are selected randomly, the fourth point is required to be distant.
Recognize the degenerate cluster that RANSAC produced, and try to re-match points outside the cluster. The cluster is modelled as ellipse, and is The International Archives of the Photogrammetry, Remote Sensing and Spatial Information Sciences, Volume XL-3/W4, 2016
EuroCOW 2016, the European Calibration and Orientation Workshop, 10–12 Feb 2016, Lausanne, Switzerland
This contribution has been peer-reviewed.
declared degenerate if its minor radius is below threshold.
Run RANSAC on each cluster separately, and compare estimated transformations. The K-means method was used to separate clusters. Majority transformation was chosen.
In the RANSAC voting step, give larger weight to points not coming from a dominant cluster (if such exists).
In all cases of clustered tie-points, where standard RANSAC filtered out tie-points outside the cluster – the spatial RANSAC variations we tested produced better spread of tie-points (as in fig. 6). However, each method had partial success; none was decisively best.
Figure 6: Matches using standard RANSAC (top) vs. matches using variation on RANSAC that prefers even spatial distribution (bottom). Note the linear cluster of tie-points in top, and additional tie-points outside the cluster bottom
5. CONCLUSIONS AND FUTURE WORK
Over the last 20 years, algorithmic and hardware advances made image matching in aerial photography easy, robust, reliable and fast. The biggest challenge is posed by images with few true features (often coming in clusters), and many outliers. A typical scenario is a water body with small objects.
Feature-based matching, currently the dominant method, naturally assumes no pattern for tie-points’ spatial distribution. Furthermore, we believe forcing tie-points’ spatial distribution patterns at the extraction stage is no longer required. However, we believe encouraging spatial distribution patterns at matching stage may be beneficial in the challenging scenarios, preventing degenerate configurations.
More work is needed to develop a robust algorithm, forcing stable spatial distribution in the matching stage. We believe the best direction is to develop a variation of RANSAC preferring a consensus set spread across the image.
REFERENCES
Bay, H., Tuytelaars, T., and Van Gool, L., 2006. Surf: Speeded up robust features. In European Conference on Computer Vision
Choi, S. and Kim, J.H. 2008. Robust regression to varying data distribution and its application to landmark-based localization.
In Proceedings of the IEEE Conference on Systems, Man, and Cybernetics
Chum, O., Matas, J. and Obdrzalek, S. 2004. Enhancing RANSAC by generalized model optimization. In Proceedings of the Asian Conference on Computer Vision (ACCV)
Feng, C.L. and Hung, Y.S. 2003. A robust method for estimating the fundamental matrix. In Proceedings of the 7th Digital Image Computing: Techniques and Applications, number 633–642,
Fischler, M.A., and Bolles, R. C., 1981. Random Sample Consensus: A paradigm for model fitting with applications to image analysis and automated cartography. Communications of the ACM, 24(6):381–395
Lewis, J.P. 1995. “Fast normalized cross-correlation,” Tech. Rep., Industrial Light & Magic
Lowe, D. G. 2004. Distinctive image features from scale-invariant keypoints. International Journal of Computer Vision, 60(2):91–110
Shi, J. and Tomasi, C., 1994. “Good Features to Track”, Proc. IEEE Conf. on Computer Vision and Pattern Recognition,
Torr, P.H.S. and Zisserman, A. 2000. MLESAC: A new robust estimator with application to estimating image geometry. Computer Vision and Image Understanding, 78:138–156
Torr, P.H.S., 2002. Bayesian model estimation and selection for epipolar geometry and generic manifold fitting. International Journal of Computer Vision, 50(1):35–61
The International Archives of the Photogrammetry, Remote Sensing and Spatial Information Sciences, Volume XL-3/W4, 2016 EuroCOW 2016, the European Calibration and Orientation Workshop, 10–12 Feb 2016, Lausanne, Switzerland
This contribution has been peer-reviewed.


