SIGNIFICANT WAVE HEIGHT DETERMINED FROM SEQUENCE OF X-BAND
RADAR IMAGES USING TEAGER-HUANG TRANSFORM
M. R. Mortazavia,*, C. J. Huang a, b, L. C. Wu b,
a Department of Hydraulic and Ocean Engineering, National Cheng Kung University, Tainan, Taiwan - (N88017017, cjhuang)@
mail.ncku.edu.tw
b Coastal Ocean Monitoring Center, National Cheng Kung University, Tainan, Taiwan - [email protected]
KEY WORDS: Remote Sensing, X-band Radar, Significant Wave Height, Ocean Waves, Empirical Mode Decomposition, Teager-Kaiser Energy Operator.
ABSTRACT:
This work introduces a nonlinear and data-dependant method for extracting the significant wave height from a sequence of X-band radar images, which is based on the Teager-Huang Transform (THH). The THH comprises two parts, which are empirical mode decomposition (EMD) and application of the Teager-Kaiser energy operator (TKEO). EMD is applied to decompose the images into various decompositions, which are narrow-banded and have mono-components; TKEO separates the aforementioned narrow-banded components into their amplitude and frequency. The standard deviation of the separated amplitude is related to
Hs
, and, the relation is obtained by calibrating radar data with in situ data (buoy). The separated frequencies reveal the orientation and intensity of data, which are directly related to the direction of the waves. For validation, the method was applied to sequences of radar images that were obtained from the west coast of Taiwan. The results obtained using the method indicate that THH can be used specifically to estimate Hs with a root mean square error (RMSE) of 0.34 m. Furthermore, the developed method can efficiently measure the direction of waves at each specific point in an image.1. INTRODUCTION
Severe ocean waves can destroy offshore and coastal construction. Significant wave height has been considered to be an important factor that measures severity of ocean waves. In recent years, many studies have attempted to obtain the significant wave heights (
Hs
) using X-band radar images. The advantages of the method, including high resolution, vast area coverage and cost-efficiency, distinguish X-band radar from conventional instruments for measuring wave height, such as data buoys. Several methods have been proposed for estimatingHs from sequences of X-band radar images, including those based on the 3-D Fourier transform and the signal-to-noise ratio. However, these methods are linear and treat input data as homogenous.
Young et al. (Young, 1985) were the first to indicate that the parameters of waves can be extracted from marine X-band radar image sequences by utilizing the three-dimensional Fourier transform (3D FFT). Many researchers (Ziemer, 1994- Seemann, 1999- Nomiyama, 2003) have confirmed the method. However, FFT treats data as homogenous and stationary whereas surface waves are non-stationary and non-homogenous. Recently, Huang (Huang, 1998) introduced a new method of data processing called Empirical Mode Decomposition (EMD), for analyzing non-homogenous and non-stationary data. EMD decomposes a signal into a finite number of AM-FM subcomponents that are called intrinsic mode functions (IMFs). IMFs meet two criteria. First, the number of extrema and the number of zero-crossings should be equal or differ by just one. Second, at any point, the mean value of the envelope defined by the local maxima and the envelope defined by the local minima must be zero. These characteristics make IMFs appropriate for determining the instantaneous frequency (IF).
One of the most efficient methods for determining IF is the use of the Teager-Kaiser Energy Operator (TKEO) (Kaiser, 1990- Yu, 1991-Kaiser, 1993- Maragos, 1995). TKEO is a nonlinear operator which uses only neighboring data to provide information about the frequency and amplitude at each point. TKEO calculates the energy of a signal from the square of the product of its amplitude and frequency. The energy that is thus obtained can be separated into instantaneous frequency and amplitude using the energy separation algorithm (ESA). Therefore, to provide instantaneous and detailed information and to take into account the non-homogeneity of ocean waves, this work introduces a novel algorithm to determine
Hs
from marine X-band radar images by utilizing EMD and TKEO. The results thus obtained are presented and the efficiency of the determination ofHs
using the EMD-TKEO method is examined.2. DATA ACQUISITION
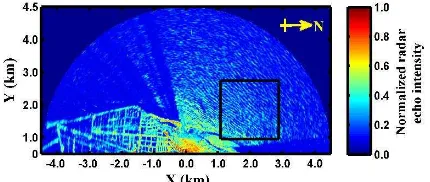
The data that were used in this work were obtained using a Furono X-band radar that was mounted about 20 m above mean sea level at 23° 6' 47.50"N and 120° 3' 8.20"E on the west coast of Taiwan. The radar operated at 9.4 GHz and with horizontal polarization (HH). The period of antenna rotation was 1.42 s and the image resolution was 7.5 m by 7.5 m. Figure 1 presents an example of a radar image. The rectangle delineates the area of interest, and has an area of 1.8 by 1.8 km. The intensity of the radar image is normalized. The arrow indicates north and the
x
andy
axes represent distance in kilometers. To compare results obtained using the radar from those obtained in situ, a buoy was mounted at the study site. The buoy recorded data hourly.The International Archives of the Photogrammetry, Remote Sensing and Spatial Information Sciences, Volume XL-7/W3, 2015 36th International Symposium on Remote Sensing of Environment, 11–15 May 2015, Berlin, Germany
This contribution has been peer-reviewed.
Figure 1. Example of radar image of sea surface. The square in the image delineates the analyzed area
3. METHODOLOGY
To extract information about ocean waves from radar images, those images must be processed in two main steps. The first step decomposes the non-homogenous and non-stationary radar images by EMD into a finite number of AM-FM IMFs. The second step applies the TKEO on IMFs in order to obtain the energy of the signal and to separate the signal into its amplitude and frequency by ESA, based on TKEO. The two essential parts of the method, EMD and TKEO, are introduced here.
3.1 EMD
EMD is the main part of the Hilbert Huang Transform for analyzing non-homogenous and non-stationary data. EMD decomposes signals by sifting. Initially, the local minima and maxima should be identified. Connecting the maxima to each other using a cubic spline yields the upper envelope; the minima are similarly connected to obtain the lower envelope. The mean of the two envelopes is denoted as m1; and the difference between the data and the mean is h1
1 1 x(t) m
h (1)
The procedure ends if h1 satisfies the aforementioned criteria for IMF; otherwise, h1 will be considered as new data; m11 is the mean of h1 and the difference between the data, h1, and the mean is h11. The process is repeated k times until the first IMF, h1k that satisfies the aforementioned criteria, is obtained. The term m1k in Eq. (3) is the mean of h1 (k-1).
11 1
11 h m
h (2)
k k
k h m
h1 1(1) 1 (3)
k h
c1 1 (4)
First IMF,
c
1, contains the highest harmonic components of the signal so, subtractingc
1 from the original signal yields the first residualr
1. The residual still contains information about the original signal, so it is treated as new data in obtaining the second IMF. The procedure is repeated until all IMFs are extracted.1 1
x
(
t
)
c
r
(5)n n
n
r
c
r
1
(6)Figure 2. Comparison of
Hs
values obtained from radar images (in red) and buoy (in black)Figurer 3. Root mean square error (RMSE) between the
Hs
values that were obtained by the buoy and the radar
n
j j n
r c t x
1 )
( (7)
The signal can be reconstructed by summing IMFs
and the last residual. Subtracting the last IMF from
the signal yields the last residual,
r
n,
which is a
constant, a monotonic function or a function only
with one extrema, excluding the possibility of
subtracting another IMF from it. In the case of
image decomposition, 2-D EMD can be simply
obtained using method that was developed by Chen
(Chen, 2009).
3.2 TKEO
For a continuous 2D AM-FM signal
)
cos(
)
,
(
)
,
(
x
y
A
x
y
x
y
s
x
y , the TKEO operator is,) , ( ) , ( ) , ( )] , (
[ 2
2s x y sx y sx y sx y
(8)
where A represents the amplitude of the signal;
is the frequency of the signal, and 2is the Laplacian.The amplitude can be separated by ESA (Diop, 2009) using Eq. (9).
The International Archives of the Photogrammetry, Remote Sensing and Spatial Information Sciences, Volume XL-7/W3, 2015 36th International Symposium on Remote Sensing of Environment, 11–15 May 2015, Berlin, Germany
This contribution has been peer-reviewed.
) orientation of frequency at each point of a 2D AM-FM image, according to Eqs. (10) and (11), respectively.
)]
where f is the absolute frequency, and
is the orientation ofthe frequency. Consequently, information about the frequency in the
x
andy
directions is determined as follows. 4.1 Significant wave heightsRadar images are electromagnetic backscattering from ocean waves; ESA is applied to extract the amplitude of the backscattering from a radar image, hence, the standard deviation of the demodulated amplitude corresponds to the significant wave height. Thus, applying the empirical relation that was obtained from radar images and a buoy.
The figure shows that the values of Hs that are obtained from the radar images and the buoy agree with each other closely. Moreover, the root mean square error (RMSE) was calculated to examine the difference between the Hs values that were obtained by the buoy and the radar. Figure 3 shows the results. According to the figure, THH yields the Hs with an RMSE of 0.34 m and a bias of 0.11.
4.2 Wave direction and wave numbers
The separated frequency obtained by using ESA was used to determine the wave direction and wavenumber. Figure 4 presents the resulting wave direction and wavenumber. The arrow indicates the wave direction, which was obtained from Eq. (11).
Figure 4. Wave direction and wavenumber in square frame in Figure 1. Arrow indicates wave direction and length of arrow is
proportional to wavenumber.
5. CONCLUSIONS
This work proposes a new method for extracting the significant wave heights from radar images. The algorithm considers the non-homogeneity of the coastal waves and provides a nonlinear method for extracting wave data. Experimental results demonstrate that the Teager-Huang transform can successfully extract the significant wave heights with high accuracy and provide the instantaneous direction of a wave at each image pixel.
ACKNOWLEDGEMENTS
All of the experimental data (radar images and buoy data) were provided by the Coastal Ocean Monitoring Center, National Cheng Kung University, Taiwan, R.O.C.
REFERENCES
1. I. R. Young, W. Rosenthal, and F. Ziemer, "A three-dimensional analysis of marine radar images for the determination of ocean wave directionality and surface currents," Journal of Geophysical Research: Oceans, vol. 90, pp. 1049-1059, 1985.
2. J. Seemann, H. Hatten, C. M. Senet, and F. Ziemer, "Estimation of surface wave spectra from nautical radar image sequences with a small azimuthal coverage," in Geoscience and Remote Sensing Symposium, 1999. IGARSS
The International Archives of the Photogrammetry, Remote Sensing and Spatial Information Sciences, Volume XL-7/W3, 2015 36th International Symposium on Remote Sensing of Environment, 11–15 May 2015, Berlin, Germany
This contribution has been peer-reviewed.
'99 Proceedings. IEEE 1999 International, 1999, pp. 1007-1009 vol.2.
3. F. Ziemer and J. Dittmer, "A system to monitor ocean wave fields," in OCEANS '94. 'Oceans Engineering for Today's Technology and Tomorrow's Preservation.' Proceedings, 1994, pp. II/28-II/31 vol.2.
4. D. H. Nomiyama and T. Hirayama, "Evaluation of marine radar as an ocean-wave-field detector through full numerical simulation," Journal of Marine Science and Technology, vol. 8, pp. 88-98, 2003/10/01 2003.
5. N. E. Huang, Z. Shen, S. R. Long, M. C. Wu, H. H. Shih, Q. Zheng, et al., "The Empirical Mode Decomposition and the Hilbert Spectrum for Nonlinear and Non-Stationary Time Series Analysis," Proceedings: Mathematical, Physical and Engineering Sciences, vol. 454, pp. 903-995, 1998. 6. J. F. Kaiser, "On a simple algorithm to calculate the `energy'
of a signal," in Acoustics, Speech, and Signal Processing, 1990. ICASSP-90., 1990 International Conference on, 1990, pp. 381-384 vol.1.
7. J. F. Kaiser, "Some useful properties of Teager's energy operators," in Acoustics, Speech, and Signal Processing, 1993. ICASSP-93., 1993 IEEE International Conference on, 1993, pp. 149-152 vol.3.
8. T.-H. Yu, S. K. Mitra, and J. F. Kaiser, "Novel nonlinear filter for image enhancement," 1991, pp. 303-309.
9. P. Maragos and A. C. Bovik, "Image demodulation using multidimensional energy separation," Journal of the Optical Society of America A, vol. 12, pp. 1867-1876, 1995/09/01 1995.
10. X. Chen, Z. Wu, and N. E. Huang, "The multi-dimensional ensemble empirical mode decomposition method," Advances in Adaptive Data Analysis, vol. 01, pp. 339-372, 2009.
11. E. H. S. Diop, A. O. Boudraa, and F. Salzenstein, "A joint 2D AM–FM estimation based on higher order Teager– Kaiser energy operators," Signal, Image and Video Processing, vol. 5, 2009.
12. J. C. Nieto-Borge, K. Hessner, P. Jarabo-Amores, and D. de la Mata-Moya, "Signal-to-noise ratio analysis to estimate ocean wave heights from X-band marine radar image time series," Radar, Sonar & Navigation, IET, vol. 2, pp. 35-41, 2008.
The International Archives of the Photogrammetry, Remote Sensing and Spatial Information Sciences, Volume XL-7/W3, 2015 36th International Symposium on Remote Sensing of Environment, 11–15 May 2015, Berlin, Germany
This contribution has been peer-reviewed.