MULTI-SOURCE 3D MODELS SUPPORTING ULTRASONIC TEST TO INVESTIGATE
AN EGYPTIAN SCULPTURE OF THE ARCHAEOLOGICAL MUSEUM IN BOLOGNA.
V. Di Pietra a , E. Donadiob, D. Picchic , L. Sambuellid, A. Spanòb*
a Dept. of Environment, Land and Infrastructure Engineering (DIATI), Politecnico di Torino, Corso Duca degli Abruzzi 24, 10129 Torino (Italy) - [email protected]
b Geomatics for Cultural Heritage Laboratory - Politecnico di Torino, Viale Mattioli 39, 10125 Torino (Italy) - [email protected], [email protected]
c Civic Archaeological Museum, Via dell’Archiginnasio 2, 40124 Bologna (Italy) - [email protected] d Engel (Environmental-Engineering Geophysics Laboratory) - Politecnico di Torino, Corso Duca degli Abruzzi 24, 10129 Torino
(Italy) - [email protected]
Commission II
KEY WORDS: 3D modelling, point clouds, Structure from Motion (SfM), hand-held 3D scanner, 3D Ultrasonic Tomographic
Imaging, data representation, Cultural Heritage, Egyptian statue.
ABSTRACT:
The paper presents the workflow and the results of an ultrasonic 3D investigation and a 3D survey application aimed at the assessment of the internal integrity of an ancient sculpture. The work aimed at highlighting the ability of methods devoted to the 3D geometry acquisition of small objects when applied to diagnosis performed by geophysical investigation. In particular, two methods widely applied for small objects modelling are considered and compared, the digital Photogrammetry with the Structure from Motion (SFM) technique and hand-held 3D scanners. The study concludes with the aim to enhance the final graphical representation of the tomographic results and to subject the obtained results to a quantitative analysis.
The survey is applied to the Egyptian naophorous statue of Amenmes and Reshpu, which dates to the reign of Ramses II (1279-1213 BC) or later and is now preserved in the Civic Archaeological Museum in Bologna. In order to evaluate the internal persistency of fractures and visible damages, a 3D Ultrasonic Tomographic Imaging (UTI) test has been performed and a multi-sensor survey (image and range based) was conducted, in order to evaluate the locations of the source and receiver points as accurate as possible The presented test allowed to evaluate the material characteristics, its porosity and degradation state, which particularly affect the lower part of the statue. More in general, the project demonstrated how solution coming from the field of 3D modelling of Cultural Heritage allow the application of 3D ultrasonic tomography also on objects with complex shapes, in addition to the improved representation of the obtained results.
1. INTRODUCTION
By now, Geomatic methods have gained great importance in many Cultural Heritage (CH) different purposes: documentation, diagnosis, restoration, conservation, communication and fruition. 1
Scientists are aware that over the past two decades, laser scanning and digital photogrammetry have emerged as important additions providing relevant potential for promoting a revolution in the documentation and the recording of CH items and in its subsequent dissemination. (Campana, 2014). The development and refinement of 3D survey techniques, as well as their integration, involved until now the field of small objects, artistic and archaeological heritage as well as many other types of cultural assets, sites and landscapes. (Kersten, Lindstaedt 2014; Lerma et al., 2011)
Today many different techniques are available and able to meet the needs of a variety of application.
As part of the extensive literature, it is possible to identify few trends that seem significant. A first trend aims to respond to the requests of the institutions that deal with conservation such as the museums and to arrange the massive digitization of objects by means of the developed technologies. An example currently much observed is the cultlab3D system (Santos et al., 2014).
* Corresponding author
The other interesting trend is the crowdsourcing approach: some enhanced applications study the chance to derive digital documentation for preservation using images available in the web. In this domain, the high performance of the SFM systems allow to search the highest sets of tie-point and to generate very complex point clouds. The study strategies are different, starting from methods that optimise research and decrease outliers (Kyriakaki et al., 2014), to systems that retrieve the position of the shots from location-based systems. (Verstockt et al, 2015). Our work is not placed in any of these areas of study, but rather in those cutting edge investigations of researcher topics, in our case Geophysics and Geomatics.
The interest of these tests lies in the fact that CH increasingly require interdisciplinary studies and the possibility of dialogue and comparison among such information is surely interesting and essential. In particular, in this project, we demonstrate how Geomatic methods can play a key role in the knowledge phase, in particular in an Ultrasonic Tomographic test, providing 3D detailed measurable models and representing the results in a communicative way.
In order to evaluate the damages of an Egyptian sculpture, their severity, and, in particular, their persistency inside the statue, in a very accurate way, a 3D multi-sensor survey and a 3D ultrasonic tomography have been performed.
2. METHODS
2.1 Geomatic techniques for small assets 3D modelling
In the field of ancient Cultural Heritage, 3D accurate models of archaeological objects and sculptures have a significant role for their documentation, maintenance and restoration.
The digitization of such heritage ensures the store of the information about the shape and appearance of an object against its possible lost and damage over time by natural or accidental causes. The collected data allow also the dissemination of digital media collections for a large audience via virtual museums and enable the creation of replicas via 3D prints. By now, a variety of methods is available for the 3D digitization of Cultural Heritage, covering diverse range of distances and diverse object dimensions.
The employed sensors are generally distinguished in active and passive ones, basing on the emission of an electromagnetic signal. Passive sensors, which are used in photogrammetric applications, use the ambient light to make measurements, recording the electromagnetic energy, i.e. visible light, emitted by the objects. In recent years, the increase in performance of digital cameras and the development in calibration technology, featured by very competitive costs, meant that close-range photogrammetry is widely used to recover 3D models of objects with high accuracy. (Samaan, et al. 2013)
Active sensors instead, used in laser scanner (TOF) and range cameras (based on the triangulation principle), measure the objects emitting signals (laser beams, infrared lights, etc.) and recording the reflected answers (Adami et al., 2015).
In the very close range field, still among CH requirements, system such as the Time of Flight (ToF) cameras and structured light 3D scanners allow to acquire with accuracies not lower than one or few millimetres. In the fields of very high accuracy metrology systems (±25÷30μm), new developed scanning system, such as arm scanners, combine arms together with high definition hand-held scanners. Such systems, even though they are still expensive, are very useful in rapid prototyping and reverse engineering fields.
To identify the most appropriate technology for 3D digitalization, several aspects must be considered:
- characteristics of the object (shape, dimension, colour, reflectivity and homogeneity of the material, etc.),
- the acquisition place (internally or externally, with natural or artificial light, with the possibility to move the object or not),
- the aim of the survey (documentation, analysis, dissemination, virtual reality applications, real time applications),
- time and budget constraints.
In this application, the statue was in a laboratory, with a bad light condition so we decided to use artificial properly oriented lights. The data acquisition consisted in a photogrammetric survey and in two type of laser scanner: a laser Faro Focus 3D and the hybrid hand-held Freestyle scanner, in order to carry out some considerations concerning the quality of the acquired data in relation also to the Ultrasonic Tomographic analysis needs.
2.2 3D Ultrasonic Tomographic Imaging (UTI)
Geophysical methods have increasing applications in Cultural Heritage search and monitoring phase.
High-resolution geophysics and micro geophysics techniques may contribute to facilitate the restoration of artworks or historical building elements. With respect to the management of a museum, micro geophysics techniques can contribute to evaluating the possibility and the precautions that must be taken
when moving artefacts either for a museum reorganization or for temporarily lending a masterpiece to an exhibition. (Piro et al. 2015).
The 3D Ultrasonic Tomographic Imaging (UTI) method presented in the next paragraphs consists of estimating the variations of the apparent velocity of an ultrasonic (US) pulse within the volume of interest (VOI) (e.g. Sambuelli et al., 2015). According to the theory of elasticity, in fact, the velocity of propagation of a mechanical pulse in a given material decrease, for example, with the increasing of the number of fracture in unit of volume. The velocity is estimated dividing the Euclidean distance d between a transmitter probe TX and a receiver probe Rx by the shortest time t (time break TB) that an US impulse need to travel from TX to RX. This velocity is called apparent because the US pulse may not really travel through the low velocity volume then it may not really scan the low velocity volume (Wieland, 1987). Rather, according to the Fermat principle, it travels around a low velocity volume or a fracture. This path, which is unknown, is longer than the one obtained connecting with a straight-line TX and RX (the Euclidean distance d) which is the only path we can assume. Given the velocity of the material, a longer path takes a longer time so that dividing the straight path by a longer time we get a lower velocity. This lower velocity is the sign that between TX and RX there is an inhomogeneity. If we locate many TX and RX in such a way to cross from many directions the VOI we can locate within the VOI inhomogeneous sub-volumes. These latter’s can be due to the presence of weaker volume of rock, mortar or a more densely fractured medium.
3. THE EXPERIENCE ON THE NAOPHOROUS STATUE OF AMENMES AND RESHPU, BOLOGNA,
CIVIC ARCHAEOLOGICAL MUSEUM, (EG 1821)
3.1 The statue and the damage diagnosis requirements
Over the years new and deeper cracks, material loss, chromatic dissimilarities, and salt efflorescence have increased across the entire surface, in particular in the lower part of the statue, making an urgent restoration project necessary.
In order to interrupt the increasingly rapid and progressive deterioration, to clean and consolidate the limestone, the Civic Archaeological Museum has sought the cooperation of prestigious Italian institutions and a restorer expert in stone conservation.2 For the first time the naophorous of Amenmes and Reshpu underwent a multidisciplinary investigation with the aim of characterizing the original lithotype and pictorial layer, the materials used in the previous restorations as well as evaluating the persistence of fractures inside the body of the statue.
On the basis of the information gleaned, it was decided to restore the sculpture by removing the materials used in previous restorations as much as possible. They were replaced by consolidating materials with mechanical and chemical characteristics like those of the original lithotype that do not interact with the salts present in it, among the main causes of this deterioration. It was therefore possible to exhibit this important statue once again to the public, after being held in the museum warehouse since 1994. Its inherent fragility remains, but now the origins are well known and under control in the Egyptian Section of the museum.
3.2 The integrated technique 3D survey
The survey phase consisted in the photogrammetric and laser acquisition with the aim to generate a 3D model on which make a variety of measures. The processed 3D model allowed to evaluate the locations of the source and receiver points of the Ultrasonic Tomographic test, their coordinates in a fixed reference system and their mutual distance.
Before any acquisition, 8 checkerboard targets have been placed on the base of the statue, to be used for registering all the data in a unique reference system, and 71 white numbered stickers have been arranged on the statue, to form a 3D network of max 150X150X150 mm3/voxler, as a 3D mesh for ultrasonic tomography (Figure 1). The data have been scaled using the measured distance between checkerboard.
3.2.1 The photogrammetric 3D model
The photogrammetric survey consisted in the acquisition of 74 images, captured at three different heights all around the object with a Nikon D800E (7360x4912 sensor, Zeiss optic system and 50 mm focal length). The acquired images have been processed by means of the Structure from Motion (SfM) technique and image matching algorithms, thus generating a dense point cloud constituted by 7.055.693 points. The high quality of the process was secured by the re-projection error limited to 1.2 pixel. After these steps, a reference system has been assigned to the point cloud, scaling also the model according to measures between targets placed on the crankcase, obtained by the terrestrial fixed scanning, specially used to speed up the operations of measurement. Subsequently a textured 3D model has been processed, ensuring an average accuracy on the final model of less than 5 mm (accuracy evaluated measuring some control points on the mesh and on the original point cloud) (Figure 2).
2 Engel (Environmental-Engineering Geophysics Laboratory) and Geomatics Laboratory of Politecnico in Turin, Opificio delle Pietre Dure (OPD) in Florence, IUAV University in Venice and the restorer Cristina del Gallo.
Figure 1. Front of the statue and details of the points of application of US probes (28 and 29 in the lower portion of the crankcase and 19, 20, 22 and 23 in the upper portion).
Figure 2. Photogrammetric point cloud and textured mesh.
3.2.2. The 3D model generation by the hand-held 3D laser scanner.
The second step of the survey test applied to the statue employed a handheld 3D laser scanning (the FARO Scanner Freestyle3D: http://www.faro.com/products/3d-documentation/faro-scanner-freestyle-3d/overview). Such instrument offers fast data acquisition and real-time visualisation; it uses a structured light technology consisting in two infrared cameras that create a “stereo pair” of images looking at the structured light pattern. A laser sensor ensures the measurement of the surveyed surface with a range of acquisition of 0.5-3 m, (3D point accuracy 1.5 mm) and an RGB camera acquires the radiometric data. Its relatively low cost makes such technique suitable and reliable for small objects modelling and addressable for many different uses.
The acquisition phase consisted in five scans collected at a distance from the object of 0.5 m, providing a resolution of 0.2 mm and with a predicted noise of 0.7 m. Certainly, the ambient light is a determining factor for the accuracy of the clouds, and, in fact, the registration process based on the automatic target recognition ended with an average residual of 2-3 mm, which is insufficient for the intended purposes.
Figure 3. Laser Freestyle point cloud and textured mesh.
3.2.3 Comparing the processed models
One of the aim of the work was the evaluation of the accuracy of both the surveys, mostly regarding the possibility for the freestyle laser point cloud to provide a sufficient level of detail for the Ultrasonic Tomographic needs. As reported in table 1 the laser Freestyle cloud is constituted by a highest number of points than the photogrammetric one.
Number of points Photogrammetric cloud 7.055.693
Laser Freestyle cloud 13.036.747
Table 1. Comparison between densities of different clouds.
The roughness of both the point cloud has been computed in Cloud Compare, which estimates the distance between each point and the best fitting surface computed on its nearest neighbours. As shown in figure 4-5, the photogrammetric cloud has minimal noise with a mean value of 0.000269 m, while the freestyle cloud presents a higher noise, with a mean value of 0.000552 m (to make such estimation a radius of a sphere centred on each point of 0.005 m has been considered).
Figure 4. Roughness computed on the laser cloud presenting a considerable percentage of points affected by noise (2.5-3 mm)
Figure 5. Insignificant level of roughness computed on the photogrammetric cloud. (less than 0.5 mm almost throughout the cloud)
Once aligned, several section profiles have been also extracted from both the cloud (Figure 6). Measuring samples of residuals among the photogrammetric cloud, assumed as the reference cloud, and the freestyle one, we have been able to estimate that the second one has discards of 1-2 mm due to alignment operation and its roughness.
A
B
meshed surfaces (photogrammetric on the left, scanner surface on the right).
Figure 7. Comparison between clouds: about 60% of the freestyle point clouds are at a distance of less than 2 mm from the reference cloud.
3.3. UTI data acquisition and processing
The 3D UTI on Amenmes was restricted to the lower part of the statue being this latter the volume giving major concern about its mechanical properties. Around the lower part of the statue 71 points have been materialized with sticky circular stamps (diameter 15 mm) on which the central point and a progressive number were marked (Figure 8).
Figure 8. Some circular sticky stamps used to materialize TX and RX points.
The point positions were selected so that, on average, the straight rays connecting each couple of points would have crossed the VOI with a dense 3D net and would have not left volumes greater than 15x15x15 cm not scanned (see Figure 12).
3.3.1 Instrumentation – equipment
To acquire, store and process the geophysical data the following instruments and software’s were used. A PUNDIT pulse generator with exponential US probes with a nominal frequency of 50 kHz; a 7 dB fixed gain amplifier, a variable gain (1, 3, 10 dB) amplifier; a Le Croy Wave Jet 20 MHz digital oscilloscope; Matlab proprietary scripts for time reading, straight rays tracing and velocity interpolation; the software GeoTomCG by GeoTom LLC for 3D UTI and the software Voxler by Golden Software for 3D rendering of the velocity volumes.
3.3.2 Data acquisition and processing
Across the VOI 226 measurements of TB were made according to the scheme in Figure F. Before the measurements, the time delay introduced by the exponential probes was measured and it was 20.7 μs. This time was subtracted from each TB. In figure 9, an example of the graph on which the TB’s were read is shown.
Figure 9. Top: raw US signal; Middle: zoomed US signal to read the TB; Bottom: Triggering signal from which the time-zero (the time the US pulse entered the rock) was read.
The spatial resolution, i.e. the smaller detectable anomalous volume, of a 3D UTI is roughly related to the dominant wavelength of the US pulse. An estimate of can be obtained dividing, for example, the average velocity of US pulse in the medium by the dominant frequency of the US pulse itself. To evaluate an order of magnitude of the achievable spatial resolution in the 3D UTI, the power spectral density (PSD) of some long-path and short-path signals have been evaluated. In Figure 10 the PSD of a signal is shown.
Figure 10. PSD of a transmitted US pulse.
3.3.3 Results
Considering an uncertainty on d equal to 5 mm and on t equal to 15 μs, an uncertainty of 60 m/s can be supposed on apparent velocities. An elementary statistical analysis on the apparent velocities gives: minimum velocity 300 m/s (this value is not realistic and it’s likely due to a missing FB); maximum velocity 2800 m/s; mean velocity 1330 60 m/s; velocity standard deviation 630 m/s. From the velocity values and the PSD frequency band a dominant wavelength of 5 cm could be safely assumed. In Figure 11 a histogram of the apparent velocities is shown.
The histogram clearly shows that many apparent velocities are around and even below 1000 m/s; that is a quite low velocity range for a limestone. In Figure 12 a plot of d versus TB is shown.
Figure 11. Histogram of the apparent velocities
Figure 12. Distance d versus Time TB plot.
The slope of each straight line on the graph in Figure E is an apparent velocity. The two continuous lines represents two velocities. The points relative to a sound limestone should lie around or above the line at 2500 m/s. This graph shows that within the VOI a few rays have an apparent velocity compatible with a sound limestone.
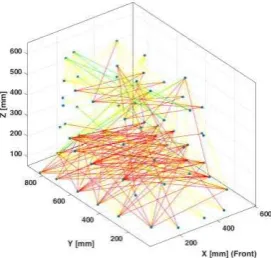
In Figure 13 a 3D view of the straight ray paths used in the 3D UTI is shown. Each ray path is drawn with a colour related to its apparent velocity. Even in this representation, before the 3D UTI processing, it is easy to guess that the lower part of the statue has worse mechanical properties than the higher part.
Figure 13. The Euclidean straight paths used in 3D UTI processing. Ray colour codes refer to apparent velocities: red v<1300 m/s; yellow 1300<v<2500 m/s; green v>2500 m/s.
3.3.4 3D UTI
UTI analysis has been performed with the software GeoTomCG which allows the tomographic processing of seismic data in a volume with sources and receivers located anywhere on a 3D Cartesian grid. GeoTomCG uses a SIRT (Simultaneous Iterative Reconstruction Tomography) algorithm to produce, from the position (x, y, z) of transmitters and receivers and from the TB’s, a velocity distribution in the VOI (Trampert and Leveque, 1990). The volume is firstly discretized in prismatic cells then an iterative procedure is used to calculate the velocity of the US pulse within each cell. The VOI of Amenmes was discretized in 5x8x6 prismatic cells with size: dx=114 mm, dy=108 mm, dz=101 mm. Then, on average, the cell size was about two times the dominant wavelength of the US pulse along each direction.
From the final model, only the cells crossed by more than 3 rays have been considered and a 3D rendering of the resulting velocity distribution has been plotted (Figure 14).
In Figure 14 the brown surface is the iso-surface at 1500 m/s. The sub volume below this surface, that is just over the pedestal, is made by a limestone in which US pulse propagation velocity is lower than 1500 m/s then it is likely quite intensively altered.
4. IMPROVING GRAPHICAL REPRESENTATION
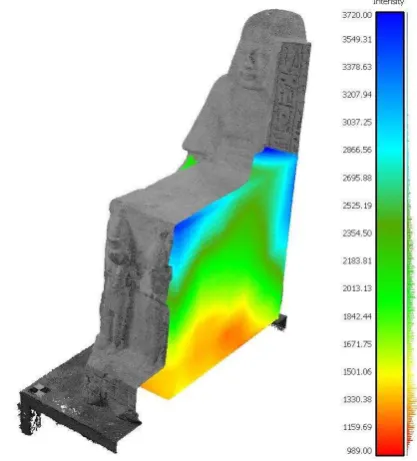
From the 3D UTI analysis is possible to extract a standard file format typically used in computational fluid dynamics (CFD), the PLOT3D file. It is a standard format that usually includes two different files, the grid file and the solution file. The first contains the coordinate of the solution grid, while the second contains information typical of a CFD solution, in our case the correspondent velocities. With the aim to improve the visualization of the results of the 3D UTI analysis and to make volumetric measurements on the statue, the PLOT3D file format has been converted in a standard format usable in a 3D point cloud processing software. In particular, an easy function, developed in MATLAB was used to transform the structure of the grid file in a .xyz file, where the coordinate of the grid could be visualized as a sparse point cloud and the velocity value as a scale bar. The VOI of Amenmes extracted from GeoTomCG software was discretize in 30x45x35 prismatic cells with size of 20 mm. The correspondent point cloud extracted with Matlab was too sparse so it was oversampled with the use of the Point Cloud Librerary (PCL), an open project (Rusu, Cousins, 2011), integrated as plugin in the open source software CloudCompare. The tool ‘Smoothing MLS’ allows to interpolate the point cloud with the moving last square method so that the initial cloud can move from 47.250 to 37.469.250 points. At the end of the process it has been obtained a 3D representation of the velocity distribution in the VOI of Amenmes statue. The graphical representation was like the one already used in the UTI analysis with: red colour v<1500 m/s, yellow 1501<v<2000 m/s, green 2001<v<2500 m/s, dark green 2501<v<3000 m/s, and blue v>3001 m/s. The VOI represented with this scale bar, was combined with the statue points cloud and this has made possible the representation of different section level to better understand the region affected by anomalies. (Figure 15)
Figure 45. Improved representation of average velocities in the VOI of the Ramessid statue.
The iso-surface was created, extrapolating the points of the cloud belonging to the separation surface between the velocity defined before, and generating the corresponding mesh. Once defined the iso-surfaces and the points cloud between two steps level, was possible to compute the volume of statue for each average velocity and so the volume characterized by the worse
mechanical proprieties. The volumes were defined from a meshed closed shell generated with the portion of points cloud included between two iso-surfaces and was measured with the tool Measure/Volume of the software 3DReshaper (Figure 16).
Figure 16. The closed meshes extracted from the classified point cloud.
The volumes are reported in the following table:
Average velocities [m/s]
Interested volumes
[m3]
Percentage compared to
investigated volume[%]
v < 1500 0,077 m3 38.31 %
1500 < v < 2000 0,053 m3 26.37 %
2000 < v < 2500 0,039 m3 19.40 %
2500 < v < 3000 0,025 m3 12.44 %
V > 3000 0,007 m3 3.48 %
Table 2. The volumes of the statue for each range of velocity.
5. CONCLUSION
measured average velocity is lower than 1500 m/s, due to damages and fractures.
Another significant result is the fact that also the freestyle 3D scanner can be considered appropriate for this kind of tests. The versatility of the photogrammetric survey after the development of the SFM technique is more than established, although it must be considered that to obtain high accuracies, such those achieved by the statue of Amenmes and Reshpu, high-quality cameras and optics must be available and a high level of expertise in the modelling phase is necessary.
About this, Hindmarch offers a very thorough research on the digitization of CH small assets, with a point of view centred on institutions requirements such as museums (Hindmarch 2015). Comparing to the most popular and tested hand-held Kinect scanner, the Faro Freestyle present advantages that may make it attractive in cultural heritage documentation. Being portable (i.e., it can capture objects in situ), it provides full colour point clouds, it is easy to use and versatile, since it can reach the extension of small rooms survey; finally, it is cheaper than many other systems.
Finally, the experience proved the ability to handle the results of the geophysical technique again in a platform environment that provides the measurement of surfaces, volumes, points. Despite the possibility of improving the graphic representation of the UTI results has been demonstrated, we met many difficulties in interoperability of digital data formats. For this reason, many operations and transformations of formats were made with laborious manual processes. In this direction, some improvements should be provided.
ACKNOWLEDGEMENTS
The authors would like to especially thank Diego Franco (ENGEL) involved in the UTI data acquisition and Paolo Maschio providing his high expertise in the photogrammetric collection phase. Then we are grateful to the Intesa San Paolo Annals of the Photogrammetry, Remote Sensing and Spatial Information Sciences, 2 (5), pp. 9-15.
Campana, S, 2014. 3D Recording and Modelling in Archaeology and Cultural Heritage. Theory and best practices: Archaelogical needs. eds Remondino F, Campana S., Oxford UK, Archaeopress, 7.
Hindmarch J, 2015. Investigating the use of 3D digitisation for public facing applications in cultural heritage institutions, UCL doctoral thesis, London.
Kminek-Szedlo G., 1895. Museo Civico di Bologna. Catalogo di Antichità Egizie, Turin, no. 1821.
Kyriakaki, G., Doulamis A., Doulamis N., Ioannides M., Makantasis K., Protopapadakis E., Hadjiprocopis A., Wenzel K., Fritsch D., Klein M., Weinlinger G., 2014. 4D Reconstruction of Tangible Cultural Heritage Objects from
Web-Retrieved mages, International Journal of Heritage in the Digital Era, 3(2), pp. 431-452. Italian geophysicists, First Break, 33(8), pp. 43–54.
Rusu, R.B., Cousins S., 2011. 3D is here: Point cloud library (pcl). In: Robotics and Automation (ICRA), 2011 IEEE International Conference on. IEEE, pp. 1-4.
Samaan M
.
, Héno R.
, Pierrot-Deseilligny M.,
2013. Close-range photogrammetric tools for small 3d archaeological objects. In: International Archives of the Photogrammetry, Remote Sensing and Spatial Information Sciences, Volume XL-5/W2, pp. 549-553.Sambuelli, L., Bohm, G., Capizzi, P., Cardarelli, E., Cosentino, P., 2011. Comparison between GPR measurements and ultrasonic tomography with different inversion algorithms: an application to the base of an ancient Egyptian sculpture. Journal of Geophysics and Engineering, 8(3), pp.106-116. doi:10.1088/1742-2132/8/3/S10
Sambuelli, L., Böhm, G., Colombero, C., Filipello, A., 2015. Photogrammetry and 3-D Ultrasonic Tomography to Estimate the Integrity of Two Sculptures of the Egyptian Museum of Turin. In: Near Surface Geoscience 2015 - 21st European Meeting of Environmental and Engineering Geophysics, Non-destructive Tests and Prospections for Cultural Heritage. doi: 10.3997/2214-4609.201413675
Santos P., Ritz M., Tausch R., Schmedt H., Monroy R., De Stefano A., Posniak O., Fuhrmann C., Fellner D. W., 2014. CultLab3D: on the verge of 3D mass digitization, GCH '14 Proceedings of the Eurographics Workshop on Graphics and Cultural Heritage, pp. 65-73, doi: 10.2312/gch.20141305
Trampert, J., Leveque, J., 1990. Simultaneous iterative reconstruction technique: physical interpretation based on the generalized least square solution. Journal of Geophysical Research, 95, pp. 12553–12559.
Verstockt, S., Gerke M., Kerle N., 2015. Geolocalization of Crowdsourced Images for 3-D Modeling of City Points of Interest." IEEE Geoscience and Remote Sensing Letters, Vol.XII,1670-1674. Accessed August 2015. Doi 10.1109/LGRS.2015.2418816.