STEREOVISION MOBILE MAPPING:
SYSTEM DESIGN AND PERFORMANCE EVALUATION
J. Burkhard, S. Cavegn, A. Barmettler, S. Nebiker
Institute of Geomatics Engineering, FHNW University of Applied Sciences and Arts Northwestern Switzerland, Muttenz, Switzerland – (joel.burkhard, stefan.cavegn, andreas.barmettler, stephan.nebiker)@fhnw.ch
Commission V, ICWG V/I
KEY WORDS: Mobile, Mapping, Stereoscopic, Multisensor, Georeferencing, Radiometric, Calibration, Matching
ABSTRACT:
In this paper we introduce a state-of-the-art stereovision mobile mapping system with different stereo imaging sensors and present a series of performance tests carried out with this system. The aim of these empirical tests was to investigate different performance aspects under real-world conditions. The investigations were carried out with different cameras and camera configurations in order to determine their potential and limitations for selected application scenarios. In brief the test set consists of investigations in geometric accuracy, in radiometric image quality and in the extraction of 3d point clouds using dense matching algorithms. The first tests resulted in an absolute overall 3d accuracy of 4-5 cm depending mainly on the quality of the navigation system used for direct georeferencing. The relative point measurement accuracy was approx. 2 cm and 1 cm for the 2 megapixel and the 11 megapixel sensors respectively. In the second series of investigations we present results obtained by applying tone mapping algorithms often used for high dynamic range images (HDR). In our third series of tests refinements of the radiometric calibration of the stereo system and corrections of the vignetting resulted in an improved completeness of the depth map on the roadside environment. We conclude the paper with investigations in obtaining complete and accurate depth maps for a robust and accurate 3d monoplotting support in vision-based mobile mapping web services. For this we present first results obtained by interpolating incomplete areas in the disparity maps and by fusing the disparity maps with additional LiDAR data.
1. INTRODUCTION
The majority of today's mobile mapping systems are either focusing on acquiring 3d point clouds by means of mobile laser scanners or georeferenced panoramic imagery. Especially the mobile LiDAR technique has become quite popular in the last few years, since it provides high geometric accuracy and is applicable in a wide range of engineering projects. Most of the LiDAR-based mobile mapping systems can be combined with additional image data in order to support the user's interpretation of objects in point clouds. However, there is still a drawback in terms of interpretation, navigation and general handling of point cloud data. Focusing on images, some of these drawbacks can be avoided. The interpretation and recognition of objects in images is much more intuitive for most casual users and non-geospatial experts, such as town planners or policy makers, thus images are demanded by customers. Different panoramic image services attend to this, but it is difficult to provide a surveying technique based upon the panoramic approach with reasonable geometric accuracy. However, there are a number of well-established and highly-efficient surveying techniques such as airborne and close range multiray and stereo photogrammetry, which could be adapted to and exploited in land-based mobile mapping. First experiments with stereovision based mobile mapping date back some 20 years, such as the GPSVanTM (Novak, 1991) or the VISAT-System (Schwarz et al., 1993). Recent progresses in positioning and imaging sensors, onboard data storage, algorithms and computing technologies such as High-Performance Computing have been enabling very powerful stereovision mobile mapping approaches. They don't just give the possibility to increase the efficiency in 3d geodata acquisition; they also support new
ways of managing and exploiting road infrastructure data. These include the intuitive and accurate 3d mapping of geo-objects, the automatic generation of disparity maps and 3d point clouds using dense matching, the interaction of georeferenced imagery with a GIS or the augmentation of the georeferenced imagery with geospatial contents.
2. SYSTEM DESIGN AND CALIBRATION
2.1 A multi-stereo-camera mobile mapping system
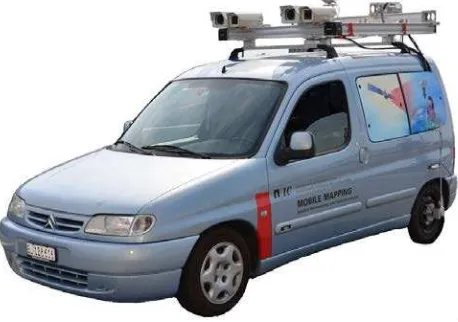
The mobile mapping system used for the performance evaluation has been developed since 2009. While at the beginning the system was designed for the automated extraction and mapping of road signs with just one stereo system, it is nowadays used in a wide range of research and development projects as a multi-stereo-camera system (see Figure 1).
The system consists of the navigation system Applanix POS LV 210 in order to directly georeference four digital industrial cameras. The POS LV 210 has a specified accuracy of 2-5 cm in position and 0.02-0.05 deg in attitude while running without GNSS-outage and post processing. The system integrates a tactical-grade IMU that lowers the accuracy in position down to 30 cm after one minute of GNSS-outage.
In addition the system is made up of two different stereo camera systems with geometric resolutions of two and eleven megapixels respectively. For both systems GigE cameras with CCD sensors, global shutters, 12bit radiometric resolution and a pixel size larger than 7µm are used. Both camera types are equipped with wide-angle lenses with a field of view of more International Archives of the Photogrammetry, Remote Sensing and Spatial Information Sciences, Volume XXXIX-B5, 2012
than 70 degrees in order to get ideal geometric measuring conditions in the close range of the car. Further, the system includes a Sick LMS profile laser scanner that can capture about 13'000 point measurements per second. It is mainly used for the completion of disparity maps (see chapter 5.3).
Figure 1. System overview with experimental camera setup
Depending on the mapping mission the camera sensors are operated with 5 to 30 frames per second. The sensors are mounted on a rigid platform, ensuring that the relative orientation between them remains constant during the mission. The stereo systems can be mounted quite flexible pointing different directions and with variable stereo bases up to 1.5 m. In figure 1, both stereo systems are pointing in the same direction as this configuration was used for the performance evaluation described later on in chapters 3 and 4. One system usually points to the front, whereas the other system points either backwards or sideways depending on the application. For the processing of stereoscopic images later on, it is important that the cameras are triggered synchronously with high precision.
2.2 Overall system calibration method
For the system presented, three different types of datasets need to be calibrated. First, the interior orientation of each single camera, second the relative orientation of each stereo-system and final the bore sight alignment, which is the relative orientation between a stereo-system and the reference frame of the navigation system. There are several methods to do this, such as direct measurements or estimating the parameters in a bundle adjustment (Ellum & El-Sheimy, 2002).
We propose to calibrate all the parameters with a single calibration field that is composed of well distributed signalized control and check points fixed on a façade and an exterior stair. The calibration procedure starts with multiple recordings of particular stereo image pairs from the calibration field with different points of view. Afterwards control, check and tie-points are measured and entered into a bundle adjustment, which results deliver directly the interior and relative orientation parameters needed. The bore sight parameters can then be computed by subtracting the exterior orientations computed by the bundle adjustment from those exterior orientation parameters measured by the navigation system. Table 1 shows the results of such a calibration procedure, where the standard deviations refer to averaged parameter sets computed with 4 stereo pairs.
Camera
Please note that these results do not belong to an accuracy evaluation of the calibration procedure. But they will give a good impression of what is achievable with a calibration method which is both practical and economical. On the first sight the determination of the relative orientations in table 1 looks accurate. However, for high quality relative measurements in a single stereo frame the accuracy of the basis (x-axis) is crucial because it directly affects the accuracy of the depth between measurements and camera system. The achieved standard deviations of 1.5 mm and 3.3 mm respectively can cause variances from 6 cm to 13 cm at a distance of 20 m from the system! This can also be seen in the empirical accuracy evaluation in chapter 3.3.
The accuracies of the bore-sight parameters are much lower, which is not surprising as they are mainly affected by the accuracy of the navigation system, which delivers best results in sections with good GNSS-coverage, high velocity and not many curves. These conditions can't be kept sufficiently in front of the calibration field, thus it should be considered to separate the bore sight calibration from the rest for future developments. Nevertheless, our investigations showed that due to the rigid mounting of the sensors, the once calibrated parameters can be fixed for multiple missions. However, after an adjustment of the aperture or the focus of the lenses or after extreme variations in temperature, the system needs to be recalibrated.
3. GEOMETRIC ACCURACY EVALUATION
Geometric accuracy investigations were carried out to determine and compare absolute and relative geometric accuracies of each stereo system. The main objective was to evaluate the accuracy of a single 3d point measurement under real world circumstances and based on the system and calibration described above.
3.1 Test setting
For the test, we used about 300 check points distributed in a suburban area in Muttenz, Switzerland. Most of them were placed in groups on road signs, manhole covers, crosswalks and road markings (see Figure 2). They can be considered as well signalized, thus the uncertainty in definition should not much influence the accuracy results. The check points were independently surveyed by GNSS in combination with a total station. The accuracy of the reference data is in the order of 1 cm in position and 2 cm in height.
The mission to record the images for the check point measurements took place on the 12th
of July 2011 in sunny and warm weather conditions. It led through a typical suburban area with medium quality GNSS conditions and without total GNSS outages. Further, the mission took about 40 minutes in time including five minutes for initialization at the beginning and at the end. Afterwards, the trajectory was processed in tightly coupled mode with the Applanix PosPac software package. In International Archives of the Photogrammetry, Remote Sensing and Spatial Information Sciences, Volume XXXIX-B5, 2012
the region of the check points an interior trajectory accuracy of around 4 cm in position and 0.05 deg in attitude was observed.
Figure 2. Distribution of check points
For the accuracy evaluation described in this chapter an experimental stereo configuration was chosen in order to have the same conditions for both camera types. For this purpose both stereo systems were pointing to the front and displaced in a way that both of them would have had the same stereo basis of 75 cm (see figure 3). With this configuration the cameras were exposed with a common frequency of 5 images per second.
Figure 3. Camera configuration used for the test
It also has to be mentioned that the calibration procedure, described in chapter 2 was based upon the same mission and trajectory as it was used for the check point measurements. The calibration field was located close to the check points, thus a possible drift in the calibration parameters could be neglected.
3.2 Measuring methods
For the determination of the 3d coordinates of the check points several image measuring methods were used and compared. First the classical photogrammetric stereoscopic measuring method was applied, secondly a semi-automatic method based on least-squares matching, and finally a 3d monoplotting method combining monoscopic measurements with a previously computed disparity map. All of these methods require normalized stereoscopic image pairs in advance as a basis for applying either further image processing or manual image measurements. These so called normal or epipolar images were processed in advance (Schenk, 1999).
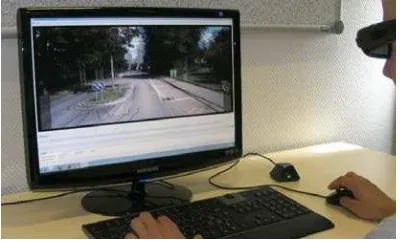
For the stereoscopic measuring method the normal images were directly used and displayed using a stereovision client software developed as a part of our research project SmartMobile-Mapping (see Figure 4). Two relatively inexperienced operators measured independently of each other about 158 check points. Most of them were measured in multiple stereo pairs within the image sequence. In average each point was measured in three different stereo pairs, in order to evaluate the distance dependency of the accuracy results (see chapter 3.3). For the second method the operators just had to measure the points in single images, whereby subsequently the algorithm searched for the corresponding point in all neighboring images where the point was also seen. The multi-image matching algorithm is based on cross correlation and least-squares matching (Huber et al., 2011).
Figure 4. Stereoscopic workstation
The last 3d monoplotting method is based on dense disparity maps which had to be derived from normal images in advance (see chapter 5 for further details on the processing of disparity maps). For the 3d monoplotting measurements 16 different locations or stereo-image pairs respectively were chosen and disparity maps were computed based on them. About 37 check points where then manually measured in single images, where the corresponding depth was looked up in the disparity map to compute the 3d coordinates (see Figure 5).
Figure 5. 3d monoplotting principle
3.3 Results
There were several aspects carried out of the resulted raw measurement data, such as distance dependency, absolute and relative 3d point measuring accuracy.
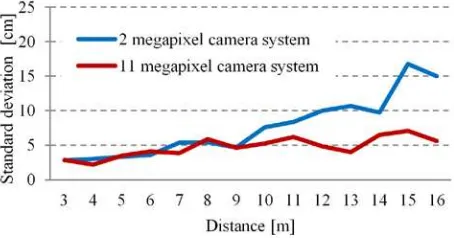
3.3.1 Distance dependency: It was of interest to evaluate that the accuracy of a single point measurement is dependent on its measuring distance. Theoretically the accuracy should increase exponentially with distance because it is basically influenced by the accuracy of the basis between the two cameras. In the given test setting there were about 40 single point measurements available for each metered interval between 3 m and 16 m. For these a standard deviation for a single absolute 3d point measurement was computed, which is shown in figure 6 (Arnold, 2011). It can be seen that the accuracy increases with distance especially for the 2 megapixel camera system. This might not just happened because of a reduced image measuring accuracy, but also on a less well calibrated basis (see chapter 2.2).
Figure 6. 3d point accuracy depending on measuring distance
3.3.2 Absolute accuracy evaluation: The absolute point measurements were compared with the reference coordinates. In table 2 the resulting standard deviations of the coordinate differences are listed, where n stands for the number of points measured. For this evaluation the multiple stereoscopic measurements were weighted based on their measuring distance and averaged so that they are comparable with the measurements done with least-squares-matching. By contrast, the measurements done with the disparity map are not averaged as measured just once and only for the 11 megapixel system.
Camera
Table 2. Absolute accuracy results (x is pointing right, y in driving direction and z up)
Generally, one can see that the main part of the error is always in y-direction, which is in driving direction and that the 11 megapixel camera system performs slightly better. This is mostly influenced by the geometry of the forward intersection and the uncertainty in relative orientation. However, most of the uncertainty is influenced by the navigation system. This could be improved by using some of the check points as control points to stabilize the trajectory processing, which is proposed in Eugster et al. (2012). Additionally one can't really see a difference between the first two measuring methods keeping in mind, that the operators for the stereoscopic measurements were non-professionals. The results from the 3d monoplotting measurements are hardly comparable with the others due to a lack in number of measurements and that they were not averaged. This means that each point was measured just once in one specifically chosen stereo image pair, whereas for the other two methods each point was measured multiple times. Please note, that the disparity map was enhanced by additional LiDAR measurements which were not involved in the other measuring methods.
3.3.3 Relative accuracy evaluation: The last step was to evaluate the relative accuracy of a single 3d point measurement
within a certain area of about 20 m around the system. For this purpose, multiple distances computed with the single point measurements were compared with the corresponding distances computed by the reference check point coordinates. The reference distances were regarded as error-free because it can be assumed that their local accuracy is much better than the given 1-2cm which is for the whole net. The distances chosen between check points ranged from about 4 to 20 m. In table 3 the resulted standard deviations are listed, where n stands for the number of distances computed. The standard deviations are computed for 3d distances. However the accuracy of a relative 3d point measurement can be computed by dividing the given standard deviations by the square root of 2.
Camera
Table 3. Relative accuracy results
The results of the relative accuracy evaluation showed slightly better accuracies for the 11 megapixel camera system. It can also be seen that the LSM-based measuring method delivered slightly better results than the stereoscopic method, however it is not significant. 3d monoplotting delivered the poorest results in this case, but it has to be mentioned that additional unsignalized natural check points where used here in order to obtain a reasonable number of measurements. Thus, the uncertainty in identification of the points might have influenced this result.
4. RADIOMETRIC PERFORMANCE EVALUATION
The main goal of the radiometric evaluation was to identify the performance of the given cameras and to look for possible ways to enhance the images, especially under difficult light conditions. One big issue was to enhance images with big differences between sunny parts and shaded parts (see figure 8), which happens quite often. In this condition a high dynamic range of the camera is needed in order not to lose information due to under- or overexposure. Nowadays most of the camera manufacturers provide cameras with more than just 8 bit radiometric resolution, such as ours that have a resolution of 12 bits. This feature could be used to dynamically brighten up or darken the displayed image section on screen, similar as it is done by common photogrammetric and remote sensing software. However, this requires delivering the whole 12 bit data to the client, which leads to a very large amount of data transfer that is unrealistically to implement which exceeds the current web-streaming capacity. Here a short explanation of our image-workflow from the camera to the user. The images are saved in a raw 12bit format. Further they are converted to 8bit and reprojected to normalized and distortion-free images, they are compressed, tiled and cached on a server. Finally the images are streamed over the internet to our web-based software, where they are displayed to the user. In this workflow we did not yet exploit the 12 bit radiometric resolution of the cameras because International Archives of the Photogrammetry, Remote Sensing and Spatial Information Sciences, Volume XXXIX-B5, 2012
we applied a 12 to 8 bit down sampling that must be used in formats and for displaying on screen. However, some image processing methods could be applied to the 12 bit images before the down sampling. One processing method we have applied is a so called tone mapping operation that is normally used for high dynamic range (HDR) images with more than 16 bits. The algorithm adjusts the contrast of the image locally based upon the full 12 bit resolution. Afterwards it samples the image down from 12 to 8 bit resolution. In our investigation we got quite good results, where the overexposed parts were darkened and the underexposed parts were brightened up (see Figure 7).
Figure 7. Tone mapping example (left = original, right = enhanced)
5. ENHANCEMENT OF DISPARITY MAP GENERATION
In our investigations we applied a dense matching algorithm to our stereo image pairs which delivered a disparity map that was often incomplete depending on several factors such as a poor radiometric calibration and difficult environmental lighting and contrast conditions. In order to enable reliable and area-covering 3d monoplotting in images, there was a need to enhance and complete those disparity maps. However, our main goal of these investigations was not to find better dense matching algorithms but to improve the pre-processing in order to obtain optimal disparity maps and to find further methods to enhance already computed disparity maps.
5.1 Applied semi-global matching results
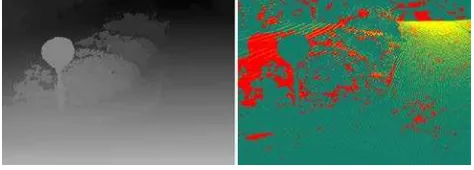
The first step done before applying a dense matching algorithm was the generation of normal and distortion free images, which has already been described in chapter 3.2. These images were then entered in a semi-global block matching algorithm implemented in OpenCV that is unfortunately not the original variant introduced by Hirschmüller (2008). Instead, it is a less sophisticated version with limited compensation in illumination differences (Willow Garage, 2012). Our computations with the original images yielded disparity maps with a completeness of about 70% in the relevant area on the road, where we used the same data as for the geometric accuracy evaluation (see Figure 8).
5.2 Improvement in disparity map generation
The first action was to adjust the differences in illumination of the image pairs. Although, both of the cameras of each stereo system were set up in the same way, they were adjusting their illumination parameters automatically during the mission depending on their previous recordings. The different perspectives of the cameras can then cause slight differences in illumination of the images, thus the images had to be adjusted to
each other by histogram matching. In addition the lenses of the 11 megapixel camera had a strong vignetting effect, which also had to be removed. Applying these corrections the disparity map completeness increased from 70% to 89% inside the relevant area on the road (Barmettler, 2012).
Figure 8. Disparity map without enhancement (left = original image, right = disparity map)
5.3 Completion of disparity maps
Despite good results achieved by image adjustments there were still holes and gaps in the disparity map. Thus, different interpolation methods were evaluated based on well-known image processing algorithms such as morphological operators, morphological hole filling and others. In the end best results could be achieved by a morphological detection of the holes borders and by filling of these holes using a linear interpolation method (Barmettler, 2012). However, interpolating big holes can cause large errors, especially on sharp transitions from foreground objects to background objects, where the interpolated area gets tilted to the back. A way to avoid such large errors would be the filling of these wholes by projecting additional measurements to the image space. These points can come from other dense matching done with other stereo-image pairs or from an additional laser scanner.
We did some first investigations with a Sick LMS profile laser scanner that has a performance of about 13'000 point measurements per second, which is relatively low compared to contemporary mobile laser scanners. Nevertheless, for our purpose, the robust completion of disparity maps, this scanner type was sufficient. The LiDAR-based measurements were then projected to image space, which results in an additional disparity map that has to be merged with the vision-based disparity map. If pixels have multiple values in both disparity maps they are weighted averaged due to a previously given accuracy and a tolerance for removing outliers. Finally the holes in the merged disparity map are filled by the described method, which results in much smaller errors due to interpolation. A quality map gave information about the origin of the disparity value, such as interpolation, averaging, LiDAR only or vision-based only (see Figure 9).
Figure 9. Merged disparity map
(left = merged and interpolated, right = quality map)
The resulting disparity map is one hundred per cent complete and a valuable basis for robust 3d monoplotting.
6. CONCLUSION AND OUTLOOK
In our investigations we demonstrated that the stereovision mobile mapping system is capable of consistently delivering absolute 3d point accuracies of about 4 cm in horizontal and 2 cm in vertical position. The relative 3d point accuracy has been shown to be in the range of 1-2 cm. The results we achieved by applying a tone mapping operation on our 12 bit imagery are very promising for future work. It was also possible to achieve better results from dense stereo matching by applying radiometric corrections to the images in advance. Despite the tremendous progress in dense stereo matching, the generation of 100% complete disparity maps supporting both accurate and robust 3d monoplotting remains a big challenge. In our paper we showed two approaches, one based on interpolation only and one incorporating 3d data from an additional mobile scanner carried on board.
The system presented has already often been applied in professional and research projects. Especially the intuitive interpretation of images and the 3d monoplotting measuring method can provide an additional value of such data also for non-photogrammetrists.
For future work refinements of the presented calibration procedures could be done, especially to improve the relative orientation accuracy, which would result in a better relative accuracy of the system. Concerning the absolute accuracy, the development of navigation systems and the possibility to enhance the trajectory processing by incorporating image measurements, see Eugster et. al. (2012), will be further pursued. In addition, the completeness of disparity maps could be improved by applying multi-image matching algorithms to the stereo image sequences.
REFERENCES
Arnold, S., 2011. Stereovision Mobile Mapping. Leistungs-vergleiche für unterschiedliche Bildsensoren. Bachelor Thesis, FHNW University of Applied Sciences and Arts Northwestern Switzerland, Muttenz, Switzerland (unpublished).
Barmettler, A., 2012. Fusion vision- und laserbasierter 3D-Punktwolken für robustes bildbasiertes 3D-Mobile Mapping. Master Thesis. FHNW University of Applied Sciences and Arts Northwestern Switzerland, Muttenz, Switzerland (unpublished).
Ellum, C. & El-Sheimy, N., 2002. The Calibration of Image-Based Mobile Mapping Systems. International Association of Geodesy. 2nd Symposium on Geodesy for Geotechnical and
Structural Engineering, Berlin.
Eugster, H., Huber, F., Nebiker, S. & Gisi, A., 2012. Integrated Georeferencing of Stereo Vision Image Sequences captured with a Mobile Mapping System - Approaches and Results from a Practical Perspective. In: International Archives of Photogrammetry, Remote Sensing and Spatial Information
Sciences, XXII ISPRS Congress, Melbourne.
Hirschmüller, H., 2008. Stereo Processing by Semiglobal Matching and Mutual Information. IEEE Transactions on
Pattern Analysis and Machine Intelligence, 30(2), pp. 328-341.
Huber, F., Eugster, H. & Nebiker, S., 2011. Image Sequence Processing in Stereovision Mobile Mapping – Steps towards Robust and Accurate Monoscopic 3D Measurements and
Image-Based Georeferencing. In: Photogrammetric Image
Analysis 2011, Lecture Notes in Computer Science. Springer,
Berlin / Heidelberg, Germany, Vol. 6952, pp. 85-95.
Novak, K., 1991. The Ohio State University Highway Mapping System: The Stereo Vision System Component. Proceedings of
the 47th Annual Meeting of The Institute of Navigation,
Williamsburg, VA, pp. 121-124.
Schenk, T., 1999. Digital Photogrammetry. TerraScience, Laurelville, OH.
Schwarz, K., Martell, H., El-Sheimy, N., Chapman, M. & Cosandier, D., 1993. VISAT - A Mobile Highway Survey System of High Accuracy. In: Proceedings of the Vehicle
Navigation and Information Systems Conference, Ottawa, pp.
476-481.
Willow Garage, 2012. OpenCV. Open Source Computer Vision Library. http://opencv.willowgarage.com (13.4.2012)
ACKNOWLEDGEMENTS
This work was financially supported by the Swiss Commission for Technology and Information CTI as part of the SmartMobileMapping project.