CYLINDER BASED SELF CALIBRATION OF A PANORAMIC
TERRESTRIAL LASER SCANNER
Ting On Chanand Derek D. Lichti
Department of Geomatics Engineering, University of Calgary
2500 University Dr NW, Calgary, Alberta, T2N1N4 Canada
(ting.chan, ddlichti)@ucalgary.ca
Commission V, WG V/3
KEY WORDS: TLS, Geometric Calibration, Close Range , Feature, Object, Accuracy ABSTRACT:
Terrestrial Laser Scanners (TLSs) have become state0of0the0art metrological sensors for many surveying purposes in recent years. Due to the demand for high precision surveying with TLSs, efficient, rigorous and in0situ calibration methodologies are always desired. Recent research on in0situ calibration with planar features has demonstrated improved cost0effectiveness and promising results (Glennie and Lichti, 2010; Chow et al., 2011; Chow et al., 2012). However, if there is a need for calibrating the scanners when sufficient plane surfaces with several orientations are not available, as commonly occurs indoors, other common geometric features, namely cylindrical structures, can be used as alternative geometric constraints for in0situ self0calibration. Cylindrical features can be found in indoor environments such as water pipes attached to the walls or suspended from ceilings, concrete pillars, metal poles and many others. In this paper, three 3D models of cylinders, with vertical and horizontal orientations containing one scaling, two rotational and two translational parameters are discussed. The cylinder models are parameterized with the sexternal orientation parameters and the additional parameters as the least0squares functional models for the self0calibration. The self0 calibration is examined with the real data obtained from the Lecia HDS6100 panoramic TLS. The results of vertical, horizontal and mixed cylinder0based calibration with data captured by different scanner position are analysed in detail in terms of the parameters correlations. The results show realistic estimation of calibration parameters for several cases. The results also suggest that using both vertical and horizontal cylinders for the calibration can effectively decorrelate the parameters especially for the case of lack of cylinder point cloud overlap. The concepts developed in this paper might also be extended to the hybrid type TLSs, as well as to the self0calibration of airborne laser scanning (ALS) using cylindrical features such as oil pipes or other large scale cylindrical infrastructure.
1. INTRODUCTION
Cost effective in0situ self0calibration of terrestrial laser scanners (TLSs) is always desired for high accuracy surveying. Planar features can be used to perform in0situ self0calibration whenever flat planar surfaces with several different orientations are available in an unoccupied space (Glennie and Lichti, 2010; Chow et al., 2011). However, indoor in0situ calibration may sometimes be hindered by the lack of spacious scenes with several flat planar surfaces (e.g. flat ceiling surface may be “contaminated” by vents, lighting or rough insulating foam), while outdoor in0situ calibration may also be inhibited by extreme weather conditions if the planar surfaces of building façades are used. Thus, the use of alternative geometric features for calibration will enhance flexibility of the in0situ calibration. Furthermore, high correlations always exist between parameters for point0based and plane0based calibration (Lichti 2010; Chow et al. 2011) and this hinders their estimations.
The alternative geometric features used for in0situ calibration should also be readily found and segmented if applicable, automatically, in most indoor and outdoor scenes. Cylindrical features can be one of them as there are often metal poles (e.g. lamp poles and sign poles), concrete pillars, water/gas pipes, or many other examples existing in the surrounding.
In this paper, a new self0calibration method using cylindrical features for TLSs is introduced and calibration results are analysed in terms of the parameters. Though using cylindrical features on sensor calibration is a rather new concept, the
cylindrical features are well studied by a number of researchers in terms of fitting algorithms (e.g. Shakarji, 1998), point cloud registration (e.g. Rabbani et al., 2007) and segmentation (e.g. Pfeifer et al. 2004). In particular, cylindrical pole0like objects are one of the most popular segmented features (e.g. Lehtomäki et al., 2010). Therefore, the idea of the cylinder0based self0 calibration will also benefit from the rapid development of automatic segmentation of the cylindrical features. In this paper, the parameter correlations of the calibration will be focused.
2. THE CALIBRATION MODEL
The principle of cylinder0based self0calibration is similar to that of plane0based (Chow et al., 2011) except for the geometric models involved. This employs the least0squares algorithm to estimate the external orientation parameters (EOPs), the cylinder model parameters, and also the additional parameters (APs) simultaneously in such a way that the observation points from the TLS are first transformed to the object space by the rigid body equation (Equation 1) and then the object space coordinates are constrained to lie on cylindrical features with the minimum residuals produced using the least0squares. The following equation transforms the scanner space coordinates, (X
Y Z)T to the object space coordinates, (x y z)T:
where ωk, φk, κk, Xsk, Ysk, and Zsk are the EOPs of the scanner
position k.
While only one geometric model is required for modelling of planes in all different orientations, there are three separate geometric models (denoted by fV, fHx andfHy) for vertical and
horizontal cylindrical features. The models are presented in Sections 2.1 and 2.2. The calibration can involve one or more of the models simultaneously in one single adjustment process depending on the orientations of the cylindrical objects existing in the calibration site.
2.1 Mathematical Model for Vertical Cylinders
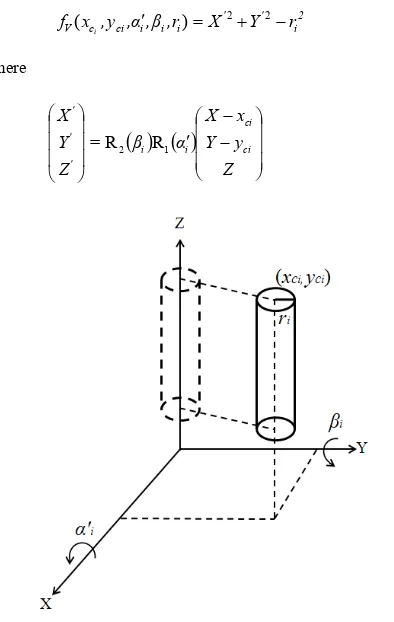
Since there are only five degrees of freedom for cylinders space and fV can be expressed as the following equation:
2
Figure 1. The vertical cylinder model with cylinder centre (xc, yc) in the object space
2.2 Mathematical Models for Horizontal Cylinders
When 45˚<|α'|<135˚ or 45˚<|β|<135˚ for the vertical cylinder, the cylinder should be modelled in another way such that the rotation about the z0axis (γ) becomes significant. Thus we treat the cylinder as horizontal. There are two models (fHx and fHy)
for the horizontal cylinder. If, after the translation of the cylinder centre, such a horizontal cylinder has a relatively small angle (|γ|<45˚) for the rotation to align with the x0axis than with the y0axis, the model fHx can be used. For the jth horizontal respectively and r is the radius of the cylinder. Figure 2 depicts the model parameters.
Therefore, for the jth horizontal cylinder, f respectively and r is the radius of the cylinder. Figure 3 shows the model parameters.
2.3 Mathematical Model for Scanner Systematic Error
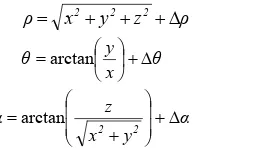
The scanner space coordinates (x, y, z) are the derived coordinates from the raw measurements, range (ρ), horizontal direction (θ), and elevation angle (α) expressed in a spherical coordinate system, similar to that of the theodolites and total stations. Thus the system error terms, Hρ, Hθ and Hα for the range, horizontal direction, and elevation angle measurement respectively should also be expressed in the spherical coordinate system as the following:
ρ calibration and the error terms can be expressed as:
ρ=a0 (11) can be found in Lichti (2007).
3. EXPERIMENTAL DESCRIPTION
3.1 Data Capture
The proposed cylinder0based method was examined with real data captured by a panoramic TLS, Lecia HDS6100. Previous calibration work using other approaches for the Lecia HDS6100 can be found in Chow et al. (2012). Three independent datasets (Datasets A, B and C) were captured with the HDS6100 at three different locations at the University of Calgary campus. Cylinder features were segmented manually from the captured data for the calibration. The datasets comprise:
• Dataset A: Five vertical metal poles that support a wooden shelter, with a radius of approximately 6 cm, were captured from four different scanner positions as shown in Figure 4. • Dataset B: Five horizontal water pipes hanging from a ceiling in a hallway, with average radius 8 cm, were captured in two different scanner positions as shown in Figure 5.
• Dataset C: Five vertical concrete pillars (radius approximately 38 cm) and three horizontal hanging water pipes (radius approximately 8 cm) in two different scanner positions as shown in Figure 6.
Figure 4. Dataset A: vertical poles
Figure 5. Dataset B: hanging water pipes
Figure 6. Dataset C: concrete pillars and hanging water pipes 3.2 Calibration
Several two0station calibrations were applied to all three datasets. For each calibration, the basic systematic error terms described in Section 2.3, the cylinder parameters, and the scanner positions Ni (i =1,2,3…) relative to the scanner position M were estimated simultaneously with a least0squares adjustment. We denote the calibration as M0Ni. For example, for Dataset A, when we calibrate the scanner by fixing the scanner position 1 and estimating the EOP for scanner position 2, we denote the calibration as 102.
3.2.1 Dataset A – Vertical Cylinder based Calibration
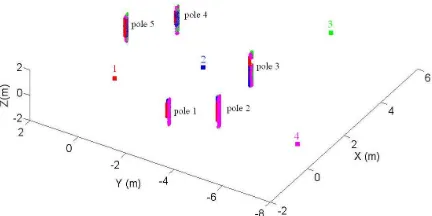
Figure 7 shows the five pole locations and the four scanner positions in object space. The point clouds are coloured the same as their respective scanner position. For the five poles, three calibrations using fV: 102, 103, and 104 were performed
and the results are shown in Section 4.1.
3.2.2 Dataset B – Horizontal Cylinder based Calibration
The point clouds of the five parallel hanging water pipes (Figure 8) were extracted for performing the 102 calibration using the horizontal cylinder model fHx. The results are shown in
Section 4.2.
Figure 7. The scanner position and the five pole positions in a common object space (the object space of scanner position 1) for Dataset A
Figure 8. The scanner positions and the five pipe positions in a common object space (the object space of scanner position 1) for Dataset B
3.2.3 Dataset C – Mixed Cylinder based Calibration Two 102 calibrations were performed using different numbers and types of cylinders for Dataset C. The first 102 used only five pillars with fV while the second 102 used five pillars and the
three hanging water pipes with fV and fHx respectively as shown
in Figure 9. The results are shown in Section 4.3.
Figure 9. The scanner positions, the five pillar positions, and also the three water pipe positions in a common object space (the object space of scanner position 1) for Dataset C
4. CALIBRATION RESULTS
4.1 Dataset A Calibration Results
The estimated calibration coefficients with their standard deviations (σ) are shown in Table 1. It can be seen that the 102 has the lowest σ for a0 and b1 and 103 has the largest. The
estimated values for a0 and b1 also fall into a reasonable range.
This can be analysed along with the correlation matrices shown in Figure 10, 11 and 12 for 102, 103 and 104 respectively. The estimated c0 and also its σ are higher than what are expected.
This is most likey due to the high α'3$c0correlation (Figure 10)
for 102. This high correlation also exits for 104 (Figure 12). Table 1. Estimated calibration coefficients for Dataset A
calibration est. value (mm)
σ (mm)
est. value (")
σ (")
est. value (")
σ (")
1 2 00.92 0.04 10.90 1.10 065.60 9.48
1 3 02.74 0.10 8.13 2.40 18.60 10.50
1 4 01.45 0.06 2.93 1.76 30.12 6.58
a0 b1 c0
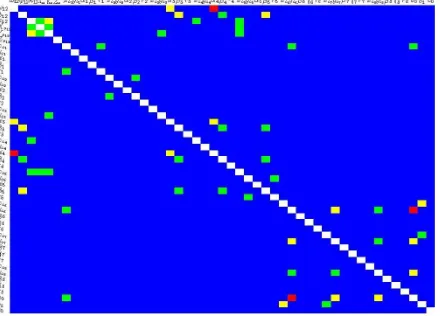
It can be seen that 102 gives the lowest number of high correlation coefficients (0.9 0 0.99 shown as red, 0.8 0 0.89 shown as yellow in Figures 10, 11 and 12) while 103 gives the highest number of them among the three calibrations. The 102 captures the five cylinders at scanner positions 1 and 2 as depicted in Figure 7, the point clouds captured at these two positions can overlap with the largest extent comparing to 103 and 104. This can be shown by inspecting the x0y plot of the cylinder point cloud for 102, 103 and 104 in Figures 13, 14 and 15 respectively.
Figure 10. The correlation matrix of Dataset A 102 (white for coefficients > 0.99; red for coefficients between 0.9 and 0.99; yellow for coefficients between 0.8 and 0.89; green for coefficient between 0.7 and 0.79; blue for coefficients < 0.7)
Figure 11. The correlation matrix of Dataset A 103 (white for coefficients > 0.99; red for coefficients between 0.9 and 0.99; International Archives of the Photogrammetry, Remote Sensing and Spatial Information Sciences, Volume XXXIX-B5, 2012
yellow for coefficients between 0.8 and 0.89; green for coefficient between 0.7 and 0.79; blue for coefficients < 0.7) For 103, the scanning positions lead to the least average overlap of the cylinder point clouds. This is likely the main cause for the high correlations between the scanner position parameters and the cylinder centre parameters for all five cylinders as seen in Figure 11. Among the five poles for 103, poles 1, 2 and 3 have the least overlap (there is no overlap point cloud for pole 3 in 10 3 as shown in Figure 14) and thus their associated correlations are relatively higher. Apart from this, the correlations between cylinder parameters is also high for 103, presumably also due to the low overlap of cylinder point clouds. Overall, the estimated results and the correlation coefficients of 102 suggest that a five vertical poles two0stations calibration can work appropriately.
Figure 12. The correlation matrix of Dataset A 104 (white for coefficients > 0.99; red for coefficients between 0.9 and 0.99; yellow for coefficients between 0.8 and 0.89; green for coefficient between 0.7 and 0.79; blue for coefficients < 0.7) Calibration 104 has more overlap for pole 4 and pole 5 than 103 does, therefore, the correlation between the centre of poles 4 and 5, and the scanner position are mitigated. However, there is no overlap for pole 1 and 2 in 104, and therefore the corresponding correlations remain high as illustrated in Figure 12. Furthermore, it is worth noting that high correlation exists between κ and Xs, and this indicates that the scanner position is
somehow difficult to estimate. This is probably due to the fact that the scanner position relies mainly on poles 4 and 5 since they have the most overlap. However, both poles 4 and 5 have only spanned approximately half of the cylinder circular surface and thus it results in insufficient cylinder surface data to determine the scanner positions.
Figure 13. Pole x0y plot for Dataset A 102
Figure 14. Pole x0y plot for Dataset A 103
Figure 15. Pole x0y plot for Dataset A 104 4.2 Dataset B Calibration Results
For the Dataset B calibration 102 , each of the pipes has some overlap in the middle, as the scanner positions 1 and 2 were beneath the pipes are on either side of the set of pipes as illustrated in Figure 8. There is “sufficient” overlap of the point clouds captured from two positions on either side of the hallway (approximately 2.2 m apart). This results in the absence of the extreme high correlation coefficients (red) presenting in the correlation matrix as shown in Figure 16. However, the matrix is “spoiled” by one absolute correlation, i.e. 1, between Xs and Ys. This is presumably due to the fact that all hanging pipes are parallel, so the estimation of Xs and Ys just “slide” along the
parallel pipes. Therefore, if an orthogonally0oriented pipe or one with a significantly different orientation were included, this
Xs0Ys correlation problem might be relieved.
Figure 16. The correlation matrix of Dataset B 102 (white for coefficients > 0.99; red for coefficients between 0.9 and 0.99; yellow for coefficients between 0.8 and 0.89; green for coefficient between 0.7 and 0.79; blue for coefficients < 0.7) 4.3 Dataset C Calibration Results
The two different 102 calibrations demonstrate the effect of mixing vertical and horizontal cylinder features for the calibration. The estimated calibration coefficients are shown in Table 2. The estimated a0 and b1 became much more realistic
after the inclusion of three extra parallel horizontal water pipes (pipe 6, 7 and 8) to the calibration using only five vertical pillars. This is also explained by inspecting the two correlation matrices shown in Figure 17 and Figure 18 for the only0vertical cylinder0based 102 and mixed cylinder0based 102 respectively.
Table 2. Estimated calibration coefficients for Dataset C
calibration est. value
(mm) σ (mm)
est. value (")
σ (")
est. value (")
σ (")
1 2 (5 vertical pillars) 025.31 0.10 922.00 6.56 043.85 2.10
1 2 (5 vertical pillars
+ 3 horizontal pipes) 2.56 0.03 04.43 0.62 7.14 0.74
a0 b1 c0
The five pillar centres are highly correlated with each other due to the lack of the overlap of the point clouds similar to the International Archives of the Photogrammetry, Remote Sensing and Spatial Information Sciences, Volume XXXIX-B5, 2012
situation of Dataset A 103. The inclusion of three extra parallel horizontal water pipes has considerably reduced the number of high correlation coefficients as shown in Figure 18. Higher correlations still exist between the rotational EOPs and the rotation angles of pillars 3, 4 and 5. The water pipes located in between pillars 1 and 2 decorrelates the pillar 1 and 2 parameters with other pillar parameters. However, some high and fairly high (yellow, green) correlations between pillar 1 and 2, and the water pipes centres are introduced. Overall, the inclusion of the horizontal features to the vertical features has been shown to be able to decorrelate most high correlations caused by the lack of overlapping point clouds.
Figure 17. The correlation matrix of Dataset C 102: vertical cylinders only (white for coefficients > 0.99; red for coefficients between 0.9 and 0.99; yellow for coefficients between 0.8 and 0.89; green for coefficient between 0.7 and 0.79; blue for coefficients < 0.7)
Figure 18. The correlation matrix of Dataset C 102: vertical and horizontal cylinders (white for coefficients > 0.99; red for coefficients between 0.9 and 0.99; yellow for coefficients between 0.8 and 0.89; green for coefficient between 0.7 and 0.79; blue for coefficients < 0.7)
5. CONCLUSIONS
This paper has demonstrated a new cylinder0based self0 calibration method for TLSs with three datasets captured by a panoramic scanner. The calibration results are analysed in terms of the parameter correlations which are shown to be dependent on the overlapping cylinder point clouds captured at different
positions. Five vertical poles have been shown to be sufficient for calibration while when only several hanging water pipes are used for calibration, hanging pipes with different orientations should be used to avoid absolute correlation(s) between the x and y coordinate of the EOPs. The simultaneous usage of vertical and horizontal cylindrical features for calibration has shown to effectively deccorrelate high correlation caused by lack of overlapping cylinder point clouds. Overall, the cylindrical features have been demonstrated to be an alternative to planes and points which have traditionally been used in TLS calibration.
ACKNOWLEDGEMENTS
This work is supported by the Natural Sciences and Engineering Research Council of Canada (NSERC) and the Canada Foundation for Innovation.
REFERENCES
Chow, J., Lichti, D. D. and Glennie C, 2011. Point0based versus plane0based self0calibration of static terrestrial laser scanners.
International Archives of Photogrammetry, Remote Sensing and
Spatial Information Sciensces, XXXVIII, Part 5/W 12, [On0CD
ROM].
Chow, J., Lichti, D.D. and Teskey W. F., 2012. Accuracy assessment of the FARO Focus and Lecia HDS6100 panoramic0 type terrestrial laser scanners through point0based and plane0 based user self0calibration, FIG Working Week 2012, Rome, Italy 6010 May 2012.
Glennie, C. and Lichti, D. D., 2010. Temporal stability of the velodyne hdl064e s2 scanner for high accuracy scanning applications. Remote Sensing, 2, pp. 161001624.
Lichti, D.D., 2010. Terrestrial laser scanner self0calibration: correlation sources and their mitigation. ISPRS Journal of
Photogrammetry and Remote Sensing, 65 (1), 930102.
Lichti, D.D., 2007. Modelling, calibration and analysis of an AM0CW terrestrial laser scanner. ISPRS Journal of
Photogrammetry and Remote Sensing, 61 (5): 3070324.
Lehtomäki, M., Jaakkola, A., Hyyppä, J., Kukko, A., Kaartinen, H, 2010. Detection of Vertical Pole0Like Objects in a Road Environment Using Vehicle0Based Laser Scanning Data. Remote Sensing, 2, pp. 6410664.
Pfeifer, N., Gorte, B., Winterhalder, D., 2004. Automatic Reconstruction of Single Trees from Terrestrial Laser Scanner Data. International Archives of Photogrammetry, Remote Sensing and Spatial Information Sciensces, XXXV, Part B5, pp. 1140119.
Rabbani, T., Dijkman, S., van den Heuvel, F. and Vosselman, G., 2007. An integrated approach for modelling and global registration of point clouds. Journal of Photogrammetry and Remote Sensing,61 (6), pp. 3550370.
Shakarji, C.M., 1998. Least0squares fitting algorithms of the NIST algorithm testing system. Journal of Research of the National Institute of Standards and Technology, 103(6), 6330 641.