POTENTIAL OF MULTI-TEMPORAL UAV-BORNE LIDAR IN ASSESSING
EFFECTIVENESS OF SILVICULTURAL TREATMENTS
Udaya Vepakomma a,*, Denis Cormier a
a FPInnovations, Pointe Claire, Canada H9R 3J9 – (udayalakshmi.vepakomma, denis.cormier)@fpinnovations.ca
Commission VI, WG VI/4
KEY WORDS: time series, LiDAR, forestry, growth, mortality
ABSTRACT:
Silvicultural treatments are practiced to control resource competition and direct forest stand development to meet management objectives. Effective tracking of thinning and partial cutting treatments help in timely mitigation and ensuring future stand productivity. Based on a study conducted in autumn 2015, our findings in a white pine dominant forest stand in Petawawa (Ontario, Canada) showed that almost all individual trees were detectable, structure of individual trees and undergrowth was well pronounced and underlying terrain below dense undisturbed canopy was well captured with UAS based Riegl Vux-1 lidar even at a range of 150m. Thereafter, the site was re-scanned the following summer with the same system. Besides understanding the difference in distribution patterns due to foliage conditions, co-registering the two datasets, in the current study, we tested the potential of quantifying effectiveness of a partial cutting silvicultural system especially in terms of filling of 3D spaces through vertical or lateral growth and mortality in a very short period of time.
* Corresponding author
1. INTRODUCTION
Silviculture treatments are applied to control stand composition, structure and processes (Smith 1986). Monitoring treatment results is needed to ensure success but parameters to assess will vary with treatment objectives. For example, a commercial thinning is a tending treatment to manipulate stand structure by partially removing harvestable volume to help improving vigour and growth of the residual stand. In this case, tracking of the treatment in terms of growth, rate of mortality, filling of the available growing space (canopy closure) etc., is important for the success of the future stand productivity. In the case of regeneration cuts (single tree selection or shelterwood), the focus will be put on the regeneration establishment, its distribution and release of the sub-canopy. Data intensive repeat survey through conventional ground sampling after partial harvest tends not to be time and cost effective, particularly in spatially dispersed and small forest blocks.
Lidar (Light detection and ranging) in recent years is increasingly being adapted as a support tool in decision making within forest operations (Barber et al 2016, Vepakomma et al. 2012, Naesset et al 2004, Lim et al 2003). Recording of multi-returns has furthered the ability to sufficiently describe 3D elements and morphological properties of several biophysical parameters across broad spatial scales (Popescu, 2008, Zhang et al., 2016, Giannico et al., 2016).
Repeat surveys of lidar was successfully used to understand disturbances and their impact on forest dynamics (Vepakomma et al. 2011, Vepakomma et al. 2012), timber extraction (Anderson et al 2008), change in biomass (Babcock et al., 2016), canopy structure (Hopkinson et al., 2008) or growth rates (Hudak et al., 2008). However, most research based on bi-temporal lidar focused in capturing changes at area units or
forest stands and rarely to assess changes at tree or sub-canopy level. One possible reason is the availability of high point density data needed to capture subtle changes at such fine spatial scales.
Development in miniaturized technology allowed integration of light-weight laser scanning capabilities through full-waveform digitization of multi-targets on a UAS (Unmanned Aerial System) platform from lower altitudes (Vepakomma et al 2015, Vepakomma & Cormier 2015). Flying below the clouds, limited logistics and deployment at ease makes UAS an interesting platform for forest operations. High density, short range, aerial perspective and large field of view give them an advantage of both terrestrial and aerial lidar systems (Wallace et al. 2012), and hence we hypothesise they are better equipped for detailed description of the canopy and below the canopy layers for tracking subtle changes in vegetation. We also hypothesise that they will be effective in capturing short term changes important for monitoring treatment effects and implementing timely corrective measures when needed.
In this study, we would like to understand the potential of multi-temporal lidar data on a UAS in quantifying the effectiveness of silvicultural treatments, especially in terms of filling of 3D spaces through vertical or lateral growth and mortality at tree level in a very short period of time. In addition, we are also interested in understanding the impact of late autumn foliage on penetration of the laser up to the floor to describe the canopy and below the canopy.
2. MATERIAL AND METHODS
2.1 Study site
The selected study site falls within Petawawa Research Forest (PRF) in Ontario, Canada, that is predominantly white pine mixed with red pine, balsam fir and poplar species (Figure 1). Part of the selected 10.3 ha forested area had recently been harvested under a shelterwood system for managing white pine. The remnant vegetation has a height range of 6 – 36 m., with dense scrub on the floor. The terrain is rocky but fertile, and is relatively flat.
Figure 1. Ground photos showing dense forest (left) and open forest (right) in the study site
2.2 Data acquisition
To maintain the uniformity across acquisitions, the test site was flown twice (2015, 2016) with the same Riegl VUX-1 lidar system (Table 1) mounted on Renegade UAS helicopter. To match the survey specifications, lower scan rates, higher flight speed in 2015 were compensated by lower altitude, low flight speed and higher overlap in 2016 acquisition (Table 2). A change in point distribution pattern along the canopy is expected to be due to summer - autumn foliage changes. Overall the resultant point density is comparable over both acquisitions (Figure-2).
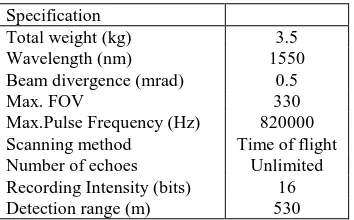
Specification
Total weight (kg) 3.5
Wavelength (nm) 1550
Beam divergence (mrad) 0.5
Max. FOV 330
Max.Pulse Frequency (Hz) 820000 Scanning method Time of flight Number of echoes Unlimited Recording Intensity (bits) 16
Detection range (m) 530
Table 1. Specifications of Riegl VUX-1 lidar system
Data provider’s classification after visual spot checks was accepted for this study.
To assess geopositional and vertical accuracy of Riegl Vux-1 lidar, several terrain and 10 randomly distributed paired-individual trees (of DBH > 8 cm) were precisely located using a survey grade precision (of sub centimeter accuracy) RTK DGPS on ground in 2015. Total tree height (with a Vertex), DBH and
crown diameter in two cardinal directions were noted for the trees.
Attribute 2015 2016
Altitude (m) 152 213
Flight speed (kts) 40 18
Scan rate 300 600
Point density (#/m2) 150 167 Swath width (deg) 65 65
Flight lines (#) 3 5
Scan angle (deg) ±40 ±22
Overlap (%) 40 60
Number of flights 1 1
Date of acquisition 30-Nov 21-Sept
Table 2. Specifications of lidar acquisition
Figure 2. 3D lidar point distribution of a sample site. Top image shows multi return echoes (blue-1st, red – 2nd, yellow – 3rd,
green – 4th returns); bottom image shows the gradient of vegetation height (green to orange)
2.3 Co-registration between the two datasets
Lidar datasets were co-registered following methods proposed in Vepakomma et al 2008. Shift in Z was tested by comparing elevations of lidar points on roads and rocks where first returns equaled last returns. Shifts in X and Y were assessed by visually comparing arithmetic difference between the respective interpolated digital surface models (DSM, a surface created by the maximum elevation in a given pixel) for trends of negative and positive elevational differences around a canopy. No significant shift in X, Y or Z were noted.
2.4 Single tree detection, tree metrics and growth
The location of individual stem tops was determined based on local maxima filter with a circular non-overlapping (moving) window of a radius of 35 cm (based on field observation) on the Gaussian filtered (Vepakomma et al 2011). Using each delineated crown segment as a cookie-cutter, all the lidar vegetation returns within were extracted for estimation of individual tree metrics (Figure 5). Vegetation height distributional metrics (quantiles of height computed for every 10th percentile), generally considered as indicators of canopy depth and structure of the crown, were also estimated. Crown diameter was defined as the vertical projection of the longest diameter of the crown on the ground. Average of the length of the sides of the rectangle that inscribes the delineated crown is approximated as crown diameter. This method replicates the conventional measurement of crown diameter in the field.
Vertical growth is estimated as the difference in maximum height and lateral growth is the difference in the estimated crown diameter between the two years.
Using a combination of 20th percentile and estimated DBH for each tree, the top canopy layer was eliminated to extract the understorey. Single stems in the understorey were identified, and space occupancy was assessed by overlaying a 2m X 2m grid.
3. RESULTS AND DISCUSSION
3.1 Lidar distribution and elevation accuracies
In this experiment, irrespective of the differences in acquisition parameters, general structure of the forest was ably captured with distinguishable clear stems of the trees, dense canopies as well as forest floor (Figure 2). Up to 7 returns were recorded in both years, and nearly 2% of all the returns reached the floor, with 2015 having a slightly better penetration due to autumn leaf-off conditions. 2016 data had a very high percentage of first returns. Point distribution in point classes and multi-targets shows a sharp increase of over 13% of returns from high vegetation during 2016 compared to 2015 due to the presence of larger leaf area during leaf on conditions (Figure 3). The decline of returns from low vegetation by 10% and ground returns by 2% is attributed to the densely foliated shrub layer present during the summer.
Both acquisitions matched well across X, Y and Z. An average bias of 0.07 cm and 0.02 cm in Z respectively for the 2015 and 2016 lidar datasets was estimated when comparing with the RTK measurements.
3.2 Single tree detection
All trees identified on ground were detected by the algorithm. Assessment of ground measured tree height showed a high correlation of 0.98 in both datasets. Validation of estimated crown diameter with field measured trees showed an average bias of 0.01 m using the 2016 dataset.
Figure 3. Distribution of lidar returns in various point classes (top) and multi-targets (bottom)
3.3 Monitoring changes
Keeping 2016 as a reference, number of crowns that matched in 2015 was extracted, and differences in their respective estimated total tree heights and crown diameters were assessed for changes. Relative comparison of the two datasets indicated prominent changes in the canopy structure appeared to have occurred during the study period. Over 90% of the trees showed growth (positive change) and 9.2% of loss (negative change). Nearly two thirds of this loss is represented by 18 matured fallen trees (between heights 11.5 m and 23.8 m) clearly indicated in Figure 4. An estimated 4.2% of changes in the canopy closure of the overstorey indicated an average annual conifer branch lateral extension of 0.85 m into the adjacent openings. This is corroborated by the difference in crown diameter estimates over the study period.
Figure 4. Height class distribution of the tress
Height-class distribution of the individual trees in the block estimated from 2015 and 2016 and vertical growth assessment made thereof (Table 3) realistically represents the condition in a matured stand and a stand that is benefitting from a release treatment (Figure 4). The small difference in the percentage number of trees in each class varied between 2015 and 2016 could be due to the change in foliage conditions during the two acquisitions of VUX-1.
Height-Class (m)
Average Annual Growth (m)
0 – 4 0.50
4 - 8 0.35
8 - 12 0.31
12 - 16 0.37
16 - 20 0.28
20 - 24 0.22
24 - 28 0.23
28 - 32 0.25
> 32 0.26
Overall 0.31
Table 3. Estimated annual individual growth during 2015-2016
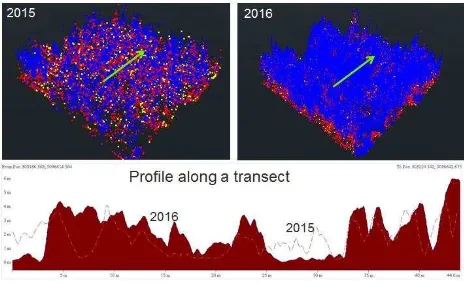
Eliminating the top canopy, the sub-canopy could be easily extracted and a sample window from a relatively open stand can be seen in Figure 5. Despite high scan angles in both years, ±40° in 2015 and ±22° in 2016, there is a sufficient penetration through the canopy to capture the growth of the vegetation and subtle foliage changes in the understorey even over a very short period of time.
Figure 5. Growth in the understorey. Distribution of multi return echoes (blue-1st, red – 2nd, yellow – 3rd, green – 4th returns) on the top and a profile description along a transect in
the sub canopy of a sample plot of 10 m2.
Individual stems could be easily extracted from the sub canopy, and filling of the growing space within a 4 m2 grid could be assessed (Figure 6) indicating stand succession establishment.
Figure 6. Filling of the growing space in the understorey.
4. CONCLUSION
UAS based lidar systems have the capability of providing a rich dataset suitable to extract a suite of quality determinants for assessing standing timber, viz., total tree height, crown diameter, height up to the last branch, length of the clear wood. Identification of mortality and growth assessment, both lateral and vertical, even at the individual tree level with UAS based lidar systems is realistic and provide relevant information about treatment results. The capability of efficiently monitor the sub-canopy components of the stand from the dense lidar data is also very promising for assessing success of successional potential of the treatments. This can potentially be a good tool in assessing the effectiveness of silvicultural interventions or site quality and could replace many of the assessments that are currently done from ground surveys.
ACKNOWLEDGEMENTS
This work was partly funded by the Forest Innovation Program of the Canadian Wood Fibre Centre (Natural Resources Canada). Technical support for the UAV flights was provided by RME Geomatics (Canada). The authors would also like to acknowledge the Canadian Forestry Service, particularly Peter Arbour, and Petawawa Army Base to have made the area available for our trial and for providing background data.
REFERENCES
Babcock C, Finley AO, Cook BD, Weiskittel A, Woodall CW, 2016. Modeling forest biomass and growth: Coupling long-term inventory and LiDAR data. Remote Sens Environ 182: 1-12.
Dandois, J.P.; Ellis, E.C. Remote sensing of vegetation structure using computer vision. Remote Sens 2010, 2, 1157– 1176.
Giannico V, Lafortezza R, John R, Sanesi G, Pesola L, Chen J, 2016. Estimating Stand Volume and Above-Ground Biomass of Urban Forests Using LiDAR. Remote Sensing 8(4) : 339.
Hopkinson C, Chasmer L, Hall RJ,2008. The uncertainty in conifer plantation growth prediction from multi-temporal lidar datasets. Remote Sens Environ 112(3): 1168-1180.
https://geo-matching.com/ 164-179
Hudak AT, Crookston NL, Evans JS, Hall DE, Falkowski MJ, 2008. Nearest-neighbor imputation of species-level plot-scale forest structure attributes from LiDAR data. Remote Sens Environ 112(5): 2232–2245.
Lim, K.; Treitz, P.; Wulder, M.; St-Onge, B.; Flood, M. LiDAR remote sensing of forest structure. Prog. Phys. Geog 2003, 27, 88–106
Moons, T., 1997. Report on the Joint ISPRS Commission III/IV Workshop “3D Reconstruction and Modelling of Topographic Objects”, Stuttgart, Germany http://www.radig.informatik.tu-muenchen.de/ISPRS/WG-III4-IV2-Report.html(28 Sep. 1999).
Morsdorf, F.; Nichol, C.; Malthus, T.; Woodhouse, I.H. Assessing forest structural and physiological information content of multi-spectral LiDAR waveforms by radiative transfer modelling. Remote Sens. Environ 2009, 113, 2152– 2163.
Næsset E. 2004. Practical large-scale forest stand inventory using small-footprint airborne laser-scanning. Scand. J. For. Res. 19:
Popescu SC, Zhao K A, 2008. Voxel-based LiDAR method for estimating crownbase height for deciduous and pine trees. Remote Sens Environ 112: 767–781.
QE Barber, CW Bater, ACR Braid, NC Coops, P Tompalski, SE Nielsen. 2016. Airborne laser scanning for modelling understory shrub abundance and productivity, Forest Ecology and Management 377, 46-54
Shrestha, R.; Wynne, R.H. Estimating biophysical parameters of individual trees in an urban environment using small footprint discrete-return imaging lidar. Remote Sens 2012, 4, 484–508.
Smith, D.M. 1986. The Practice of Silviculture. 8th ed. John Wiley & Sons, Inc., New York, NY, USA.
Smith, J., 1987a. Close range photogrammetry for analyzing distressed trees. Photogrammetria, 42(1), pp. 47-56.
Smith, J., 1987b. Economic printing of color orthophotos. Report KRL-01234, Kennedy Research Laboratories, Arlington, VA, USA.
Smith, J., 1989. Space Data from Earth Sciences. Elsevier, Amsterdam, pp. 321-332.
Smith, J., 2000. Remote sensing to predict volcano outbursts. In: The International Archives of the Photogrammetry, Remote Sensing and Spatial Information Sciences, Kyoto, Japan, Vol. XXVII, Part B1, pp. 456-469.
Vepakomma U, Schneider R, Berninger F, Mailly D, St-Onge B, Hopkinson C (2011) Estimating height of the green canopy of black spruce trees in a heterogeneous forest using lidar. Proceedings of the 32nd Symposium on Remote Sensing on Monitoring a Changing World, Sherbrooke, Canada, June 13-16 2011
Vepakomma U, St-Onge B, Kneeshaw D, 2011. Response of a boreal forest to canopy opening: assessing vertical and lateral tree growth withmulti-temporal LiDAR data. Ecol Appl 21: 99– 121.
Vepakomma U., Cormier D., Thiffault N. 2015. Potential of UAV based convergent photogrammetry in monitoring regeneration standards. ISPRS – Int. Arch. Photogramm. Rem. Sens. Spat. Inf. Sci. XL-1/W4: 281-285
Vepakomma, U., Cormier, D., 2015. Inventorying the forest: Laser scanning vs close range photogrammetry on a UAV. In S.Durrieu, C. Vega (Editors) Proceedings of SilviLaser 2015, 14th international conference on Lidar Applications for Assessing and Managing Forest Ecosystems, Sept 28-30, 2015, La Grande Motte, France.
Vepakomma,U., D. Kneeshaw, and M.J. Fortin. 2012. Spatial contiguity and continuity of disturbance in boreal forests through time: Gap persistence, expansion, shrinkage and displacement. Journal of Ecology. 100: 1257 – 1268
Wallace, L., Lucieer.A., Watson, C., Turner, D. 2012. Development of a UAV-LiDAR System with Application to Forest Inventory, Remote Sensing 2012, 4(6), 1519-1543
Zhang Z, Kazakova A, Moskal LM, Styers DM, 2016. Object-Based Tree Species Classification in Urban Ecosystems Using LiDAR and Hyperspectral Data. Forests 7(6): 122.