IMPROVING THE ACCURACY OF ESTIMATED 3D POSITIONS USING
MULTI-TEMPORAL ALOS/PRISM TRIPLET IMAGES
J. Susaki∗, H. Kishimoto
Department of Civil and Earth Resources Engineering, Graduate School of Engineering, Kyoto University; Email:{susaki.junichi.3r, kishimoto.hotsuma.74r}@kyoto-u.ac.jp
Commission III, WG III/1
KEY WORDS:ALOS/PRISM, DSM, triplet images, RPC model, Multi-temporal images
ABSTRACT:
In this paper, we present a method to improve the accuracy of a digital surface model (DSM) by utilizing multi-temporal triplet images. The Advanced Land Observing Satellite (ALOS) / Panchromatic Remote-sensing Instrument for Stereo Mapping (PRISM) measures triplet images in the forward, nadir, and backward view directions, and a DSM is generated from the obtained set of triplet images. To generate a certain period of DSM, multiple DSMs generated from individual triplet images are compared, and outliers are removed. Our proposed method uses a traditional surveying approach to increase observations and solves multiple observation equations from all triplet images via the bias-corrected rational polynomial coefficient (RPC) model. Experimental results from using five sets of PRISM triplet images taken of the area around Saitama, north of Tokyo, Japan, showed that the average planimetric and height errors in the coordinates estimated from multi-temporal triplet images were 3.26 m and 2.71 m, respectively, and that they were smaller than those generated by using each set of triplet images individually. As a result, we conclude that the proposed method is effective for stably generating accurate DSMs from multi-temporal triplet images.
1. INTRODUCTION
Digital surface models (DSMs) and digital elevation models (DE Ms) are widely used for topographic analyses in various fields. For example, in the field of disaster mitigation and management, simulations of flood, tsunami, lava flow from volcanoes, and land-slide often use DSM or DEM. The simulation of flood and tsunami in relatively flat areas, in particular, requires a highly accurate DSM or DEM, with accuracy needed to within the tens of cen-timeters. A DSM models the heights of objects on the ground, whereas a DEM models the heights of the ground when objects are virtually removed. Elevation data directly measured or gen-erated from data measured by aerial sensors are equivalent for DSM. Some topographic products derived from satellite and space-borne imagery are called DEM even though they are equivalent to DSM. Throughout this paper, we follow the terminology used in the literature.
Highly accurate DSMs can be constructed by use of light de-tection and ranging (LiDAR) data, which is accurate to within ±15 cm, and accordingly, a highly accurate DEM is generated by filtering the DSM. Airborne LiDAR is now popular for mea-surement, but the coverage is much more limited than satellite-based imagery. In contrast, interferometric synthetic aperture radar (InSAR) imagery can be used to generate height data. As an application, global topographic data have been generated from shuttle radar topography mission (SRTM) data. However, these data have a relatively low spatial resolution (approximately 90 m) and large geolocation and height errors (Rodr´ıguez et al., 2006). Gorokhovich and Voustianiouk (2006) improved the accuracy of the original SRTM 90-m DEM, but the vertical errors are still not small, at 7.58±0.60 m in Phuket, Thailand and 4.07±0.47 m in New York, USA (mean±standard error of the mean). In addition, the improved DEMs are sensitive to both slope and as-pect characteristics of the terrain. Therefore, optical imagery is
∗Corresponding author.
still the preferred choice for providing high-resolution DSM with high accuracy to cover a wide area.
Various techniques to improve the accuracies of DSMs and DEMs derived from optical sensor data have been investigated: block adjustment calibration (Bouillon et al., 2006), multi-scale wa-ter body detection (Fujisada et al., 2011), and dynamic triangle constraint in image matching (Zhu et al., 2007) are of particu-lar note. One recent advance is to use triplet (or greater) im-agery. For example, Zhang and Gruen (2006) used more than two IKONOS images simultaneously to generate DSMs by com-bining the matching results of feature points, grid points, and edges by employing a coarse-to-fine strategy. Giribabu et al. (2013) examined the accuracies of DEMs generated from stereo triplet Cartosat-1 images with a spatial resolution of 2.5 m at the ground. In that method, the planimetric and height root-mean-square errors (RMSEs) were approximately 2.5 m and 2.95 m, respectively.
de-termine three-dimensional (3D) coordinates at points of interest by solving observation equations composed from multi-temporal observations.
The remainder of this paper is organized as follows. An expla-nation of the proposed method is given in Section 2. The target location and data collected from the site are described, and the ex-perimental results are reported, in Section 3. The implications of these results and the validity of the algorithm are then discussed in Section 4. Finally, Section 5 concludes the paper.
2. METHOD 2.1 RPC Model
An RPC model expresses transformations between image coordi-nates. These are characterized by a lineland samplesalong with the latitudeφ, longitudeλ, and ellipsoidal heighthat a specific point. The data are normalized by using the scalesls, ss, φs, λs, hs and offsetsl0, s0, φ0, λ0, h0; these are applied to the variables
l, s, φ, λ and h, respectively, which are thereby normalized to ln, sn, φn, λn, andhn.
The RPC model comprises the quotients of two third-order poly-nomials, expressed as Equation (7).
ln =
Equations (1) and (2) are rewritten as Equation (9) by Taylor ex-pansion.
denote, respectively, the line and sample of the image coordinates corresponding to the approximate object coor-dinates.
2.2 Bias-corrected RPC Model
Now, we introduce a bias-corrected (equivalently, bias-compensated) RPC model by modifying Equations (1) and (2).
l+A0 = ls
Here,A0andB0denote translations of the line and sample
coor-dinates, respectively. These translation parameters can be deter-mined from one or more sets of image coordinates (lands) and object-space coordinates (φ, λ, andh).
2.3 Residual Equations Using Multi-temporal Triplet Im-ages
Each set of triplet images has six residual equations. It is as-sumed thatnsets are available. The six residuals are expressed by Equation (12). the forward, nadir, and backward directions, respectively. The residual equations are derived by using Equation (12).
vall=Gall∆+dall; P (13)
Here,P denotes the image measurement precision, and
withAi,jandBi,j(i = 1,· · ·, n, j = F, N, B)as translations applied to the line and samples in theith set of imagej.
Then, the function of the sum of squared residuals is defined as
minvallTP vall. (17)
Finally,∆is derived by solving Equation (17).
∆= (GallT P Gall)−
1
GallTP dall (18)
3. EXPERIMENTS 3.1 Study Areas and Data Used
We selected Saitama, north of Tokyo, Japan, because five sets of ALOS/PRISM triplet images (Level 1B1) were available. The acquisition dates are 31 Oct 2006 (T1), 31 Jan 2007 (T2), 3 May
2007 (T3), 24 Dec 2009 (T4), and 27 Dec 2010 (T5). Each image
is composed of four subimages acquired by different CCD units. The CCD-unit-based RPC and 39 ground points were provided by the Japan Aerospace Exploration Agency (JAXA). From among the 39 ground points, 4 were used as ground control points to de-termineAi,jandBi,j(i= 1,· · ·, n, j=F, N, B). The other 35 points were used as checkpoints (CKPs) to assess geolocational errors.
3.2 Results
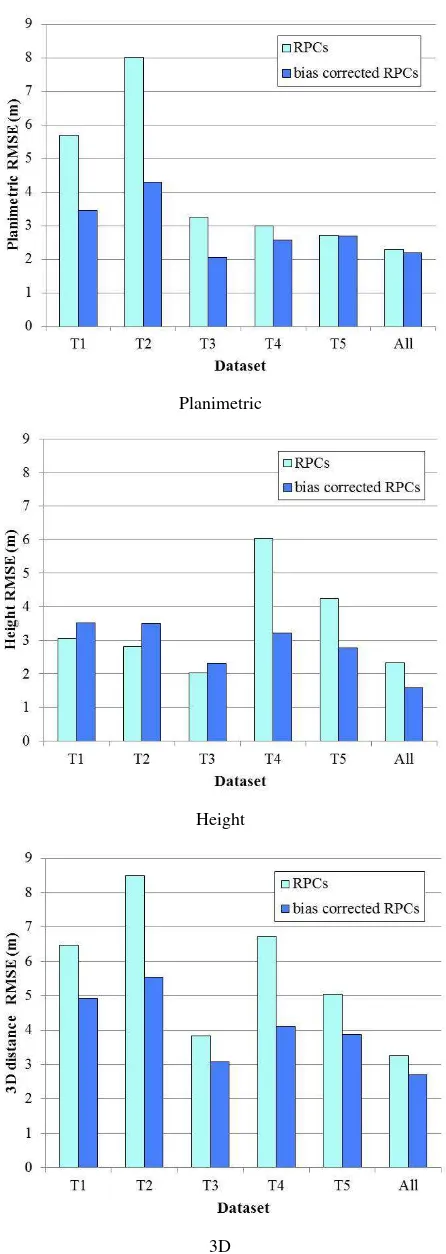
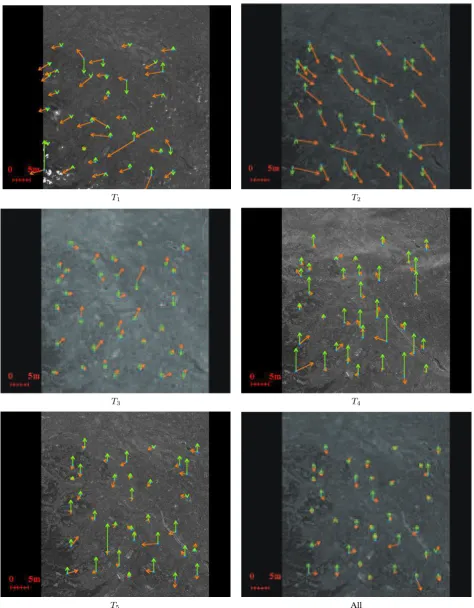
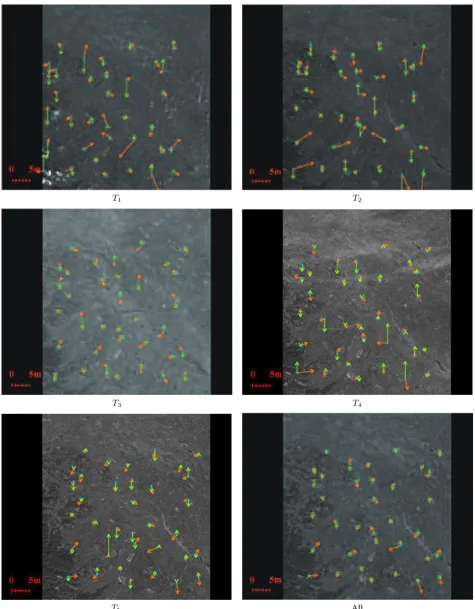
We estimated the object coordinates of 35 CKPs from image co-ordinates in two different ways: using individual triplet images separately, and using five triplet images simultaneously. The RM-SEs for planimetric position, height, and 3D position were calcu-lated. Figure 1 shows the planimetric and height errors of CKPs on images, obtained by applying the standard RPC model without bias correction. Figure 2 shows the corresponding results with bias correction. Figure 3 shows the planimetric, height and 3D RMSEs of the two RPC models. Tables 1 and 2 show the RMSEs and maximum errors of the results obtained by using the standard RPC model and the bias-corrected RPC model, respectively.
4. DISCUSSION
4.1 Estimates Using Multi-temporal Triplet Images Figure 3 and Tables 1 and 2 show that the accuracies of the re-sults obtained by using multi-temporal triplet images are better than those obtained by using triplet images individually in most cases. The theory of the least-squares method (LSM) indicates that increasing the number of observations will result in more pre-cise estimates so long as systematic errors are removed and only unbiased random errors are left. The results shown in Figure 3 and Tables 1 and 2 suggest that LSM is appropriate for this ap-plication, and Figures 1 and 2 demonstrate that large errors may be excluded by solving through LSM. In addition, the maximum planimetric, height, and 3D errors in Tables 1 and 2 were much reduced by the use of multi-temporal triplet images.
We also examined the dependency of geolocational errors on to-pography. According to Figures 1 and 2, planimetric and height errors in hilly areas are not notably larger than those in flat areas. When we applied the standard and bias-corrected RPC models to another area, Osaka, in the western part of Japan, the results were also independent of topography. These results support the conclusion that the RPC model is robust to topographic effects.
Planimetric
Height
3D
T1 T2
T3 T4
T5 All
T1 T2
T3 T4
T5 All
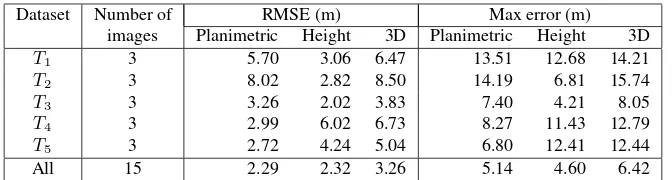
Dataset Number of RMSE (m) Max error (m) images Planimetric Height 3D Planimetric Height 3D
T1 3 5.70 3.06 6.47 13.51 12.68 14.21
T2 3 8.02 2.82 8.50 14.19 6.81 15.74
T3 3 3.26 2.02 3.83 7.40 4.21 8.05
T4 3 2.99 6.02 6.73 8.27 11.43 12.79
T5 3 2.72 4.24 5.04 6.80 12.41 12.44
All 15 2.29 2.32 3.26 5.14 4.60 6.42
Table 1. Accuracy of object coordinates estimated by using the standard RPC model without bias correction
Dataset Number of RMSE (m) Max error (m)
images Planimetric Height 3D Planimetric Height 3D
T1 3 3.46 3.51 4.93 9.66 7.38 9.88
T2 3 4.29 3.49 5.53 10.41 8.37 11.16
T3 3 2.04 2.30 3.08 3.72 4.95 5.32
T4 3 2.58 3.21 4.12 7.37 8.27 9.45
T5 3 2.70 2.78 3.87 5.55 9.22 9.28
All 15 2.19 1.59 2.71 5.36 3.14 5.58
Table 2. Accuracy of object coordinates estimated by using the bias-corrected RPC model
Dataset RMSE (m) Max error (m)
Planimetric Height 3D Planimetric Height 3D
All 2.16 1.58 2.67 5.36 3.14 5.58
Table 3. Accuracy of object coordinates estimated by using the bias-corrected RPC model followed by removing outliers and re-calculating
4.2 Effect and Detection of Land Deformation
The proposed method uses multi-temporal triplet images acquired during a certain period to estimate object coordinates. The es-timated coordinates are assumed to be fixed throughout the pe-riod. This indicates that the proposed method implicitly assumes that no land deformation has occurred during the period. In most cases, this assumption is likely to be acceptable. However, sup-pose that we analyze data from an area where land deformation has occurred. The proposed method estimates the fixed object coordinates of a point of interest. When we examine the plani-metric and height residuals, the directions of the residuals may be significantly different from before to after deformation. We expect that such analysis of residuals can be used to discriminate whether land deformation has taken place during the period of data acquisition. In the future, we intend to report the results of such an approach by applying the method to areas where land deformation occurred.
4.3 Bias Correction
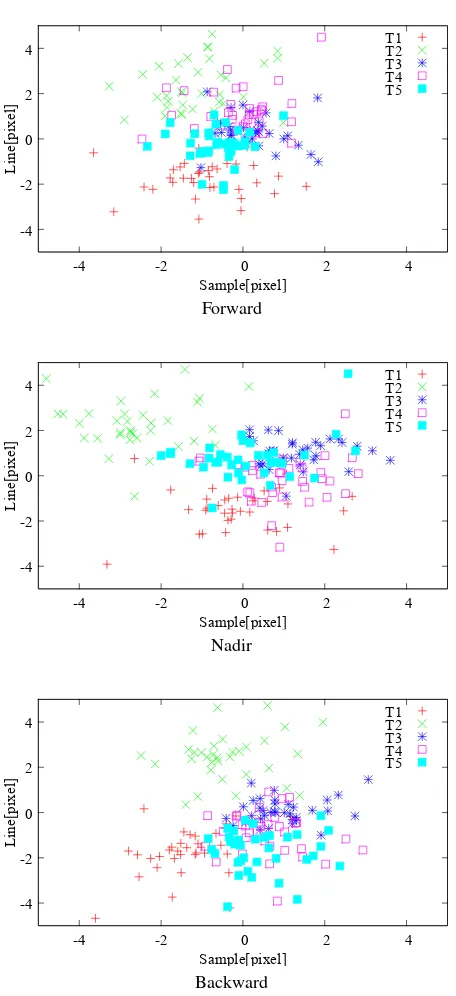
Figures 1 and 2 and Tables 1 and 2 show the significant difference in errors between the standard RPC model and the bias-corrected RPC model. As a reference, scattergrams of errors of coordinates estimated by using the standard RPC model without bias correc-tion are shown in Figure 4. In general, the results using the stan-dard RPC model show systematic errors, that is, the directions of the errors are similar. However, in this experiment, no signif-icantly clear direction was found. Figure 4 shows thatT2 in all
directions (forward, nadir, and backward) andT5in the backward
direction have large systematic errors. Even when systematic er-rors are observed, the bias-corrected RPC model contributed to improving the accuracies of the estimated object coordinates.
Instead of Equations (1) and (2), Fraser et al. (2006) proposed a practical bias-compensation approach based on affine transfor-mation. The results of applying affine bias correction to the im-ages used in this research were almost same as those obtained by using Equations (1) and (2). Therefore, we selected the sim-pler transformation expressed by Equations (1) and (2) in this research. However, the similarity of results may not always hold; they could, for example, be dependent on the sensor and its cali-bration.
4.4 Outlier Removal
We extended the proposed method to remove outliers from the observations. First, the bias-corrected RPC model was applied and the residuals between observed image coordinates and esti-mated image coordinates were calculated. The planimetric image residuals were thereby obtained. Then, outliers with planimet-ric residuals larger than a designated threshold were removed. Finally, the bias-corrected RPC model was applied to the unre-moved observations. Table 3 shows the results obtained by using this approach with a 5-pixel threshold. The results were almost the same as those in Table 2. In general, such approaches to recal-culate after removing outliers are effective at improving accuracy. In the future, we intend to examine approaches for achieving even higher accuracy.
5. CONCLUSIONS
-4 -2 0 2 4
-4 -2 0 2 4
L
ine
[pi
xe
l]
Sample[pixel]
T1 T2 T3 T4 T5
Forward
-4 -2 0 2 4
-4 -2 0 2 4
L
ine
[pi
xe
l]
Sample[pixel]
T1 T2 T3 T4 T5
Nadir
-4 -2 0 2 4
-4 -2 0 2 4
L
ine
[pi
xe
l]
Sample[pixel]
T1 T2 T3 T4 T5
Backward
Figure 4. Scattergram of errors of image coordinates estimated by using the standard RPC model without bias correction
method can generate estimates by LSM. Experimental results for five sets of PRISM triplet images showed that the planimetric and height errors of the coordinates estimated by using multi-temporal triplet images were 3.26 m and 2.71 m, respectively, and that they were smaller than those generated by using each set of triplet images alone. These results are better than those achieved by stacking and mosaicking multi-temporal DSMs (Tadono et al., 2014). In the future, we intend to apply the proposed method to other areas and to generate PRISM-driven DSMs that are more accurate than the existing DSMs.
ACKNOWLEDGEMENTS
This research was supported by a Grant-in-Aid for Scientific Re-search (KAKENHI) for Young Scientists (B) (No. 22760393) and by a program of the Fourth Advanced Land Observing Satellite-2 Research Announcement, Japanese Aerospace Exploration Agency. The authors express thanks to Dr. Takeo Tadono of JAXA for valuable advice about assessing the results obtained in this re-search.
REFERENCES
Bouillon, A., Bernard, M., Gigord, P., Orsoni, A., Rudowski, V. and Baudoin, A., 2006. SPOT 5 HRS geometric performance: Using block adjustment as a key issue to improve quality of DEM generation. ISPRS J. Photogram. Remote Sens., pp. 60, 134 -146.
Giribabu, D., Rao, S.S. and Murthy, Y.V.N.K., 2013. Improving Cartosat-1 DEM accuracy using synthetic stereo pair and triplet.
ISPRS J. Photogram. Remote Sens., 77, pp. 31 - 43.
Gorokhovich, Y. and Voustianiouk, A., 2006. Accuracy assess-ment of the processed SRTM-based elevation data by CGIAR using field data from USA and Thailand and its relation to the terrain characteristics. Remote Sens. Enviorn., 104, pp. 409 -415.
Grodecki, J. and Dial, G., 2003. Block adjustment of high-resolution satellite images described by rational polynomials. Photogram. Eng. & Remote Sens., 69, pp. 59 - 68.
Fraser, C.S., Baltsavias, E., and Gruen, A., 2002. Processing of Ikonos imagery for submetre 3D positioning and building extrac-tion.ISPRS J. Photogram. Remote Sens., 56, pp. 177 - 194.
Fraser, C.S., Dial, G., and Grodecki, J., 2006. Sensor orientation via RPCs.ISPRS J. Photogram. Remote Sens., 60, pp. 182 - 194.
Fujisada, H., Urai, M. and Iwasaki, A., 2011. Advanved method-ology for ASTER DEM generation.IEEE Trans. Geosci. Remote Sens., 49, pp. 5080 - 5091.
Rodr´ıguez, E., Morris, C.S. and Belz, J.E., 2006. A global as-sessment of the SRTM performance.Photogram. Eng. & Remote Sens., 72, pp. 249 - 260.
Schwind, P., Schneider, M., Palubinskas, G., Storch, T., M¨uller, R. and Richter, R., 2009. Processors for ALOS optical data: Deconvolution, DEM generation, orthorectification, and atmo-spheric correction. IEEE Trans. Geosci. Remote Sens., 47, pp. 4074 - 4082.
PRISM.ISPRS Annals Photogram. Remote Sens. Spatial Info. Sci., II-4.
Takaku, J. and Tadono, T., 2009. PRISM on-orbit geometric cal-ibration and DSM performance. IEEE Trans. Geosci. Remote Sens., 47, pp. 4060 - 4073.
Zhang, L. and Gruen, A., 2006. Multi-image matching for DSM generation from IKONOS imagery.ISPRS J. Photogram. Remote Sens., 60, pp. 182 - 194.
Zhu, Q., Wu, B. and Tian, Y., 2007. Propagation strategies for stereo image matching based on the dynamic triangle constraint.