WYSIWYG GEOPROCESSING: COUPLING SENSOR WEB AND GEOPROCESSING
SERVICES IN VIRTUAL GLOBES
Xi Zhai, Jianya Gong, Peng Yue, Ziheng Sun, Xianchang Lu
State Key Laboratory of Information Engineering in Surveying, Mapping and Remote Sensing, Wuhan University, 129 Luoyu Road, Wuhan 430079, China
Email: [email protected], [email protected], [email protected], [email protected], [email protected] Commission
Commission IV, WG IV/4
KEYWORDS: WYSIWYG, Virtual Globe, Sensor Web, Geoprocessing, Web Service, GIS
ABSTRACT:
We propose to advance the scientific understanding and applications of geospatial data by coupling Sensor Web and Geoprocessing Services in Virtual Globes for higher-education teaching and research. The vision is the concept of “What You See is What You Get” geoprocessing, shortly known as WYSIWYG geoprocessing. Virtual Globes offer tremendous opportunities, such as providing a learning tool to help educational users and researchers digest global-scale geospatial information about the world, and acting as WYSIWYG platforms, where domain experts can see what their fingertips act in an interactive three-dimensional virtual environment. In the meantime, Sensor Web and Web Service technologies make a large amount of Earth observing sensors and geoprocessing functionalities easily accessible to educational users and researchers like their local resources. Coupling Sensor Web and geoprocessing Services in Virtual Globes will bring a virtual learning and research environment to the desktops of students and professors, empowering them with WYSIWYG geoprocessing capabilities. The implementation combines the visualization and communication power of Virtual Globes with the on-demand data collection and analysis functionalities of Sensor Web and geoprocessing services, to help students and researchers investigate various scientific problems in an environment with natural and intuitive user experiences. The work will contribute to the scientific and educational activities of geoinformatic communities in that they will have a platform that are easily accessible and help themselves perceive world space and perform live geoscientific processes.
1.INTRODUCTION
With the advancement of Earth observing and sensing technologies, the geospatial data is increasingly rich and accessible in real-time or near-real-time ways. Often, these data have to be transformed into user-specific information and knowledge through geoprocessing methods. In order to help geospatial users analysis these data in an environment with natural and intuitive user experiences, this work proposes the concept of “What You See is What You Get” geoprocessing, shortly known as WYSIWYG geoprocessing, by coupling Sensor Web and geoprocessing Services in Virtual Globes.
Virtual Globes bring the globe-scale geospatial information into our desktop. They fuse heterogeneous geospatial data from multiple sources, and allow users to add annotations and share data with others. The wide popularity of Virtual Globe software such as Google Earth, Microsoft Virtual Earth, and NASA World Wind offers tremendous opportunities, such as providing a learning tool to help educational users digest global-scale geospatial information about the world, and acting as WYSIWYG platforms, where domain experts can see what their fingertips act in an interactive three-dimensional (3D) virtual environment.
While educational and scientific users enjoy the three dimensional visualization provided by Virtual Globes, they also need geoprocessing functions to help investigate geospatial pr-oblems beyond the straightforward visualization. Geoprocessi-ng services make a large amount of geoprocessiGeoprocessi-ng functionalit-ies easily accessible to users. The integration of Virtual Globes
and interoperable geospatial Web Services extends the current capabilities of Virtual Globes, by focusing primarily on enabling higher-education teaching and scientific research with its heavy analysis demands, as opposed to focusing initially on visualization and annotation (Yue et al., 2010).
The emergence of Sensor Web technologies allows on-demand provision of real-time or near-real-time geospatial data, and enables the discovery of sensor observations and tasking of sensor systems (Botts et al., 2006). To support the interoperability in the Sensor Web, the Open Geospatial Consortium (OGC) has developed a series of standard specifications, such as Sensor Observation Service (SOS) and Sensor Planning Service (SPS). Using data published by the Sensor Web, geoprocessing services can provide live decision support (ISW, 2011).
Although we have seen some preliminary work on the combination of Virtual Globe and geoprocessing services (Yue et al., 2010), the integration of Sensor Web and geoprocessing services (ISW, 2011), and the visualization of sensor data in Virtual Globe (52north, 2011), an integration of all three technologies is not available yet. Coupling Sensor Web and geoprocessing Services in Virtual Globes will bring a virtual learning and research environment to the desktops of students and professors, empowering them with WYSIWYG geoprocessing capabilities.
paper, it denotes that you see what you plan, including but not limited to the following capabilities:
(1) Sensor planning, which allow users to make plans on sensor observations interactively in Virtual Globes.
(2) Geospatial analysis, where users can design geoprocessing workflows in an interactive online environment using geoprocessing services available in Virtual Globes, and view geoprocessing results in Virtual Globes.
(3) Live geoprocessing, where sensor observation and geospatial analysis are connected together for real-time or near-real-time geoprocessing.
The implementation combines the visualization and communication power of Virtual Globes with the on-demand data collection and analysis functionalities of Sensor Web and geoprocessing services, to help students and researchers investigate various scientific problems in a natural and intuitive environment. The work will contribute to the scientific and educational activities of geoinformatic communities in that they will have a platform that are easily accessible and help themselves perceive world space and perform geoscientific processes. The results will be tested in NASA World Wind system. We are also interested in testing the developed technology in other Virtual Globe software. The reminder of this paper is organized as follows: Section 2 presents the
approaches; Section 3 describes the system implementation and ongoing work; Conclusions and pointers to future work are given in Section 4.
2.APPROACHES
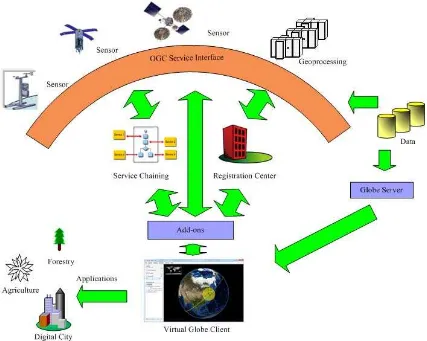
The goal is to couple Sensor Web and geoprocessing services and make them taskable, discoverable, and chainable in the interactive three-dimensional virtual environment provided by Virtual Globes. As shown in Figure 1, to achieve this goal, the first step is to make sensors, geoprocessing functions, and geospatial data accessible in the standard-compliant way. One solution is to adopt the OGC Web data service protocols such as Web Feature Service (WFS), Web Map Service (WMS), Web Coverage Service (WCS), Web geoprocessing service protocols such as Web Processing Service (WPS), and Sensor Web service protocols such as SOS, SPS, Sensor Alert Service (SAS), and Web Notification Service (WNS). The standards ensure plug-and-play of geospatial services provided by different vendors. On the other hand, the geospatial data can be organized in the tiling structure on the server side of Virtual Globes, so that clients of Virtual Globes can download and cache data progressively, thus achieving high efficiency in visualization.
The second step is to make sensors, data, and services discoverable. This requires a registration center in the network environment, in which the metadata for sensors, data, and services are published and used for resource discovery. The establishment of a registration center can use the geospatial catalogue service standard developed by OGC, which specifies the metadata information model for organization of metadata and standard interface and protocols for publishing and discovering geospatial resources.
The third step is to enable the chaining of sensors observations and geoprocessing services to provide live analyses. The OGC Abstract Service architecture (Percivall, 2002) identifies three types of service chaining: user-defined (transparent), workflow-managed (translucent), and aggreg-ate (opaque). To assist users in designing service chains interactively, a geoscientific workflow designer can be
provided.
The previous three steps follow the publish-find-bind paradigm in the Service-Oriented Architecture (SOA). The fourth step is to provide an integrated client, which can allow users to discover, bind, invoke, and chain those standards-based interoperable services. These different functions can be plugged into clients of Virtual Globes as add-ons to expose the WYSIWYG geoprocessing. A basic workflow for geoprocessing includes sensor planning for observations, geoprocessing for driving high-level data products, and results visualization. As shown in Figure 2, in WYSIWYG geoprocessing, data, sensor, and geoprocessing services can be discovered in Virtual Globes. The clients of Virtual Globes will interact with geospatial Web services for sensor planning, live geoprocessing, and visualization of final data products.
Figure 2. WYSIWYG geoprocessing
3.IMPLEMENTATION
The implementation includes three major parts: a geoscientific workflow designer to support service chaining, a catalogue service acting as a registration center, and a Virtual Globe client.
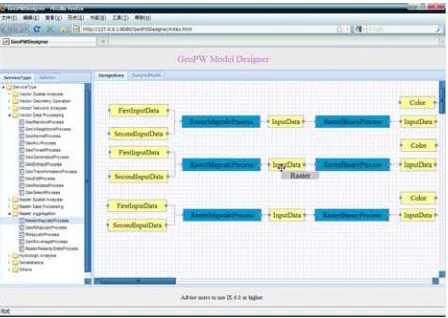
3.1. Geoscientific workflow designer
An online geoscientific workflow designer has been developed using Asynchronous JavaScript and XML (AJAX) technology (Sun and Yue, 2010). The design of the tool follows a three-phase procedure for service composition:
(a) process modeling, which generates a composite process model consisting of the control flow and data flow among atomic processes;
(b) process model instantiation, where the abstract process is instantiated into a concrete service chain;
(c) workflow execution, where the chaining result is
Figure 3 illustrates an example of a geoprocessing workflow for a flooding analysis. Atomic process models on the left column of the palette can be dragged manually to the right panel. Different process models can be composed using data flow and control flow links to generate a composite process model. The process model can be transformed into a service chain composed of interoperable geoprocessing services. The chaining result is executed by a workflow engine using the Web Services Business Process Execution Language (shortly known as BPEL) (Sun and Yue, 2010). Since the current implementation cannot support the Sensor Web services, future work will extend it to support live geoprocessing workflow.
3.2. Catalogue service
A catalog service is implemented, which can record the metadata of sensors, services and data. The implementation is based on an open source software for ebRIM implementation, Omar. A catalogue interface is provided for Omar registiry. The catalogue can be used for registration of sensors, services and data. The registration information model in the catalogue is based on extensions to the ebRIM model.
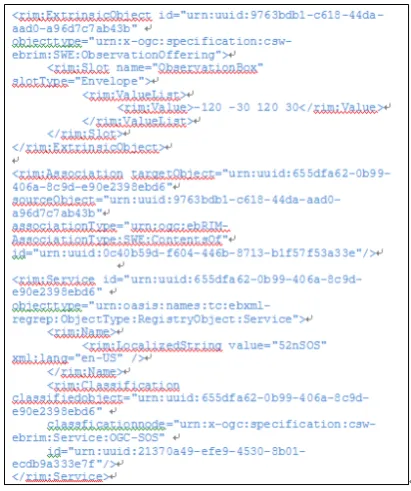
Figure 4. The association between a sensor observation service and its ObservationOffering
The ebRIM can be extended in two ways. The first is deriving new metadata classes from the existing ebRIM classes. And the second way is to add new slots to the existing classes in ebRIM. Some work has been devoted on registration of sensorML in ebRIM (Houbie et al., 2010). More extensions for registration of sensor services and observations are added in the implementation of our work. For the registration of geospatial data, new Data classes are derived from the existing ExtrinsicObject class, with new slots added. The existing Service class of ebRIM is used for registration of geospatial services. New classification nodes such as SOS are added to classify these servcies. Figure 4 illustrates an example of using ebRIM association to associate the sensor observation service and observations that the service offers. All metadata are stored in Postgresql database. The query uses Common Query Language (CQL). In addition, a set of Adhoc Queries (i.e.
predefined SQL queries), designed specifically for discovery of sensors and services, are developed.
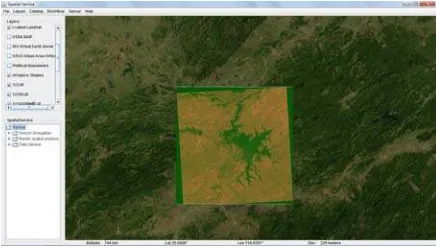
Figure 5. CSW query in an Virtual Globe Client
Figure 5 shows the interaction between Virtual Globe and CSW. It demonstrates the discovery interface of sensors in the World Wind client. The query filters include the sensor names, types, keywords. Spatial filters on sensor location or observation coverage can also be included. The query results can be visualized using a WebBrowser control in a dialog. The development is still going on, and visualization of metadata from query results will also be added in Virtual Globe.
3.3. Virtual Globe client
The ongoing implementation on the interaction with Sensor Web and geoprocessing services from Virtual Globe client includes four parts: sensor visualization and planning, data access, geoprocessing, and results visualization.
The types of sensors are versatile. Among them, the number of satellites flying in orbit is around 950. The current implementation takes the satellite sensors as an example. The process for satellite visualization consists of visualization for satellite 3D model and orbit. The orbit is static, while the position for the 3D model of the satellite is changed dynamically according to the time and plan.
Figure 6. Satellite visualization
Visualization for the movement of satellite can be divided into two steps:
(1) Calculating satellite coordinates (i.e., satellite longitude, latitude, and elevation). based on the Twolinemean element (TLE) of orbital parameters;
ide
An existing application (JSatTrak, 2011) on satellite ntified by satellite coordinates derived in the first step. The update of satellite coordinates will cause the movement of satellite models.
visualization is reused, and incorporated into our framework, as shown in Figure 6.
Figure 7. Satellites planning
ensor planning analysis can be performed in Virtual Globes as
sers identify the area of interests, and check the mo
s based on the sensor vis
bservation is rea
results in Virtual Globes.
The sensor observations can be accessed through SOS. Other S
follows: (1) U
vement and coverage of satellites. (2) Users make observation plan
ualization in Virtual Globes. Figure 7 shows a scenario of planning on three satellites, located in the corners of the cube. Users can edit the cube to change the location of satellites.
(3) Users submit observation tasks to the SPS. (4) Users are notified by WNS that sensor o dy in one SOS.
(5) Users check the observation
geospatial data can be accessed either through the OGC standards-compliant data service interfaces, or they can be organized in the Virtual Globe servers. The data in the latter approach is intended for high efficient visualization only, and only supports limited analysis. Geoprocessing services and service chains are invoked using dialogues. The invocation dialogues are generated automatically based on the service descriptions. Users can select input from OGC data services or add new input by themselves.
Figure 8. The geoprocessing results loaded in World Wind
ML is selected as the mechanism for results visualization.
he work is still going on and the final deliverables will
designer, which can su
e service, which is tailored to the Se
in, which can be used for sensor pl
4.CONCLUSIONS AND FUTURE WORK
The results of this research will be an analysis-enhanced
esults of this work can be exercised in existing courses as an
5.ACKNOWLEDGEMENTS
This work is supported by National Basic Research Program of
REFERENCES
52north, 2011. Integration of Sensor Data in NASA
K
The geoprocessing results are wrapped as KML and downloaded by clients of Virtual Globes (Figure 8). The World
Wind can parse KML and load data into the globes.
T
include the following open source tools: (1) An online geoscientific workflow pport live geoprocessing;
(2) A geospatial catalogu nsor Web environment; (3) World Wind Plug anning and information analysis.
Virtual Globe for globe geospatial information sharing, visualization, and live analysis. The system will make it much easier and faster for students to learn and perceive geospatial world, concepts and processes. The researchers can investigate a wide range of geospatial problems through the large-scale geospatial data and analysis functions provided by geospatial Web services distributed at worldwide locations. The incorporation of Sensor Web technologies can support real-time data collection and live geoprocessing.
R
experiment in the validity and potential of in-classroom use. It can be used to demonstrate how multi-source and real-time data can be easily accessible and processable in teaching, research, and live decision support, through Virtual Globes, Sensor Web, and geospatial Web Services.
China (2011CB707105), Project 40801153 and 41023001 supported by NSFC, LIESMARS and SKLSE (Wuhan University) Special Research Funding.
Worldwind,http://52north.org/communities/sensorweb/demos.h tml, (Accessed 28 April, 2011).
Botts, M., Robin, A., Davidson, J., Simonis, I., 2006. OGC
Houbie, F., Skivée, F., Jirka, S, 2010. OGC® Catalogue
ISW, 2011. Integrating Sensor Web and Web-based Sensor Web Enablement Architecture Document. OGC 06-021r1, Version: 1.0, Open Geospatial Consortium (2006). 69 pp.
Services Specification 2.0 Extension Package for ebRIM Application Profile : SensorML. OGC 09-163r2, Version: 0.3.0, Open Geospatial Consortium. 76 pp.
Geoprocessing, ISW Workshop at AGILE 2011 conference, 18th April 2011, Utrecht, the Netherlands., http://swsl.uni-muenster.de/isw-workshop/, (Accessed 28 April, 2011).
JSatTrak, 2011. Java Satellite Tracker by Shawn Gano,
http://www.gano.name/shawn/JSatTrak/, (Accessed 26 May,
2011).
topic 12: OpenGIS service architecture. Version 4.3. OGC 02-112. Open Geospatial Consortium, Inc., 78 pp.
Web 2.0 and eoprocessing Services to support Geoscientific Workflows, In:
ikipedia,2011.http://en.wikipedia.org/wiki/WYSIWYG
Sun, Z., and Yue, P., 2010. The Use of G
Proceedings of the 18th International Conference on Geoinformatics (Geoinformatics 2010), IEEE publication, 5 pp, 2010.
W ,
ue, P., Gong, J., Xiang, L., Chen, J., 2010a. Analysis-(Accessed 2 April, 2011).
Y