FULL WAVEFORM LIDAR EXPLOITATION TECHNIQUE AND ITS EVALUATION IN
THE MIXED FOREST HILLY REGION
S. Chhatkuli a, *, K. Mano b, T. Kogure a, K. Tachibana a, H. Shimamura a
a
PASCO CORPORATION, R & D Center, 2-8-11 Higashiyama, Meguro Ku, Tokyo, Japan (cshahb7460, teorsu8478,
kainka9209, hairdu9189)@pasco.co.jp
b
PASCO CORPORATION, MMS Division, 1-2-3 Minatomachi, Naniwa-ku, Osaka, Japan,
[email protected]Commission VII, Theme Session VII/7, III/2, V/3
KEY WORDS: LIDAR, Analysis, DEM/DTM, Point Cloud, Accuracy
ABSTRACT:
In this paper a full waveform exploitation technique and its evaluation in the mixed forest hilly region is presented. The increment in ground penetration by using the full waveform exploitation technique compared to the discrete LiDAR pulses during autumn and winter season is evaluated. The results showed that the technique used for the full waveform exploitation has effectively increased the ground penetration by 50 % and 20 %, respectively, during autumn and winter in the mixed forest hilly region compared to the discrete return pulses. The accuracy test of the LiDAR derived terrain model constructed from the discrete LiDAR pulses and full waveform LiDAR pulses obtained during autumn and winter has also been performed. The RMSE of the LiDAR derived DTM with 1m grid size constructed from the discrete LiDAR pulses obtained during autumn and winter were 0.73 m and 0.22 m respectively. Likewise, the RMSE of the LiDAR derived DTM constructed from the full waveform LiDAR pulses obtained during autumn and winter were 0.59 m and 0.21 m respectively. The results also showed that by using full waveform return pulses, DTM constructed for both seasons were improved compared to the DTM generated from discrete LiDAR pulses.
* Corresponding author.
1. INTRODUCTION
Recently, LiDAR systems that digitize and record entire echo waveform are increasingly available. By suitably exploiting the full waveform return pulses, very weak or buried signals that were not recorded as discrete return pulses could also be detected.
The data collected as discrete return pulses during leaf-on condition may be ideal for determining canopy elevation but not ground elevation. Conversely, discrete laser pulses during leaf-off condition may not provide good estimate of canopy height (Hodgson et.al, 2003).
Chauve et.al., (2008) performed the processing of full waveform LiDAR data to extract forest parameters and DTM. They found that detecting weak echoes, when processing full waveform data, enabled to better describe the canopy shape and penetrate deeper into the forest cover compared to discrete return pulses. However, DTM was not significantly improved. Reitberger et.al., (2008) found that the tree shape is better detected by the full waveform data compared to discrete return pulses and it could also detect small trees in the lower forest layer. Pirotti (2011) presented the review of existing methods for processing full waveform LiDAR data for the estimation of forest parameters. Depending on the full waveform exploitation technique, certain models were applicable at either the plot or regional level, and some methods were influenced by leaf-off/leaf-on condition.
This paper presents a robust full waveform exploitation technique which can effectively increase the ground penetration and vegetation detection even during leaf on condition. For the practical application of the full waveform exploitation technique, objective analysis of total increment in ground detection and the validation of its accuracy are very important. Hence, the accuracy evaluation of the ground penetration from the proposed full waveform exploitation technique and discrete return pulses is also carried out. The total increment in ground penetration by using the proposed full waveform exploitation technique against the discrete return pulses has been analyzed for the mixed forest hilly region. The analysis is performed for autumn (September) and winter (December) to investigate the changes in ground penetration due to the seasonal variation in the forest condition as well.
2. MATERIALS AND METHOD
LiDAR survey was performed in the Ogawa region Japan, which is located about 150 km north of Tokyo, on September 29 and December 5, 2010. Figure 1 shows the orthophoto of the area that has been demarcated for the analysis purpose. The demarcated area is about 2km in length and 0.3km in width. The study area is a mixed forest hilly region containing patches of evergreen trees (E) like Japanese red pine trees, Japanese cedar trees, Japanese cypress trees and deciduous trees (D) like Japanese beech trees and Japanese chestnut trees among other varieties.
Data acquisition was performed by using Leica’s ALS60 sensor with WDM65, mounted onboard a Cessna aircraft. WDM65 records the complete waveform of the reflection from the surface intercepting the laser footprint. The full waveform data was collected as 256 samples @ 1ns. Field of View (FOV) of the scanner was set at 28 degrees, scan rate was set at 33.7 Hz and laser pulse rate used was 54000 Hz. The data acquisition was conducted by flying the aircraft at an altitude of 2491 m from the mean sea level. The terrain height of the area varied from 439 m to 790 m. The average point density of the transmitted pulse was 1point/sq.m.
A computer program was developed to generate georeferenced point data from the full waveform return pulses. The point cloud generation algorithm implemented in our approach is explained below with an illustration of a typical case.
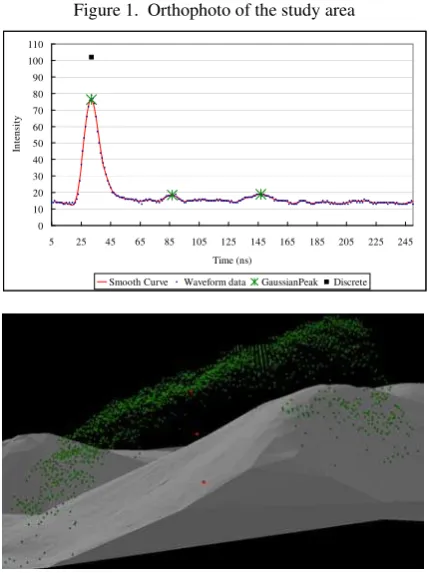
(1) Discrete return pulse (black square dot) and the corresponding waveform data for the laser pulse are depicted in Figure 2 (top). The blue dots in the top image in Figure 2 are full waveform data plotted against time. As seen in the figure, the full waveform data are generally embedded with noise generated from the variety of sources. Hence, a 12 order Finite-duration Impulse Response (FIR) zero-phase digital filter technique was applied to smooth the waveform and to reduce the noise for the further analysis. For a 12 order FIR filter (Figure 3), the output is a weighted sum of the current and a finite number of previous values of the input as described in equation 1.
The red curve in Figure 2 (top) is the smooth waveform data obtained after the processing. The smooth waveform obtained from this technique preserves peak position, pulse width and skew of the laser reflection (Wong and Antoniou, 1994).
(2) After the waveform smoothening, the next step is to distinguish the noise from the actual return intensity. For that purpose, we selected a threshold and assumed all the reflection below the given threshold as noise and excluded those values for further processing. This is a very straight forward approach and computationally very efficient. Two threshold values of intensity 16 and 17 were tested. When the threshold was set at 16, in some cases the points below ground level under the tree canopies were also generated. However with threshold 17, the last return peak of the waveform corresponds very well with the ground position level, under the tree canopies. Hence for the surveyed region, all the waveform return intensity below 17 was assumed noise and considered their intensity to be 0.
(3) In the third step, the number of peaks and the location of the peaks in the smooth waveform data were, at first, estimated by finding the local maxima in the smooth waveform. Then an algorithm based on the Expectation Maximization (EM) (Persson et.al., 2005) was applied to correct the positions and number of the peaks by Gaussian decomposition. The crosshair symbols at the peak of the Gaussian bumps in Figure 2 (top) are the corrected peak positions estimated by the EM algorithm.
(4) Finally, the correctly estimated peak positions were georeferenced to create a point cloud data.
The bottom image in Figure 2 shows the discrete LiDAR pulses (green dots), obtained during September, overlaid on a Triangulated Irregular Network (TIN) of a bare ground constructed from the discrete LiDAR pulses obtained during December. The red dots in the image are the position data obtained by georeferencing the Gaussian peaks of the smooth waveform data, depicted by the cross hair symbols in the Figure 2 (top image). From the figure it is clear that, for the particular laser pulse, the discrete return could record only one reflection from the top canopy layer however the proposed algorithm could detect 3 reflections of which the first one corresponds to the same discrete return and the last one corresponds to the ground level.
Figure 1. Orthophoto of the study area
0
Smooth Curve Waveform data GaussianPeak Discrete
Figure 2. Top: Discrete return pulse (black square dot), raw full waveform data (blue dots), smoothened waveform (red curve) and Gaussian peaks (crosshair symbols). Bottom: Discrete return pulses (green dots), full waveform return pulses (red dots) constructed from the Gaussian peaks depicted in the top image
3. ACCURACY EVALUATION OF LIDAR DERIVED TERRAIN DATA
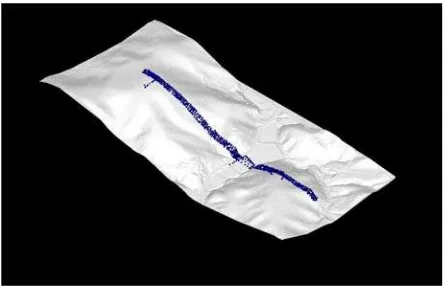
We performed a test to evaluate and to compare the vertical accuracy of LiDAR derived terrain data constructed from the discrete LiDAR pulses and the proposed full waveform exploitation technique obtained during autumn and winter. For the accuracy evaluation, a typical hilly area with varying topography covered by Japanese cedar (Sugi) trees, Japanese cypress (Hinoki) trees and other deciduous trees was selected. Ground truth data were measured by performing total station survey.
Figure 4 shows the terrain model of the site and total station surveyed check points. The check points were collected from the stripe of about 400m x 10 m area at the density of about 1pt/ 4.5 sq.m. The area was covered with both evergreen and deciduous tree varieties and the topography of the area varied from flat plane to rolling hill. The maximum slope of the test site was about 30 %.
To evaluate the accuracy of LiDAR derived ground elevation, DTM of the ground terrain with 1 m grid size was constructed from the discrete LiDAR pulses obtained during September, full waveform LiDAR pulses obtained during September, discrete LiDAR pulses obtained during December and full waveform LiDAR pulses obtained during December respectively. The elevation of the ground on each DTM that corresponds to the horizontal location of the total station surveyed check points were then calculated directly by using ArcGis’s Surface Spot tool.
The difference between measured point elevation data and LiDAR derived DTM elevations for the four cases are presented in Table 1. The RMSE between measured data and DTM data obtained by using discrete LiDAR pulses was 0.73 m during September, when deciduous trees were full of leaves. By using the full waveform exploitation technique, the DTM thus constructed showed an increase in the terrain data accuracy. The RMSE for the terrain data obtained by using full waveform LiDAR pulses was 0.59 m.
During December, when the leaves fall off from the deciduous trees, RMSE between measured data and DTM constructed by using discrete LiDAR pulses was 0.22 m. For the same winter data set, the RMSE of the terrain data obtained by using full waveform LiDAR pulses was 0.21 m.
DTM model
Table 1. Accuracy evaluation of LiDAR derived terrain data
4. RESULTS AND DISCUSSION
Point cloud generated from the discrete return pulses and full waveform return pulses along, a part of, the longitudinal section of the concerned area are compared and demonstrated in Figure 5 for autumn and winter. The white dots in Figure 5 represent discrete return pulses and yellow dots represent the full waveform return pulses. For both seasons, we can see that the point cloud generated from the full waveform return pulses increased the vegetation/canopy detection and moreover increased the ground penetration significantly.
To quantify the increment in the ground penetration, the point cloud generated from the full waveform return pulses and discrete return pulses were filtered automatically by using commercial software, TerraScan, to separate the ground points and vegetation points. The ground points obtained from the full waveform point cloud and the discrete return pulses are compared for autumn and winter respectively and presented below.
During autumn, the ground penetration by discrete LiDAR was relatively poor with large gaps or missing ground points in some of the topographically complex terrains. However, by using the full waveform exploitation technique, ground point detection was considerably increased throughout the region. Figure 3. Block diagram of FIR filter
Figure 4. TIN of terrain model and ground truth surveyed points (blue dots)
During autumn, when the deciduous trees are full of leaves, the ground points detected from the discrete LiDAR pulses in the mixed forest patch were 53139 points (1 pt/11.30 sq.m). Whereas, by exploiting the full waveform return pulses, the detection of ground point was increased by a little over 50 % to 80762 points (1pt/7.43sq.m). The accuracy validation test in the earlier section has shown that the increase in ground penetration due to the full waveform exploitation technique was able to increase the vertical accuracy (Accuracy(z)) of the DTM by 30 cm.
During winter, when most of the leaves of the deciduous trees fall off, the detection of ground penetration increased remarkably compared to the detection of ground penetration during autumn. The ground points detected by using discrete return pulses during winter, in the same patch of the mixed forest, were remarkably high at 223938 points (1pt /2.68 sq.m) Still, in winter, the full waveform return pulses increased the detection of ground points by 20 % at 270142 points (1 pt/ 2.22 sq. m). However, the accuracy((Accuracy(z))) validation test shows that the vertical accuracy of the DTM obtained during winter from both discrete LiDAR pulses and full waveform LiDAR pulses were the same at around 0.40 m.
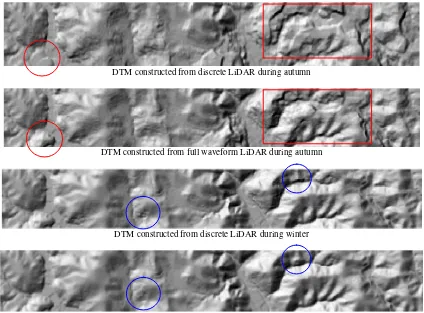
Figure 6 shows the DTM of the mixed forest hilly region. The DTM constructed from the discrete return pulses obtained during autumn was rough at places (red circle). However, by using the full waveform return pulses, for the same, considerable improvement in the smoothness and accuracy of the bare ground model was achieved.
Discrete return pulses (autumn)
Full waveform return pulses (autumn)
Discrete return pulses (winter)
Full waveform return pulses (winter)
Figure 5. Comparing discrete and full waveform return pulses
DTM constructed from discrete LiDAR during autumn
DTM constructed from full waveform LiDAR during autumn
DTM constructed from discrete LiDAR during winter
DTM constructed from full waveform LiDAR during winter
Figure 6. DTM of the study area
From the visual analysis, we can see that the DTM constructed during winter from the discrete return pulses was very smooth. However, still there were some topographically complex areas where the ground penetration was not enough to create a smooth DTM (blue circle). The smooth DTM could be obtained even at those places by using full waveform return pulses.
Naturally, the ground point detected from the full waveform return pulses obtained during winter created the smoothest and the most accurate DTM.
4. CONCLUSION
The results showed that the technique used for the full waveform exploitation has effectively increased the ground penetration by 50 % and 20%, respectively, during autumn and winter in the mixed forest hilly region compared to the discrete return pulses.
The accuracy evaluation of LiDAR derived terrain data showed that, in the hilly regions, where the ground elevation changes considerably within a short horizontal distance, increase in ground point detection, due to the full waveform point cloud during autumn significantly improved the accuracy of DTM estimation. The results showed that, during leaf on condition, by implementing the proposed full waveform exploitation technique, better estimation of bio mass together with accurate DTM generation could be achieved concurrently compared to the discrete LiDAR pulses.
During winter, when the deciduous trees shed their leaves, the vertical accuracy of DTM constructed from discrete LiDAR and full waveform LiDAR was very similar. However, still there were some topographically complex areas where the ground penetration due to discrete LiDAR pulses alone was not enough to create a smooth DTM. Still at those places, smoother DTM was obtained by using full waveform return pulses.
References:
Chauve, A., Durrieu, S., Bretar, F., Pierrot-Deseilligny, M., & Puech, W., 2007. Processing full-waveform lidar data to extract forest parameters and digital terrain model: validation in an alpine coniferous forest. In: Proceedings of ForestSat, Montpellier, France.
Hodgson, M. E., Jensen, J. R., Schmidit, L., Schill, S., & Davis, B., 2003. An evaluation of LIDAR- and IFSAR –derived digital elevation models in leaf-on conditions with USGS Level 1 and Level 2 DEMs. Remote Sensing of Environment, 84, pp. 295-308.
Persson, Å., Söderman, U., Töpel, J., & Ahlberg, s., 2005. Visualization and analysis of full-waveform airborne laser scanner data. In: ISPRS WGIII/3, III/4, V/3 Workshop “Laser scanning 2005”, Enschede, the Netherlands, pp 103-108.
Pirotti, F., 2011. Analysis of full-waveform LiDAR data for forestry applications: a review of investigation and method. iForest – Biogeoscience and Forestry, pp 100-106.
Reitberger, J., Schnörr, Cl., Heurich, M., Krzystek, P., & Stilla, U., 2008. Towards 3D mapping of forests: A comparative study with first/last pulse and full waveform lidar data. In: The
International Archives of the Photogrammetry, Remote Sensing and Spatial Information Sciences, Beijing, China, Vol. XXXVII, Part B8, pp. 1397-1403.
Wong, H., & Antoniou, A., 1994. One-dimensional signal processing techniques for airborne laser bathymetry. IEEE Transactions on Geoscience and Remote Sensing, 32, pp 35-46.
Acknowledgements
The authors would like to thank Japan forestry agency’s digital forest information development project for supporting this research.