COMPARING DATA ACQUISITION METHODOLOGIES FOR DTM PRODUCTION
Coppa U. a, Guarnieri A.b, Pirotti F. b, Tarolli P.c,Vettore A. b
a
INGV Napoli, Italy E-mail: [email protected]
bCIRGEO – Inderdepartmental Research Center in Geomatics, University of Padova, via dell’Università 16, 35020
Padova, Italy
cTESAF Department, University of Padova, via dell’Università 16, 35020 Padova, Italy
E-mail: alberto.guarnieri(francesco.pirotti,antonio.vettore, paolo.tarolli)@unipd.it
KEY WORDS: LiDAR, 3D Modelling, DTM, DSM, risk analysis
ABSTRACT:
In this paper we present the results related to several field campaigns conducted in the last three years in a small (4.4 km2) wilderness basin in Carnia, a tectonically active alpine region in northeast Italy. The study area is a typical alpine debris-flow dominated catchment where several landslides, including a significantly large one, were observed and mapped. The field survey carried out in 2007, 2008, 2009 and 2010 were focused on the large landslide of the basins and they consisted in the following steps: 1 – development of an accurate GPS network, 2 – make use of a long range Terrestrial Laser Scanner (TLS) for a detailed and local analysis of landslide movements, 3 – merge the data with an airborne LiDAR for a large scale analysis of the processes.
Preliminary analysis consist in the comparison of different high resolution Digital Terrain Models (DTMs) in order to estimate the debris volume that has been triggered during the last movements of the landslides. Achieved results show that the integration between ALS and TSL data allows to produce DTMs of limited extent, with higher quality and level of detail. Such DTMs improve the capabilities for landslides analysis and modelling with respect to the use of LiDAR data only, even in areas providing limited or difficult access for the survey activity.
1. INTRODUCTION
Areas with significant sources of loose soil and rocks sediment sources are of particular importance for slope surface stability affecting mainly the loose soil cover colluvium, such events are particularly dangerous as liable to evolve into debris flows channelled by the engravings of lower order channels, affecting roads and houses. The triggering factor is generally attributable to an extreme meteorological event that is to infiltrate in the upper layers of the soil, not disposed of as quickly in the deeper parts and less permeable or through the bedrock. The unstable material is subsequently transferred, at least in part, in the channel network and increases solid transport, influencing the temporal dynamics of the propagation of the sediment along the drainage network and also the morphology of the riverbed. The ability to identify the greater or lesser susceptibility of the slope of a river basin is thus seen to be important both to a policy of risk prevention and for a correct evaluation of the budget of the sediments at the basin scale.
2. STUDY AREA
The study site considered in this work concerns the basin Miozza located in the municipality of Ovaro, 20 km north-west of Tolmezzo (Udine Province), in the Carnia Alpine Region on the border with Austria and Slovenia. The basin covers an area of ??approximately 10.7 km2 along which the elevation ranges from 470 me 2075 m above sea level, with an average of 1244 m above sea level The slope has an average value of about 33 ° with a maximum of 77 ° found in the area of the head of the basin (figure 1). This is an area without buildings; human
presence is limited to the cattle grazing activity. The region has a climate typical of the Alps North East with short periods of drought detected mostly during the winter and summer and an average annual precipitation of more than 2000 mm. This is one of the most rainy areas of Italy. Runoff during the months of May and June is dominated by the processes of melting snow. During the most intense weather events events such as floods, debris flows and channel slope instability processes are common. The vegetation covers 94% of the study area and consists of forest of tall trees (74%), shrubs (10%), and high-altitude pasture (10%) and the remaining 6% is represented by rock formations, debris and loose soil.
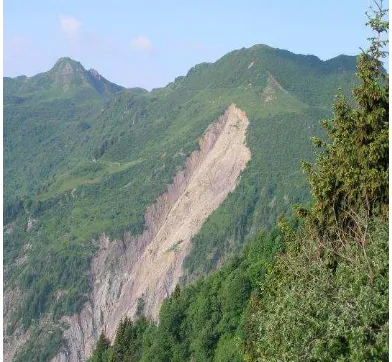
Figure 1. The body of the landslide. The International Archives of the Photogrammetry, Remote Sensing and Spatial Information Sciences, Volume XL-5/W3, 2013
The Role of Geomatics in Hydrogeological Risk, 27 – 28 February 2013, Padua, Italy
This contribution has been peer-reviewed. doi:10.5194/isprsarchives-XL-5-W3-59-2013
This basin was chosen because it represents well a number of areas subject to the processes of surface disruption, as well as having also a geographic information system containing updated data on land use, morphology, topography of the site and an information database concerning the events of recent years. In addition there have been developed, in recent years many applications of hydraulic modeling (Tarolli and Tarboton, 2006; Tarolli and Dalla Fontana, 2008). Most of the areas of instability are localized in the channel head, in particular the bigger one alone covers an extension of 22 hectares (see figure 1) which is the most active and the main source of ignition of debris-flows that propagate along the main shaft almost to the closing section of the basin.
The landslide is of considerable size, and it cuts out the top of the South-West part of the basin. The main event occurred around the months of March / April 2005, and it has mobilized a considerable amount of stone material of silt-clay matrix as a result of water from the seasonal melting of snows. The soil covered the bed of the river for several hundred meters.
3. MATERIAL AND METHODS
In November 2003, before the reactivation of the main landslide body, the whole area was monitored using LiDAR equipment. The survey was performed in snow-free conditions using a ALTM 3033 OPTECH sensor and a digital camera, Rollei H20, mounted on helicopter. A flight altitude of 1000 m acquired an average point density of 2 points/m2, recording both the first, intermediate and the last returns.
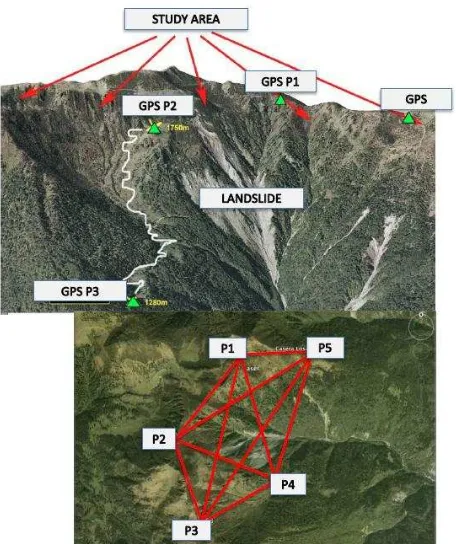
After this first survey, in 2004, there was significant movement of the landslide due to numerous events which triggered such dynamics. These changes brought to the necessity of planning a specific laser scanner survey using a Terrestrial Laser Scanner (TLS) along with a robust GPS network in order to allow having points of reference over time. In 2008 therefore a GPS network was created in stable points on the landslide, which has length of 650 m in its north-south axis and 130 m in its east-west axis. Five vertices were measured and after that the area was surveyed with a Riegl ZM620.
3.1 GPS Network
The survey with GPS for establishing the network over the landslide area was performed with dual frequency GPS. The vertices were measured in static mode, with a stop-over time of 45 minutes in three separate sessions, thereby obtaining an overabundant number of observations sufficient to perform the compensation of the network. The instrumentation used were two receivers TOPCON HiPer Pro, a Leica System 200 and a Trimble 5700.
The five vertices of the network have been materialized by steel topographic nails properly cemented into the ground or inserted in the rock to allow successive and easy localization and to prevent possible movement due to the passing of local fauna or cattle. The average distance between the vertices of the network varies between 500 m and 1.5 km.
The compensation network was done using the least squares estimation procedure, and it has provided a Standard Deviation value in the order of 2-3 mm, sufficient to monitor movements of the landslide over time.
The morphological complexity of the area has made it difficult to access the vertices of the network, whose position had been previously scheduled in the project planning of the relief.
Consequently, the GPS measurement campaign in the landslide was quite time consuming.
Figure 2. The five GPS points.
4. RESULTS
The three coordinates (N,E,h) of the five vertices used for monitoring P(1,2...5) were considered to evaluate movement of the landslide. In the following two table the coordinate
N 1 5150550,015 5150550,012 5150550,014 2 5150550,011 5150550,010 5150550,011
E 1 332000,971 332000,972 332000,969 2 332000,967 332000,970 332000,967
h 1 1876,414 1876,414 1876,414 2 1876,411 1876,411 1876,411
P2
N 1 5149607,547 5149607,549 5149607,548 2 5149607,546 5149607,547 5149607,546
E 1 331281,389 331281,386 331281,388 2 331281,386 331281,383 331281,385
h 1 1962,640 1962,642 1962,641 2 1962,641 1962,643 1962,640
P3
N 1 5148771,482 5148771,481 5148771,484 2 5148771,480 5148771,480 5148771,482
E 1 331550,312 331550,312 331550,313 2 331550,311 331550,310 331550,310
h 1 1982,293 1982,295 1982,293 2 1982,293 1982,295 1982,293 The International Archives of the Photogrammetry, Remote Sensing and Spatial Information Sciences, Volume XL-5/W3, 2013
The Role of Geomatics in Hydrogeological Risk, 27 – 28 February 2013, Padua, Italy
This contribution has been peer-reviewed. doi:10.5194/isprsarchives-XL-5-W3-59-2013
P4
N 1 5149162,421 5149162,423 5149162,420 2 5149162,420 5149162,420 5149162,420
E 1 332377,049 332377,047 332377,048 2 332377,047 332377,045 332377,046
h 1 1466,066 1466,068 1466,064 2 1466,064 1466,065 1466,060
P5
N 1 5150633,943 5150633,943 5150633,945 2 5150633,940 5150633,941 5150633,945
E 1 332827,745 332827,746 332827,744 2 332827,741 332827,742 332827,742
h 1 1654,324 1654,323 1654,322 2 1654,321 1654,320 1654,320
Table 1. GPS Coordinates over time and sessions.
S
essi
o
n YEAR
2008 2009 2010
P1 σN 1 0,020 0,030 0,030
2 0,030 0,020 0,030 σE 1 0,020 0,020 0,030 2 0,040 0,030 0,040 σh 1 0,100 0,090 0,900 2 0,090 0,090 0,000
P2 σN 1 0,020 0,020 0,030
2 0,010 0,020 0,020 σE 1 0,050 0,040 0,040 2 0,020 0,020 0,020 σh 1 0,080 0,090 0,090 2 0,070 0,090 9,980
P3 σN 1 0,030 0,020 0,030
2 0,030 0,030 0,030 σE 1 0,020 0,020 0,030 2 0,040 0,030 0,030 σh 1 0,090 0,090 0,090 2 0,070 0,080 0,080
P4 σN 1 0,050 0,040 0,040
2 0,020 0,020 0,030 σE 1 0,040 0,040 0,040 2 0,030 0,030 0,030 σh 1 0,090 0,090 0,080 2 0,090 0,080 0,090
P5 σN 1 0,020 0,020 0,020
2 0,030 0,030 0,030 σE 1 0,030 0,030 0,030 2 0,040 0,030 0,030 σh 1 0,080 0,090 0,090 2 0,090 0,090 0,090
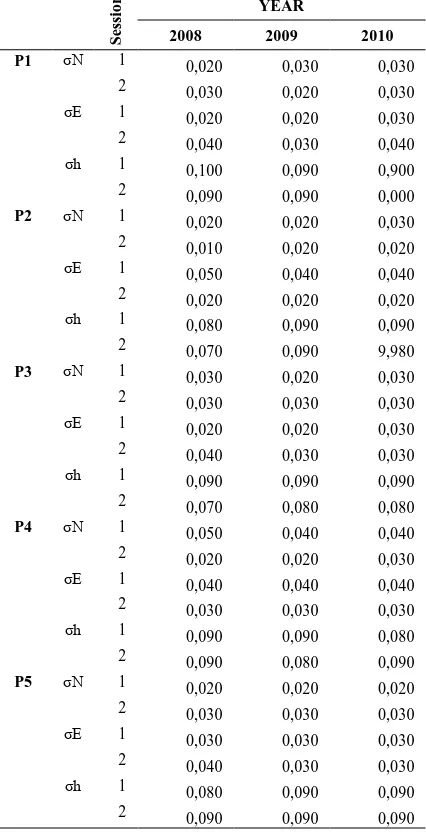
Table 2. Standard deviation of GPS measures.
Figure 3. DTM model of the area with false colors
4.1 Volumetric analysis
The first processing step on the acquired data was the removal of vegetation present in the scans acquired with the terrestrial laser using a filtering procedure semi-automatically implemented in RiSCANPRO. Within this software, the resulting point cloud was then georeferenced using the LiDAR data from the 2003 survey. In order to improve the precision of the georeferencing step using the method of orientation of known point described above, the co-registration between TLS and LiDAR data has been improved by exploiting the automatic alignment procedure (Multi-Station-Adjustment) implemented in RiSCANPRO based on ICP (Iterative Closest Point). To do this, given the wide extension of the slope surveyed with the Riegl Z620 (figure 3), we used areas of overlap between the LiDAR point cloud and the TLS point cloud consisting of points external to the main body of the landslide. The result of this operation is shown in figure 4, in which the point cloud acquired with TLS and textured images with your digital camera Nikon D200, appears correctly overlapping the LiDAR data. Subsequently, the DTM obtained from the measurements acquired with the two laser instruments (Riegl Z620 and Optech ALTM 3033) were compared with each other.
Figure 4. The area analyzed for volume differences.
The comparison showed (see figure 5) a volumetric mobilization of massive material in the upper part of the The International Archives of the Photogrammetry, Remote Sensing and Spatial Information Sciences, Volume XL-5/W3, 2013
The Role of Geomatics in Hydrogeological Risk, 27 – 28 February 2013, Padua, Italy
This contribution has been peer-reviewed. doi:10.5194/isprsarchives-XL-5-W3-59-2013
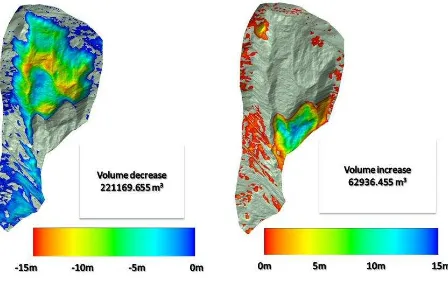
landslide (about 221 000 m³) and a partial deposition in the lower areas (around 63000 m³), as shown in Figure 5. The values obtained are in agreement with results as shown in previous studies conducted in the same area through the comparison between DEM derivatives, however, only measures from ALS (Barbarella et al., 2009; Massari et al., 2007) acquired also in this case before and after the event landslide.
Figure 5. The volume differences.
5. CONCLUSIONS
The results obtained from these applications show the high potential of the use of terrestrial laser scanning technology for the recovery of three-dimensional models useful for the monitoring of slopes subjected to hydro-geological instability. The work shows that through the integration of LiDAR surveys acquired from aircraft measurements and from terrestrial laser scanning it is possible to do the following analysis: i) to generate a high resolution DTM with higher quality and detail, also in areas with very low accessibility, improving the possibility for analysis and modelling of landslides that before could only be achieved with ALS measures, ii) to operate in areas which are not accessible or which have very complex morphology, collecting data even in those parts of the study site where the morphology creates areas void of points due to the scanning geometry.
The use of terrestrial laser scanning as a tool for the monitoring and the analysis of landslides affecting the basin Miozza does not end with the work presented here. We believe the it is necessary to improve in particular two issues: the comparison between the studies of mountain basins based on LiDAR data alone without TLS information and the quantification of landslides through multitemporal TLS surveys without LiDAR data.
REFERENCES
Barbarella, M., Fiani, M., Pistillo, P., 2009. Monitoraggio
dell’evoluzione di una frana tramite Laser Scanning. In: National Conference ASITA, Bari Italy, 1-4 December 2009.
Massari, G., Paganini, P., Potleca, M., Torresin, M.T. 2007. Controllo dei dissesti su un bacino montano tramite analisi multitemporale, In: 10th Esri User Conference, Rome, Italy.
Pirotti, F., Guarnieri, A., Vettore, A., 2013. State of the art of ground and aerial laser scanning technologies for high-resolution topography of the earth surface. European Journal of Remote Sensing 46, 66-78
Tarolli, P., Dalla Fontana, G., 2008. High resolution LiDAR-derived DTMs: some applications for the analysis of the
headwater basins’ morphology. International Archives of Photogrammetry, Remote Sensing and Spatial Information Sciences, 36(5/C55), pp. 297-306.
Tarolli, P., Tarboton, D.G., 2006. A New Method for Determination of Most Likely Landslide Initiation Points and the Evaluation of Digital Terrain Model Scale in Terrain Stability Mapping, Hydrol. Earth Syst. Sci., 10, 663-677.
Guarnieri A., Vettore A., 2006. Tecniche di registrazione. In: Sistemi a scansione per l’Architettura e il Territorio. Firenze, Alinea Editrice.
The International Archives of the Photogrammetry, Remote Sensing and Spatial Information Sciences, Volume XL-5/W3, 2013 The Role of Geomatics in Hydrogeological Risk, 27 – 28 February 2013, Padua, Italy
This contribution has been peer-reviewed. doi:10.5194/isprsarchives-XL-5-W3-59-2013