EXPLORING THE PROCESSES OF GENERATING LOD (0-2) CITYGML MODELS
IN GREATER MUNICIPALITY OF ISTANBUL
I.Buyuksaliha, U.Isikdagb, S.Zlatanovac
a
BIMTAS,TR
[email protected]
b
CSD, University of Central Lancashire, UK
[email protected]
c
TU Delft, NL
[email protected]
KEY WORDS: LOD, CityGML, Istanbul, Process
ABSTRACT:
3D models of cities, visualised and exploded in 3D virtual environments have been available for several years. Currently a large number of impressive realistic 3D models have been regularly presented at scientific, professional and commercial events. One of the most promising developments is OGC standard CityGML. CityGML is object-oriented model that support 3D geometry and thematic semantics, attributes and relationships, and offers advanced options for realistic visualization. One of the very attractive characteristics of the model is the support of 5 levels of detail (LOD), starting from 2.5D less accurate model (LOD0) and ending with very detail indoor model (LOD4). Different local government offices and municipalities have different needs when utilizing the CityGML models, and the process of model generation depends on local and domain specific needs. Although the processes (i.e. the tasks and activities) for generating the models differs depending on its utilization purpose, there are also some common tasks (i.e. common denominator processes) in the model generation of City GML models. This paper focuses on defining the common tasks in generation of LOD (0-2) City GML models and representing them in a formal way with process modeling diagrams.
1. INTRODUCTION
3D models of cities, visualised and exploded in 3D virtual environments have been available for several decades. Currently a large number of impressive realistic 3D models representing urban, mountain, geological, ocean, etc. environments have been regularly presented at scientific, professional and commercial events (de Vries and Zlatanova, 2011). Most of these models have been traditionally vendor-oriented (ESRI, Bentley Systems, Intergraph, etc.), which challenged the exchange of information due to the different data types used, ambiguity in object descriptions, object details, maintenance of properties and texture. In addition, existing 3D city models still miss thematic semantic information, i.e. information about the meaning of the object to be modelled (Kolbe and Gröger 2003, Stoter et al 2011). One of the most promising developments in the field is the OGC standard CityGML (Groger et al. 2008). CityGML is object-oriented model that support 3D geometry and thematic semantics, attributes and relationships, and offers advanced options for realistic visualisation. The standard supports 5 levels of detail (LOD), starting from a 2.5D less detailed model (LOD0) and ending with very detailed indoor model (LOD4). Many large municipalities (Berlin, Stuttgart, Rotterdam, Den Haag, Montreal, etc.) have already created 3D city models in the first more simplified LOD1 (extrusion model) and LOD2 (e.g. buildings with roofs). However, the experiences show that the construction of even such simple LODs is quite challenging (Verbree et all 2010).This paper provides formal process models for depicting the development of City GML models in LOD0,LOD 1 and LOD2 for the city of Istanbul. The aim of this effort is formalizing the tasks in the 3D digital city model
development process for providing a roadmap for the 3D digital city model development. The paper starts with presenting general information on 3D City Models and CityGML, and later elaborates on the stages of 3D city model development process for the city of Istanbul.
2. 3D CITY MODELS AND CITY GML
2.1 General Information on City GML
CityGML is an object-oriented 3D information model designed as exchange format and later offering also database schema. The model is formally described using UML and XML. CityGML is organised in modules, reflecting spatial, appearance and theme characteristics of objects. The Spatial module covers the geometry-topological aspects. Geometry of objects is according to the GML3 object model (based on ISO 19107). Therefore the geometry primitives are point, curve, surface and solid. Curve is restricted to a straight line and therefore, LineString is used instead. Surfaces are represented by Polygons. The primitives can form aggregations and
complexes (which must be topologically correct). GML3
in ISO 19109 and GML3. There are seven types of objects for natural phenomena, one generic class and one class for group objects. For example, thematic objects (features) are LandUse, VegetationObject, CityFurniture, Site (including buildings), etc. The generic class provide a mechanism to extend the model with new themes. As mentioned above CityGML is not only GML-based exchange format but also a data storage model, i.e. 3DCityDB. Similar to the XML syntax, the database spatial schema is not automatically derived from the UML diagram. It is independently developed and is currently available for PostGIS and Oracle Spatial (Kolbe at al 2009).
CityGML has been originally designed for above ground object but it has been extended to integrated underground objects such as utilities and tunnels, via the Application Domain Extension mechanism. Research is also reported on extension of CityGML with geo-technical objects (Emgard and Zlatanova 2008, Tegtmeier et al 2008). The model has been extensively tested, for example, as an exchange data format and database in Netherlands (Stoter et al 20011, Verbree et al 2010) or as a model for research on climate change (Boufidou et al 2010). The tests have clearly shown that the model has a lot of potential.
2.2 The Level of Details (LODs) in City GML
CityGML allows multi resolution maintenance of geometry in the form LOD. Each object can have max five LODs, which has been intended to correspond to the accuracy of the data. LOD0 should be seen more as regional model with low accuracy, while LOD4 is the most detailed but also the most accurate. The LODs are usually seen as geometric representation only. However, at certain levels the geometries are assigned a meaning. For example, from LOD2 a notation for a RoofSurface is introduced. The CityGML specifications, however, does not impose strict rules for composition of LODs and do not discuss which (geometry of semantics) is leading. In contrary, the user is given the freedom to decide on the coherence between semantic and geometry (Stadler and Kolbe, 2007). This creates confusions if automatic approaches are envisaged. In terms of representing buildings 4 out of 5 LODs are used. As explained by OGC(2008) as follows:LOD0 is essentially a two and a half dimensional Digital Terrain Model, over which an aerial image or a map may be draped. LOD1 is the well-known blocks model comprising prismatic buildings with flat roofs. A building in LOD2 has differentiated roof structures and thematically differentiated surfaces. LOD3 denotes architectural models with detailed wall and roof structures, balconies, bays and projections. High-resolution textures can be mapped onto these structures. LOD4 completes a LOD3 model by adding interior structures for 3D objects. For example, buildings are composed of corridors, rooms, interior doors, stairs, and furniture. Presently, the LODs mostly modeled are LOD0, LOD1 and LOD2. LOD0 is usually readily available from 2D data sets and only the Digital Elevation Model (DEM) has to be supplied. If not available it can be created. Various approaches are also used for the reconsrtuction of Buildings in LOD1 and LOD2. Groneman and Zlatanova (2009) present the procedure for obtaining LOD1 from point data and topographic map. Ghwana and Zlatanova (2010) discuss creation of a consistent LOD1 model including Buildings, Vegetation and transportation objects. Hammoudi and Dornaika (2011) concentrates on the automatic reconstruction of LOD2 for buildings. More recent studies include Biljecki and Stoter (2013) who discussed concept of Level Of Detail in 3D City Modelling, while Boeters (2013) explored the automatic enhancement of CityGML LoD2 models
with interiors. The following explains the multi LOD model development process in Istanbul in detail.
3. THE 3D CITY MODEL GENERATION PROCESSES IN ISTANBUL
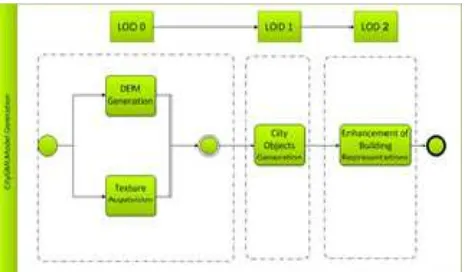
The 3D City Model of Istanbul is developed by Greater Municipality of Istanbul Metropolitan Planning and Urban Design Center (BIMTAS). The Center is responsible for various geo-information processing tasks related to the municipality including transportation planning, town planning and regeneration. The 3D City Model of Istanbul is still being developed with a workgroup of the center, and is viewed as a valuable asset for enabling efficient information management in city planning and management tasks. The model LODs is the equivalent of City GML LOD0/LOD1/LOD2, and the model is stored in and can be represented as CityGML when required. The model generation is accomplished with an iterative/incremental approach, where there are several versions of the model in different LODs. The Figure 1 provides a summary of the overall 3D City Model generation processes. The following sections elaborate on the process that leads to the generation of different LODs of the 3D City Model.
Figure 1. A summary view of 3D City Model generation processes
3.1 LOD 0 Model Generation Processes
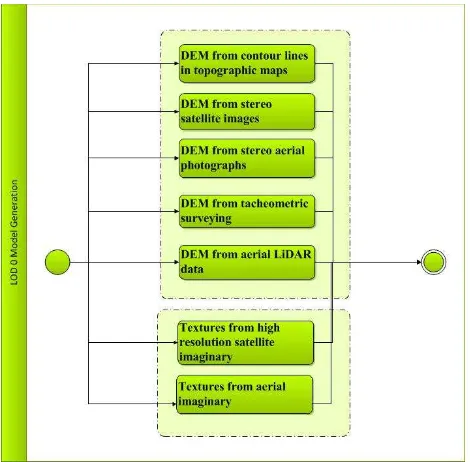
The LOD 0 Model generation activities can be grouped
into two process groups (Figure 2) which are i.) Digital
Elevation Model (DEM) generation, and ii.) Generation
of textures based on acquired information. There are 5
sub-processes in DEM generation and 2 sub-processes in
Texture Generation which will be explained in the
following.
Figure
2
. LOD 0 Model generation processes3.1.1 Generation of Digital Elevation Models
The Digital Elevation Models used in 3D city model, are generated using contour line maps, stereo images, data from surveying and using information from LIDAR data.
Generation of the DEM from contour lines in topographic maps
In this method, the contour lines are transformed into GIS software usually from CAD files. In the next phase a triangulated irregular network (TIN) is generated based on the height information gathered from contour lines. In general, all the vertices of the contour lines are used as mass points for triangulation. In the final phase the TIN to Raster conversion functionality is used to generate a Raster DEM of the area. Depending on the functional requirement a TIN model (i.e. CityGML contains a TIN relief class) or a Raster DEM can be used as the Digital Elevation Model of the area.
Generation of the DEM from stereo satellite images
In remote regions where no other source of data is available, the DEM can be produced by automatic DEM extraction from stereo satellite images, from satellites such as IKONOS (2-5m resolution), SPOT-5 (5-10m res.). Stereo images consist of two satellite images of the same location on Earth, taken from two different perspectives during one orbital pass. As mentioned by Kwoh et al (2004) so far, researchers have investigated various methods of generating a digital elevation model (DEM) using remote sensing data. One of the methods is to use two images at a time for the reconstruction of a three dimensional stereo model in which the altimetric information can be extracted. This method generally contains three basic steps: set up sensor mathematical model to reflect the relationship between points on the ground and pixels on the image, do image matching to get a disparity map, and finally calculate each point’s altitude.
Generation of the DEM from stereo aerial photographs A similar method of DEM generation is using stereo aerial photographs. In both images WKP (well-known positions are cross referenced in as many as possible different images. A TIN model or a Raster DEM is then created using different software applications.
Generation of the DEM from tacheometric surveying The word “tacheometry” comes from Greek (i.e. meaning quick measure), is a method for rapid surveying, in which the positions of points on the earth surface relatively to one another are determined. In tacheometric surveying the horizontal and vertical distances of points on are obtained by optical means, thus it is quick as opposed to the ordinary slower process of measurements by tape or chain. In order to create a DEM of the area (X,Y,Z) coordinates of the critical (key) points are recorded using the tacheometric surveying techniques. Following this A TIN or Raster DEM is generated from the obtained point clouds using GIS software.
Generation of the DEM from Aerial LiDAR Data
As stated by NOAA (2008) LiDAR, is an acronym for light detection and ranging. It is analogous to radar (radio detection and ranging), except that it is based on discrete light pulses and measured travel times. The location and elevation of the reflecting surface are derived from 1) the time difference between the laser pulse being emitted and returned, 2) the angle that the pulse was ‘fired’ at, and 3) the location and height of the aircraft (i.e. the sensor location). The resulting product is a densely spaced network of highly accurate georeferenced elevation points also called a point cloud that can be used to generate 3D representations of the Earth’s surface and its features. In the city modeling process the DEM is generated from the LİDAR point clouds using GIS.
3.1.2 Generation of Textures
Textures are generated by the utilization of two different methods, both of which makes use of images, i.e. using satellite and aerial imaginary.
Generation of textures from high resolution satellite imaginary
High resolution images acquired from the satellites such as IKONOS,SPOT-5 can be used as the textures of the city models. In order to be used as the textures the images must be georeferenced. Georeferencing can be defined as determining the spatial location of the image in the current coordinate system and projection. In the georeferencing process,firstly control points with the known cooridinates are established, and then the coordinate system and other projection parameters are provided to a GIS for completing the georeferencing operation.
Generation of textures from aerial imaginary
Aerial imaginary is also used for texture generation in city models. Aerial images are at scales from 1:10,000 to 1:50,000. The main resource for generating texturesin the city model were color photos provide by national resources.
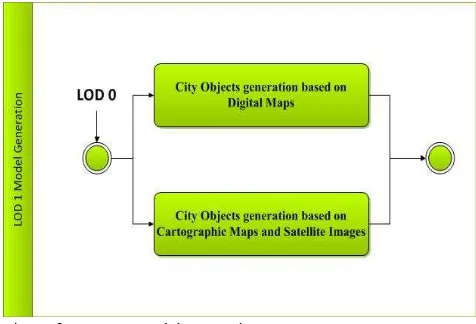
3.2 LOD 1 Model Generation Processes
Figure
3
. LOD 1 Model generation processes3.2.1 City Objects generation using Digital Maps
This procedure involves the acquisition of digital maps from various resources in different file formats and data transformation activities to represent information within a commonly recognized file format such as CityGML. The transformation process also includes editing of semantic information in order to represent it in the form required by the standard city models. This process also involves data fusion activities, i.e. semantic information from multiple sources is integrated to populate the different attributes of the objects in the city model. The geometric representation of the objects acquired from the digital maps are usually found sufficient for LOD 1 representation of them, thus the geometric editing operations are conducted rarely.
3.2.2 City Objects generation based on Cartographic Maps and Satellite Images
In the second method, cartographic maps are manually digitized using a GIS, and data produced form this process is used for forming the geometry of the LOD 1 objects. Another way of acquiring geometries is using regular and stereo satellite images. In this option, the city object geometries can be generated by manual digitization using a GIS software .The other option is using image classification functions of a GIS software for semi-automatic / automatic derivation of 2D or 3D geometries of the city objects. If the derived geometries are in 2D, GIS functions (such as extrude and so on) are used to generate 3D LOD1 models. In this method, the semantic information is input into the model manually or cadastral databases can be used in assigning attributes to the objects. Similar to the previous method, integration of semantic information from multiple resources is also required to populate the attributes of the objects in the model.
3.3 LOD 2 Model Generation Processes
Generation of LOD 2 model includes the generation of city objects with detailed textures including, buildings with detailed roof structures, chimneys, balconies , outer stairs and detailed façade representations. First approach for acquiring 3D building information was implemented as 3D reconstruction where information about an existing building is collected from single or multiple source and geospatial models are created with respect to an application. Measuring and 3D reconstruction has a long history. A variety of approaches can be used for this (Tao, 2006) including LiDAR and Terrestrial Laser Scanning. In the context of Istanbul City Model development, Terrestrial Laser Scanning is used as the main information acquisition
method for LOD2 model generation. The second approach implemented utilizes CAD and BIM to acquire information about buildings. Both approaches are depicted in Figure 4.
Figure
4
. LOD 2 Model generation processes3.3.1 Model generation based on Terrestrial Laser Scanning
3D Laser Scanning Technology has emerged as the most innovative method and much research is devoted to developing automatic algorithms for 3D reconstruction (i.e. Arayici, 2007, Kang et al 2007), however, many public buildings (mostly tourist attractions) have been scanned from inside, but most of them modeled manually. In fact, such approaches are gathering geometric information about building façades and are not commonly used to acquire information from indoor spaces. During Istanbul City Model generation, 3D Laser Scanning technology was used to generate the point clouds of key buildings of the city such as old palaces, mosques. In addition, geometric information regarding the other city objects at historical squares was also acquired by this method. The point clouds generated as a result of a 3D Laser Scan were then transformed into 3D building models semi-automatically by using specialized software and then edited using CAD and BIM packages. Semantic information was then i.) acquired from cadastral and municipality databases or ii.) input manually to populate the attributes of the city objects and building models. Figure 5 presents a partial view of LOD 2 model. Roof shapes are derived from LIDAR data.
Figure 5. Partial View of LOD2 Model
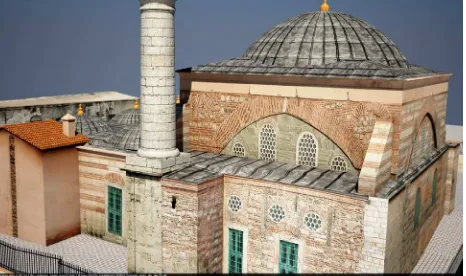
Figure
6
. The LOD 2 Representation of a Mosque Generated based on Terrestrial Laser Scanning Data3.3.2 Acquisition of Building Models from CAD and BIM The second approach for acquiring 3D building information was using digital building models, and simplifying them (geometrically and semantically). Since many years, digital building models have been in form of -CAD Models- (which only contain geometric information), but developments in the field have resulted with the emergence of Building Information Models (BIMs), which are capable of containing both geometric/semantic information and they are developed with the intention of covering all stage of the building/facility lifecycle (i.e. from the concept design to maintenance /demolition). Information transformation from CAD files was much straightforward as most GIS provides options for importing them, in this case semantic information regarding the building elements is usually provided manually. The transfer of information from BIM to the 3D City Model was rarely encountered, as the use of BIMs in Turkey is very limited. In order to generate the buildings in 3D City Models from BIMs specialized software was used for transforming geometric and semantic information and representing it in form of a 3D city object. This automatic process sometimes produced errors in terms of geometrical transformation, in fact better results would be available in the near future, parallel to the developments in the model transformation software.
4. SUMMARY AND CONCLUSIONS
In Istanbul, there has been continuing efforts for over 5 years for the development of 3D digital city models. The models are developed mainly for visualisation purposes. City GML has been used as a standard for the storage and exchange of the city model components. As summarized in the paper CityGML is an OGC standard information model that support representation of 3D geometry and thematic semantics, attributes and relationships, and offers advanced options for realistic visualisation. At the moment the 3D model of Istanbul contains only terrain (LOD0), buildings (LOD1 and LOD2) and vegetation (LOD2). The LOD 0 model development efforts cluster around generation of DEMs and acquisition of textures from multiple sources. LOD 1 model generation efforts mainly concentrate on generation of City Objects based on cartographic maps and aerial imaginary. Model generation at the LOD 2 mainly benefits from information acquired from, Terrestrial Laser Scanning (i.e. 3D reconstruction) and 3D CAD Models. The process of generation of LOD 3 models of buildings is still in progress, further research will investigate the formalization of LOD 3 , LOD 4 model generation processes.
The 3D model is stored in the form of ESRI shapefiles, ESRI Geodatabase and CityGML files. In LODs the objects are modeled as multi surfaces. The semantic information in the buildings is limited with simple attributes for the moment such as Building ID, Number of Stories, Building Name…Individual roof surfaces can be identified in the LOD2 model. The DEM is generated for LOD0 and the same model used in LOD1 and LOD2. The footprints for LOD1 and LOD2 are not used as constraints in the triangulation. In some cases depending on the surface elevation the horizontal floor surfaces of the buildings can be seen as -not aligned- with the DEM surface. This implies that many wall surfaces intersect with the terrain surface. Topology as discussed in CityGML is not created as well, i.e. faces between two adjacent buildings do intersect.
The results of this study have demonstrated that many of the existing software packages and commercial approaches does not provide good means to create LODs as in the concept of CityGML. New tools are needed to collect semantics in easy way and to check the validly of geometry. Examples of such validy checking tools is QS-City 3D (http://sourceforge.net/projects/qscity3d/). Tools like pprepair and val3dity attempt to check and repair many of the unvalid geometries (https://github.com/tudelft-gist/pprepair, https://code.google.com/p/val3dity/) .
REFERENCES
Arayici, Y. (2007) "An approach for real world data modelling with the 3D terrestrial laser scanner for built environment", Automation in Construction, 16(6) pp. 816-829.
Biljecki,F., Stoter,J.,2013,Overview of the PhD research: the concept of Level Of Detail in 3D City Modelling
EuroSDR/OGC Workshop CityGML in National Mapping, Institut National de l'Information Géographique et Forestiè, January 2013, Paris, 4 p.
Boeters,R.,2013, Automatic enhancement of CityGML LoD2 models with interiors and its usability for net internal area determination, Master's thesis TU Delft, 2013, 119 p.
Boufidou, E., T. J.F. Commandeur, S. B. Nedkov and S. Zlatanova, 2011, Measure the Climate, model the City, In: Fendel, Ledoux, Rumor&Zlatanova (eds), Proceedings of the 28th UDMS, International Archives of the Photogrammetry, Remote Sensing and Spatial Information Sciences, Volume XXXVIII-4/C21, pp.59-66
de Vries, T. and S. Zlatanova, 2011, 3D Intelligent Cities, In: GEO Informatics, Volume 14, 3, pp. 6-8
Emgård, KL and S. Zlatanova, 2008, Design of an integrated 3D information model. In Coors, Rumor, Fendel & Zlatanova (eds.), Urban and regional data management: UDMS annual 2007 (pp. 143-156), Taylor & Francis Group, London, UK
Groneman, A. and S. Zlatanova, S, 2009, TOPOSCOPY: a modelling tool for CITYGML, In Onsrud & van de Velde (Eds.), Proceedings of GSDI Association, July, Rotterdm, pp 1-13
Kang, Z., Z. Zhang, J. Zhang & S. Zlatanova, 2007, Rapidly realizing 3D visualisation for urban street based on multi-source data integration, in: Li, Zlatanova&Fabbri (Eds.) Geomatics Solutions for Disaster Management, Lecture Notes in Geoinformation and Cartography, Springer-Verlag Berlin, Heidelberg, pp. 149-163
Kolbe, T. and G. Gröger, 2003, Towards unified 3D city models, Proceedings of the ISPRS Comm. IV Joint Workshop on Challenges in Geospatial Analysis Integration and Visualization, September 8-9, 2003 in Stuttgart, 8p.
Kolbe, T. H., Koning, G., Nagel, C. and Stadler, A., 2009. 3DGeo-Database for CityGML.
Kwoh,L.K., Liew,S.C. Xiong,Z. ,2004, Asian Automatic DEM Generation From Satellite Image Conference on Remote Sensing (ACRS) http://www.a-a-r-s.org/acrs/proceeding/ ACRS2004/ Papers/ 3DG04-2.htm
Ledoux, H. and M. Meijers, 2011, Topologically consistent 3D city models obtained by extrusion, In: International Journal of Geographical Information Science, Volume 25, 4, pp. 557-57
National Oceanic and Atmospheric Administration (NOAA) Coastal Services Center. 2008. “Lidar 101: An Introduction Lidar Technology, Data, and Applications.” Charleston, SC: NOAA Coastal Services Center
OGC (2008). OpenGIS® City Geography Markup Language
(CityGML) Encoding Standard, OGC project document no:
OGC 08-007r1, G. Gröger, T. H. Kolbe, A. Czerwinski and C.
Nagel (Eds.), Retrieved from: http://www.opengeospatial.org/standards/citygml
Stadler, A. and T.H. Kolbe, 2007, Spatio-Semantic Coherence in the Integration of 3D City Models; Proceedings of 5th International ISPRS Symposium on Spatial Data Quality ISSDQ 2007 in Enschede, available at: http://www.igg.tu-berlin.de/uploads/tx_ikgpublication/SDQ2007_Stadler_Kolbe.p df (last accessed January 2012)
Stoter, J., Vosselman, G., Goos, J., Zlatanova, S., Verbree, E., Klooster, R. and Reuvers, M., 2011. Towards a National 3D Spatial Data Infrastructure: Case of The Netherlands. PFG Photogrammetrie, Fernerkundung, Geoinformation, 2011(6): 405-420.
Tao, V., 2006, 3D Data Acquisition and object reconstruction for AEC/CAD, in Zlatanova& prosperi9 eds.): Large-scale 3D data integration: challenges and opportunities, Taylor & Francis Group, CRCpress, Boca Raton, pp.39-56
Tegtmeier, W., S. Zlatanova, P. van Oosterom and H.R.G.K. Hack, 2009, Information management in civil engineering infrastructural development: with focus on geological and geotechnical information. In: Kolbe, Zhang&Zlatanova (Eds.), Proceedings of the ISPRS workshop, vol. XXXVIII-3-4/C3 Commission III/4, IV/8 and IV/5: Academic track of GeoWeb 2009 conference: Cityscapes International archives of photogrammetry, remote sensing and spatial information sciences (pp. 1-6). Berlin, Germany: ISPRS