MAPPING FOREST SPECIES COMPOSITION USING IMAGING SPECTROMETRY
AND AIRBORNE LASER SCANNER DATA
H. Torabzadeh*, F. Morsdorf, R. Leiterer, M. E. Schaepman
Remote Sensing Laboratories, Department of Geography, University of Zurich, Winterthurerstrasse 190, 8057 Zurich,
Switzerland, (hossein.torabzadeh, felix.morsdorf, reik.leiterer, michael.schaepman)@geo.uzh.ch
KEY WORDS: Fusion, Airborne Laser Scanning, Imaging Spectrometry, Forest Species
ABSTRACT:
Accurate mapping of forest species composition is an important aspect of monitoring and management planning related to ecosystem functions and services associated with water refinement, carbon sequestration, biodiversity, and wildlife habitats. Although different vegetation species often have unique spectral signatures, mapping based on spectral reflectance properties alone is often an ill-posed problem, since the spectral signature is as well influenced by age, canopy gaps, shadows and background characteristics. Thus, reducing the unknown variation by knowing the structural parameters of different species should improve determination procedures. In this study we combine imaging spectrometry (IS) and airborne laser scanning (ALS) data of a mixed needle and broadleaf forest to differentiate tree species more accurately as single-instrument data could do. Since forest inventory data in dense forests involve uncertainties, we tried to refine them by using individual tree crowns (ITC) position and shape, which derived from ALS data. Comparison of the extracted spectra from original field data and the modified one shows how ALS-derived shape and position of ITCs can improve separablity of the different species. The spatially explicit information layers containing both the spectral and structural components from the IS and ALS datasets were then combined by using a non-parametric support vector machine (SVM) classifier.
* Corresponding author.
1. INTRODUCTION
Forests cover almost one third of the total land surface of the Earth and play an important role in the global energy and matter fluxes between atmosphere and the land surface. Assessing and quantifying forest ecosystem goods and services (associated with water refinement, carbon sequestration, biodiversity, or wildlife habitats) and their underlying processes helps to develop sustainable management strategies and to project biogeochemical cycles under changing climate conditions (Fisher et al., 2009). Particularly the tree species composition is an important aspect of forest monitoring as well as for management planning. Assessing of tree species composition with traditional fieldwork is labor-intensive, time-consuming and mostly limited by spatial extent; accordingly, remote sensing data enables to overcome these limitations.
Although imaging spectrometry (IS) data are better suited for classification of forest species than ordinary multispectral remotely sensed data (Ustin and Xiao 2001), But discrimination of the different species with similar spectral response is still difficult task (Koetz et al, 2008). On the other hand, airborne laser scanning (ALS) systems are promising tool for providing forest biophysical information in both horizontal and vertical directions due to the penetration of the transmitted laser signal through the canopy.
Reliable field data is generally required to perform a species classification over a forest so that a significant link between tree
position measured in the field and corresponding tree detected on remotely sensed data should be established. However in the dense forest with high level of topography variations, a significant correlation cannot be found effortlessly.
The main objective of this study is to evaluate forest species discrimination ability using IS datasets when ALS-derived biophysical parameters are used along with ordinary IS datasets.
Species name Number
of trees
DBH
Min Max Mean dead tree (deciduous) 30 20 98 64
abies alba 108 20 142 55
picea abies 51 22 114 66
acer platanoides 40 20 54 31
acer pseudoplatanus 168 21 65 35
fagus sylvatica 515 20 106 46
fraxinus excelsior 248 20 99 43
tilia platyphyllos 105 20 74 31
ulmus glabra 43 20 51 28
1308
Table 1. Overview of the field inventory data in Leageren site.
International Archives of the Photogrammetry, Remote Sensing and Spatial Information Sciences, Volume XL-1/W3, 2013 SMPR 2013, 5 – 8 October 2013, Tehran, Iran
2. STUDY AREA AND DATA
The test area is a small part of a semi-natural forest stand in Laegeren, Switzerland (47°28’N, 8°21’E). This 500×300 m deciduous-dominated forest is located on steep hills (slope up to 60°) and contains high diversity of species from 55 to 160 years old (Eugster et al., 2007). Tree species data is a part of one comprehensive forest inventory collection where each species was recognized from the trunk bark during early spring 2013. Table 1 shows more details about the observed trees in each species. Direction and amount of the crown displacement than its trunk, layer number and approximate crown dimension have been measured as well.
In this study we employed a full waveform ALS system under leaf-on canopy condition in August 2010 (RIEGL LMS-Q680i scanner, table 2).
Instrument RIEGL LMS-Q680i
Wavelength [nm] 1550
pulse length [ns] < 4
pulse frequency [Hz] 200000
Scan angle [deg] ±15
Avg. Flight altitude [m] 500
Average point density [p/m2] 40
Date 01.08.201
Table 2. Specification of the ALS instrument (Leiterer et al., 2010).
IS dataset has been produced by Airborne Prism Experiment (APEX) during the same time as ALS data was provided. This sensor provides 301 spectral bands in range of 380-2500 nm with two meters spatial resolution on the ground. More information about APEX characteristics will be found on Itten et al, 2008.
3. METHODOLOGY
3.1 Overview
The main goal of combining ALS and IS data is to use complementarities of both and reduce the uncertainties may occur when using them solely. Therefore we designed and followed a workflow (Figure 1) to benefit the fusion advantages the most. As usual fusion routine we started with co-registration of both dataset. We decided to align the APEX dataset based on ALS data, because it has been geo-referenced very accurately (± 20 cm).
3.2 ALS data processing
In comparison with ordinary two dimensional remotely sensed images (e.g. IS datasets), three dimensional laser scanners data requires particular processing steps.
3.2.1 Canopy height model (CHM): Based on geometrical
characteristics of the single and last laser echoes, new adaptive multi-scale algorithm (Leiterer et al., 2010) applied to extract the ground returns. These points then were interpolated to a 1×1 m digital terrain model (DTM). Furthermore, a digital surface model (DSM) was generated using the first echo reflections in an identical size. Computing the differences between DSM and DTM results CHM, which reflects height variations of the vegetation cover in our study site (Figure 2).
ALS data
IS data Forest inventory
data
Figure 1. Overview of implemented processing steps for ALS and IS data combination. Rectangles point to processing units and parallelograms are products.
50 m
0 m
Figure 2. Canopy Height Model (CHM) of the study site.
The DSM was used for retrieving the shaded/sunlit areas in the forest by exploiting a simple ray tracing algorithm and exact sun position in the IS data acquisition time.
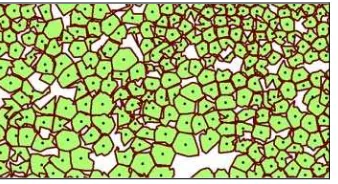
3.2.2 Delineation of trees position and crowns shape: finding
the local maxima as the top of the canopy followed by a 3D clustering approach (Morsdorf et al, 2004) for segmenting the CHM into individual tree crowns (ITC). Since k-mean clustering approach applies on the original point clouds (instead of CHM), all parts of a single tree are expected to be involved in the process. Small crowns have been finally removed using a morphological filter (Figure 3). Also crown centroids considered as the best estimation of the tree positions in normal conditions.
Figure 3. Detected trees and their crowns from ALS data ( only a part of the study site)
3.3 IS data processing
Two specialized additional applications were employed for geo-coding (PARGE) and radiometric/atmospheric correction (ATCOR) of the APEX data so that geo-rectified IS reflectance
International Archives of the Photogrammetry, Remote Sensing and Spatial Information Sciences, Volume XL-1/W3, 2013 SMPR 2013, 5 – 8 October 2013, Tehran, Iran
data was provided in form of a hyperspectral data cube (Schläpfer et al, 2000).
Besides, ALS derived shaded/sunlit mask has been used to correct the geometrical residual errors. IS data shifted therefore to reach the highest correlation between the mask and shaded pixels in the IS data. Figure 4 shows a false colour composite image of APEX data. Spectral information for each pixel extracted then by overlaying the crown shapes on the IS data.
Figure 4. False color composite APEX image (Red: 860nm; Green: 650nm;Blue: 552nm)
Due to superior performance of non-parametric classifiers in remote sensing while multi-source data should be classified (Waske and van der Linden, 2008), we used a support vector machine (SVM) classifier at the end to discriminate different species. A radial basis function (with gamma=0.005) was chosen as a kernel of SVM and probability of 50% was introduced as labelling threshold.
3.4 Matching the forest inventory data
Because of tree leaning in slopes and tall trees that were dominant in the study site, connecting forest inventory data to remote sensing data faces some difficulties so that any significant relationship between measured tree position and computed crown centre by ALS data cannot be established. We tried to find the neighbouring crown with high probability of matching for each measured tree in the field. For this purpose, a set of constrains defined to tighten the search parameters (e.g. considering upper crown layers only). Forest inventory data for each tree then assigned to the nearest ALS-derived tree that fulfill the constraints.
4. RESULTS
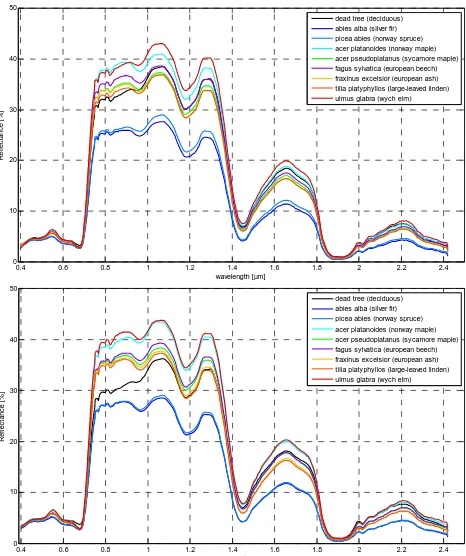
To evaluate the ability of the species discrimination, first we compared the reflectance spectra of each class before and after forest inventory data matching. Computed spectra from original field data (figure 5; up) indicates that only discrimination of conifer and deciduous species is possible. Mixing the dead trees spectra with other deciduous trees decreases chance of its determination as well. On the contrary, new reflectance spectra, which produced from matched field data to ALS-derived crowns, shows that four different classes (group of species) can be recognized clearly. These classes include: (1) conifers (abies alba and picea abies), (2) dead deciduous trees, (3) mixture of fagus Sylvia, fraxinus excelsior, tilia platyphyllos and acer psuedoplatanus and (4) mixture of ulmus glabra and acer platanoides (Figure 5; down).
Since shaded parts of the canopies significantly contaminate the spectral response of each species (Garcia-Haro et al., 1996),
applying the ALS-derived shaded-sunlit mask to IS data provides an opportunity to remove these areas from necessary training dataset for classification.
The IS data was masked by ALS-derived crowns right before classification to ensure non-canopy areas do not involved in further procedures. Using the matched field data, the SVM classifier applied on 285 bands of APEX reflectance data cube for discrimination of the four species (derived from reflectance spectra interpretation). Cross validation of the produced species map indicates 62% of overall accuracy, whereas, classification of 9 classes with original field inventory data resulted 25% of overall accuracy.
Figure 5. Reflectance spectra of (up) different species computed using original field inventory data and (down) matched field data to ALS-derived crowns, which computed from sunlit part of the crowns only.
5. CONCLUSION
We introduced a combination method for using biophysical parameters of the forest (i.e. tree location, crown shape and tree height) to improve species detection on the IS datasets. These ALS-derived parameters not only help for correcting the forest field inventory, but also for class selection and masking the non-tree surfaces in the forests. The results indicates that in the dense mixed forests, which located in slopes, field inventory data can not connected simply to the remote sensing data without using auxiliary information that provided by ALS data in this study. However, this method of combination may still contain uncertainties resulting from geo-registration and/or 3D clustering of the ALS data.
Utilizing other value-added products from ALS data, such as height percentiles and fractional cover, may improve determination procedure even more.
International Archives of the Photogrammetry, Remote Sensing and Spatial Information Sciences, Volume XL-1/W3, 2013 SMPR 2013, 5 – 8 October 2013, Tehran, Iran
6. ACKNOWLEDGMENT
The forest inventory data for the test area have been kindly provided by A. Rudow, ETH Zurich.
7. REFERENCES
Eugster, W., Zeyer, K., Zeeman, M., Michna, P., Zingg, A., Buchmann, N., & Emmenegger, L. (2007). Nitrous oxide net exchange in a beech dominated mixed forest in Switzerland measured with a quantum cascade laser spectrometer. Biogeosciences Discussions, 4(2), 1167-1200.
Garcia-Haro, F. J., Gilabert, M. A., & Melia, J. (1996). Linear spectral mixture modelling to estimate vegetation amount from optical spectral data.International Journal of Remote Sensing, 17(17), 3373-3400.
Itten, K. I., Dell’Endice, F., Hueni, A., Kneubühler, M., Schläpfer, D., Odermatt, D., ... & Meuleman, K. (2008). Apex-the hyperspectral esa airborne prism experiment. Sensors, 8(10), 6235-6259.
Koetz, B., Morsdorf, F., Van der Linden, S., Curt, T., & Allgöwer, B. (2008). Multi-source land cover classification for forest fire management based on imaging spectrometry and LiDAR data. Forest Ecology and Management,256(3), 263-271.
Leiterer, R., Morsdorf, F., Torabzadeh, H., Schaepman, M. E., Mucke, W., Pfeifer, N., & Hollaus, M. (2012). A voxel-based approach for canopy structure characterization using full-waveform airborne laser scanning. InGeoscience and Remote Sensing Symposium (IGARSS), 2012 IEEE International (pp. 3399-3402). IEEE.
Morsdorf, F., Meier, E., Kötz, B., Itten, K. I., Dobbertin, M., & Allgöwer, B. (2004). LIDAR-based geometric reconstruction of boreal type forest stands at single tree level for forest and wildland fire management. Remote Sensing of Environment, 92(3), 353-362.
Schläpfer, D., Hausold, A., & Richter, R. (2000). A unified approach to parametric geocoding and atmospheric/topographic correction for wide FOV airborne imagery. Part 1: Parametric ortho-rectification process. In Proc. 2nd EARSeL Workshop on Imaging Spectroscopy, EARSeL, Enschede (Vol. 9).
Ustin, S. L., & Xiao, Q. F. (2001). Mapping successional boreal forests in interior central Alaska. International Journal of Remote Sensing, 22(9), 1779-1797.
Waske, B., & van der Linden, S. (2008). Classifying multilevel imagery from SAR and optical sensors by decision fusion. Geoscience and Remote Sensing, IEEE Transactions on, 46(5), 1457-1466.
International Archives of the Photogrammetry, Remote Sensing and Spatial Information Sciences, Volume XL-1/W3, 2013 SMPR 2013, 5 – 8 October 2013, Tehran, Iran