PHOTOGRAMMETRIC ANALYSIS OF A HERITAGE CEILING
Lindsay MacDonald, Ali Hosseininaveh Ahmadabadian and Stuart Robson
Dept. of Civil, Environmental & Geomatic Engineering, University College London. [email protected]
Commission V
KEY WORDS: Cultural Heritage, Monitoring, Image, Algorithms, Close Range, Multiview Stereo, Conservation
ABSTRACT:
Conservation of the painted ceiling at the historic Hampton Court Palace requires the condition of the ceiling to be monitored for signs of formation of cracks and flakes in the surface. Miniature monochrome cameras and LED lights were mounted on a horizontal bar, and raised by a telescopic mast to 60 cm below the ceiling. Images from the cameras were captured simultaneously by purpose-developed software in a laptop computer at floor level. A series of image pairs was acquired at each location, rotating the mast between each pair. Images were enhanced in local contrast by a modified Wallis filter. From the image set a dense and accurate point cloud was generated, using a photogrammetric bundle adjustment procedure, from which 3D surface details could be visualised.
1. INTRODUCTION
The painted ceiling high above the Queen’s Staircase at Hampton Court Palace is subject to cracking and the formation of paint flakes, and conservators are closely monitoring its condition. In a previous investigation a method was developed for 3D imaging of the ceiling, based on the principles of photometric stereo (MacDonald et al, 2012). A Nikon camera with a 300mm telephoto lens was mounted on a tripod on the floor of the gallery, and a flash light was raised on an 8-metre mast to cast a raking light across the surface of the ceiling. By taking a series of images with illumination from different directions, we were able to demonstrate the feasibility of the technique to visualise the surface topography in small areas at a spatial resolution of 0.1 mm (Fig. 1).
Figure 1. Detail of painted ceiling, taken in 2011, illuminated by raking light, showing an extended crack. The camera was mounted on a tripod at floor level.
In a further investigation during 2012 and 2013, a different approach was taken. Miniature monochrome cameras and LED lights were mounted on a horizontal bar, and raised by means of a telescopic mast on the gallery floor to 60 cm below the ceiling. Images from the cameras were captured simultaneously by purpose-developed software in a laptop computer at floor level. A series of image sets was acquired at each ceiling location, rotating the mast between each set. From the image
sets a dense and accurate point cloud was generated, using a photogrammetric bundle adjustment procedure, from which visualisations of the surface were obtained. The objective was to deploy the system at intervals of three months at the same locations to monitor the condition of the ceiling and detect any changes. In this paper we describe the photogrammetric procedure and a new method for image contrast enhancement, which substantially improved the quality of the point clouds.
2. APPARATUS
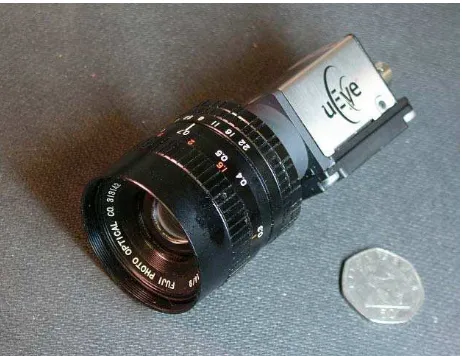
For the new project it was important to have lightweight cameras that could easily be operated at height. We chose the IDS UI 5480CP-M-GL camera (hereafter called uEye) because of its proven performance in other real-time photogrammetric and industrial applications (Fig. 2). It takes C-mount lenses and has a monochrome CMOS sensor of dimensions 5.6x4.2 mm with pixel dimension of 2.2 microns, producing an image of 2560x1920 pixels in 4:3 aspect ratio with 12 bits per pixel. The camera has no Bayer mask or infra-red cutoff filter, and so generates a monochrome image representing the integral of radiant power over the whole spectral range 400-1100 nm. It weighs only 61g and can be powered through an Ethernet cable.
Figure 2. Miniature uEye camera fitted with Fujinon 9mm C-mount lens. The 50p coin shows the relative size.
Two uEye cameras were fitted with Fujinon 9mm lenses mounted on a horizontal aluminium bar with a distance of 60 cm between centres. Each camera was turned inwards by an angle of 20°. Four 4.5W LED lamps (12 volt, MR16 sockets) were also mounted on the camera bar to provide local illumination of the ceiling (Fig. 3).
Figure 3. Top view of the camera rig, showing camera lenses, positioning lasers and LED lights.
A miniature laser was fixed alongside each camera at the same angle so that its beam was parallel to the camera’s optical axis. The two beams converged at a distance of 82 cm from the bar. The principle of operation was to raise the telescopic mast supporting the rig progressively towards the ceiling until the two laser spots converged (Fig. 4), at which position the two cameras should produce sharp images (the lenses having been pre-focussed for this distance). Each lamp produced 360 lumens, cool white colour balance, with a beam angle of 60 degrees. These were powered from a 20W power supply at ground level via a twin cable up the mast. The weight of the whole assembly, excluding trailing cables, was 1,600 grams.
Figure 4. Arrangement of camera pair on top of telescopic mast, showing lasers, lamps and overlapping fields of view.
The horizontal bar was clamped onto a 10m telescopic fibreglass mast, with five sections of 240 cm of diameter 57-30 mm. The mast was anchored at floor level by a heavy-duty steel tripod. It was steadied around the base section by a longer aluminium Leica survey tripod with a 58mm collar at 1.8m height. The dangling cables were secured with electrical tape to the mast to keep them close to the centre of gravity and minimise lateral forces on structure.
The two lenses were set to aperture f /11 and focus distance 0.7m, and the outer rings taped to prevent movement. In the lab previously the rig had been set up to the laser convergence distance of 705mm and the image area was determined to be
44x33cm with a region of overlap of 31x31cm (Fig. 5). Because the cameras were tilted with respect to the surface, the depth of field was limited and the outer 5 cm on each side was out of focus. The resolution at the centre of the field was ~5.8 pixels/mm, i.e. each pixel covered 170 microns on the surface. Illumination from the four LED lights gave good coverage across the image area. A set of 18 image pairs was captured at each of two mast locations close to the handrail at the gallery centre, with exposure time 52 msec. The mast was rotated by intervals of ~20° between successive positions.
Figure 5. Images from left and right cameras with 9mm lenses, showing the region of overlap of 31x31 cm. The laser beams appear as a bright spot near centre.
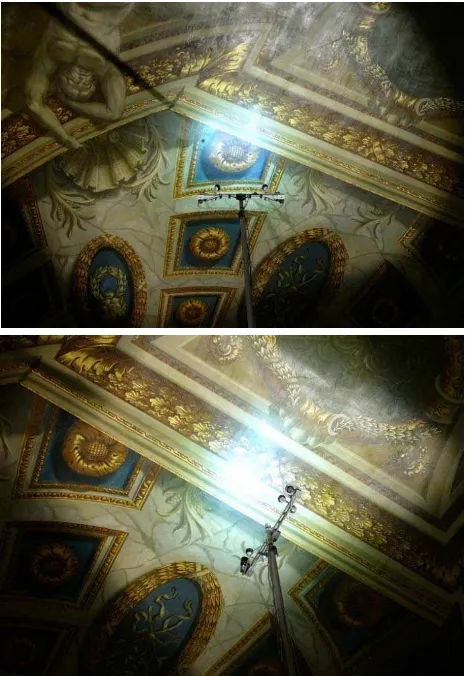
Image sets were taken at two different locations on the ceiling above the gallery (Fig. 6). The first was a rosette design, the second a crossed ribbons motif. Tungsten halogen spotlights at floor level were employed to provide a broad circle of illumination in addition to the LED lights on the rig.
Figure 6. Mast deployed at two locations, showing the circle of yellowish light on the ceiling from floor-mounted spotlights and the localised bluish illumination from the four LED lights on the mast head.
Figure 7. Pairs of images from left and right cameras under LED lighting at first location (top) showing a flake and second location (bottom), showing a crack.
3. PHOTOGRAMMETRIC PROCESSING
The aim was to generate from each set of images a dense and accurate 3D point cloud of the ceiling surface. The method was similar to that presented by Ahmadabadian et al (2013), as shown in Fig. 8. After geometrically correcting (‘undistorting’) the images, measurements extracted from the images were used to compute approximate 3D coordinates in Bundler.
Figure 8. Generating a dense point cloud from the image set.
The original images were analysed in VisualSFM to generate a dense point cloud. This software package includes bundler, cluster multi-view stereo (CMVS) and patch-based multi-view stereo (PMVS). The resulting point cloud was too sparse to discriminate 3D features on the ceiling due to insufficient textured area in the images. In order to improve the quality of images, corrections were applied to the images to remove geometric distortion caused by the camera lens. These included optical aberration (radial and tangential lens distortions) and axial displacements of the lens with respect to the sensor (offset of principal points from the image centre, affinity and orthogonality). Corrected images were again analysed in VisualSFM, and a photogrammetric multi-view stereo method was applied to the corrected images to resolve the scale.
A photogrammetric bundle adjustment with relative orientation parameters of the stereo camera pair as geometric constraints was run on the data to estimate the length of the stereo baseline within the network. This length was compared with the calibrated baseline to estimate a scale factor, which was applied to camera locations and 3D coordinates.
Figure 9. Images were corrected for geometry and radiometry and used in the process of 3D point generation. Level 1 of image pyramid was used for 3D reconstruction.
Although the geometric correction increased the number of points in the final point cloud, the results showed that the quality of the images was insufficient to achieve a dense point cloud (Fig. 9). The result proved the importance of surface texture in generating a dense point cloud and in reducing the level of noise in the points. It was concluded that the more feature points are visible on the object, the more spatial detail and less noise there is in the final point cloud. Having evaluated the quality of images for 3D reconstruction, we tested the feasibility of using photogrammetric multi-view stereo software to obtain a dense and accurate point cloud. Bundler was run on the images to generate a sparse point cloud and estimate the exterior orientation parameters. These data were imported into the Vision Measurement System (VMS) software to run photogrammetric bundle adjustment to improve the precision. Unfortunately Bundler was not able to estimate the exterior orientation parameters accurately and the uncertainty in estimating the base line after resolving the scale was too high (around 5 mm). This result again showed the importance of image texture not only for dense point cloud generation, but also to resolve the scale accurately.
4. IMAGE ENHANCEMENT
The images from the uEye cameras were non-uniformly illuminated and dark in many places. Although the ceiling has a great deal of texture, it was not easy for the MVS algorithms to find correspondence points between image pairs because of insufficient contrast. The objective of pre-processing the images, therefore, was to remove the broad luminance gradients and to amplify the fine detail, especially at edges and points in order to improve the quality of the extracted 3D point clouds.
Figure 10. One of the images before and after filtering (top), and an enlarged detail (bottom).
A new approach was developed, inspired by the Wallis (1976) filter, as described by Mastin (1985) and Pratt (1991), in which the algorithm was modified for greater computational efficiency and to give visually better results (Fig. 10). The image processing was implemented in Matlab (Fig. 11).
dc = 0.95; % desired contrast ratio (0-1) dm = 128; % desired mean (8-bit)
w = 7; % window width (pixels) w2 = floor(w/2); % half width
wsq = w*w;
b = 0.3; % offset (multiplier on mean S) f = 0.3; % fringe gain
Im = single(Image); % assume image monochrome [imh,imw] = size(Image); % image height, width
% Calculate local (adaptive) mean
H = fspecial('average',[w w]);
M = imfilter(Im,H,'replicate'); % local mean D = Im-M; % difference from mean (fringe)
% Calculate local (adaptive) stdev
S = zeros(imh,imw,'single'); for i = w2+1:imw-w2
for j = w2+1:imh-w2
I = Im(j-w2:j+w2,i-w2:i+w2)-M(j,i); S(j,i) = sqrt(sum(sum(I.*I)))/wsq;
end end
% Filter the image
sm = mean(mean(S));
Imw = (Im+f*D)./(S+b*sm); % apply the filter MIm = Imw-mean(mean(Imw)); % zero mean
MI = zeros(imh,imw,'single');
MI(w2:imh-w2,w2:imw-w2)=MIm(w2:imh-w2,w2:imw-w2); MIr = reshape(abs(MI),imh*imw,1);
m = prctile(MIr,99.9); % scale amplitude Im8 = uint8(dm+dc*127*MI/m); % construct output
Figure 11. Matlab code for local contrast enhancement filter, based on the Wallis filter.
Both mean and standard deviation were calculated in a 7x7 region around every pixel. The fringe signal was calculated as the difference between the pixel value and the local mean. In similar fashion to the unsharp mask (USM) function, a fraction of the fringe was added to the image to accentuate edges. Then in an additional step the result was divided by the standard deviation, which had the effect of equalising local contrast, i.e. increasing the contrast in flat areas and reducing it in busy areas. The mean of the 8-bit output image was set to 128 (corresponding to mid grey), and the amplitude of the fringes was scaled so that the 99.9%ile value was 127. Hence the image filled the full data range 0-255.
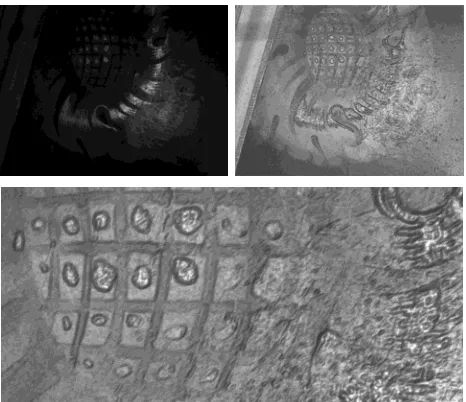
Figure 12. The point cloud (top-left), mesh (top-right), textured mesh (bottom-left) and deviation in mm from a plane fitted to point cloud (bottom-right).
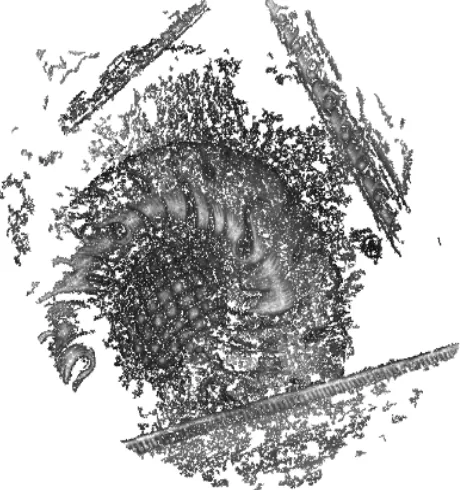
The results of the 3D processing of the enhanced images (Fig. 12) showed that an elevation map could be obtained from the point cloud representation, revealing salient surface features. The pock marks and cracks are clearly visible (Fig. 13), with a depth resolution of ~0.25 mm (i.e. 250 microns).
Figure 13. (left) Point cloud for the second location on the ceiling, tilted; (right) enlarged detail showing crack.
At this resolution the spacing of the points was barely sufficient to resolve the structure, and the point cloud still had many holes. In order to achieve the objective of resolving features of 100 microns, higher image magnification would be necessary. This could be achieved by using lenses of longer focal length, brighter lights and shorter exposure times. It was noted during image analysis that images taken under tungsten halogen light alone were less sharp than those where the LED lights were also on. This was attributed to the relatively poor optical performance of the lenses at infrared wavelengths, with chromatic aberration causing point spread and image blur.
5. CONCLUSIONS
The original objective of the project was to employ digital imaging methods to monitor the fragile condition of the painted ceiling at intervals of three months. We demonstrated that the stereo photogrammetric processing workflow can generate point clouds of sufficiently high resolution if it is given image sets of high quality and sufficient overlap. The main problem faced by the project was the difficulty in obtaining high quality images with the minimal structure supporting the camera rig.
The fibreglass mast turned out to be more difficult to deploy than the aluminium mast used in the previous project for four reasons, which collectively may have implications for health and safety:
• It was heavier to carry to the deployment site, especially the steel base tripod;
• The mast section length of 2.4 metres meant that it was necessary to stand on an adjacent step ladder in order to raise, turn and lower the telescopic sections. This was stressful when working near the gallery rail and drop beyond;
• It took considerable strength to lift the final combined weight of 1.6 Kg for the camera rig, plus 0.8 Kg for the cables, plus 5 Kg for the inner sections of the mast (i.e. over 7 Kg in total), especially when standing on a step ladder and lifting from chest height;
• Turning the mast for successive image pairs required climbing the step ladder, loosening the clamp at the top of the lowest (outermost) section of the mast, turning the inner section and the whole structure above while not changing the height, then relocking the clamp. Although not simple, this proved to be less difficult than raising the mast.
The biggest challenge we faced with this technique was the physical handling and erection of the mast. At the operating height of 7.9 metres, and with the head weight of approximately 1.6 Kg, the mast was only just stable with the limited footprint of the tripod arrangement at the base. Even small variations of a few millimetres in the height of the marble floor tiles caused the mast to lean away from vertical (Fig. 14). Turning the mast for successive image sets then caused the top of the mast to move in a circular locus. Also it was very difficult to predict the exact region of the ceiling that would appear in the image frame when the mast was fully raised, so it was not really practicable to target specific features. This made it nearly impossible to achieve the intended purpose of monitoring the same region in repeated visits at three-monthly intervals.
To implement the method successfully would require a more substantial mast with the following characteristics:
• Broader base and better fixings of the tripod legs (or other bracing means) to achieve more stability of the whole structure, especially on an uneven floor;
• Mechanism to raise and lower the sections of the mast, either by manual crank or electrical motor;
• Fine X-Y positioning mechanism for the head carrying the camera rig, so that it could be manoeuvred into the desired position relative to the ceiling without moving the base; • Mechanism to rotate the mast about its axis, preferably by
electrical means, by a given angle;
• Stiffer structure with dampening to minimise the swaying and oscillation of the cameras.
The ideal would have been the robotic system developed in the VITRA project (MacDonald, 2006).
ACKNOWLEDGEMENTS
This project was supported in part by a small research grant from Historic Royal Palaces. Thanks to Ian Gibb (HRP) for facilitation of the project and assistance on site at Hampton Court Palace. Thanks also to Ian Seaton (UCL Engineering) for fabricating various mechanical components for the rig.
REFERENCES
Ahmadabadian, A.H., Robson, S., Boehm, J., Shortis, M., Wenzel, K., and Fritsch, D., 2013. A comparison of dense matching algorithms for scaled surface reconstruction using stereo camera rigs. ISPRS J. Phot. & Remote Sensing, 78, pp. 157-167.
Baltsavias, E.P., 1991. Multiphoto geometrically constrained matching. PhD dissertation, Inst. of Geodesy and Photogrammetry, ETH Zurich, Report no. 49.
MacDonald, L.W., 2006. A robotic system for digital photography. SPIE Conf. on Digital Photography II, Vol. 6069. MacDonald, L.W., Gibb, I. and Robson, S., 2012. Conservation Monitoring of a Heritage Ceiling by Photometric Stereo. Proc. XXII ISPRS Congress, Melbourne.
Mastin, G.A., 1985. Adaptive filters for digital image noise smoothing: An evaluation.Computer Vision, Graphics, and Image Processing,31(1), 103-121.
Pratt W.K., 1991. Digital Image Processing, 2nd Ed., John
Wiley, New York.
Wallis, R.H., 1976. An approach to the space-variant restoration and enhancement of images, Proc. Sympos. Current Math. Probab. Image Sci., Monterey, Calif, Nov. 1976, pp. 10-12.
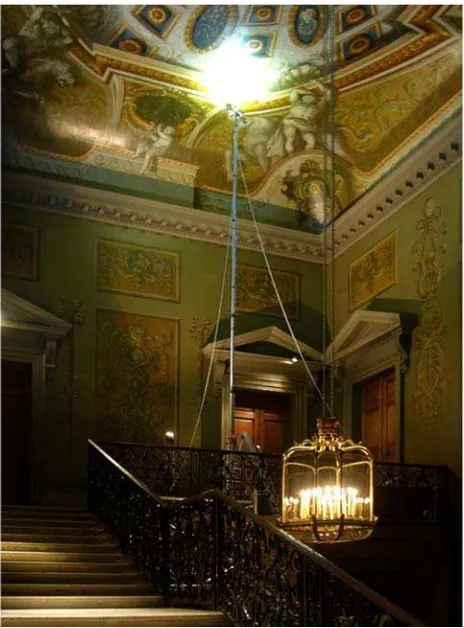
Figure 14. Mast fully raised to 8m above the gallery with the photographic rig operating 60cm below the ceiling.