1
Doctoral Dissertation
Academic Year 2018
Benchmarking Energy Performance of
Accommodation Buildings Using Regression and
ANNs Models
Keio University
Graduate School of Media and Governance
2
ABSTRACT
The accommodation buildings have significant environment and economic impacts in Japan. In the same time, owners and facility managers do great efforts to improve energy performance of accommodation building as respond to new energy policy after great east earthquake in Japan 2011.
The aim of this study is to create an accurate tool to assess the energy use of accommodation building in Kanto area. The study depends on national survey and private data to conduct the current investigation, one of main data source is Database for Energy Consumption of Commercial Buildings (DECC) by Japan Sustainable Building Consortium (JSBC).
The first stage of assessment process is to examine various variables that affect energy consumption of buildings. Therefore, based on this stage some parameters are selected to be the main factors that enable accurate evaluation for energy usage of target buildings.
The second stage of assessment process is to build an appropriate reference that enhances better ability to compare energy performance of selected buildings. A practical benchmark have been developed using statistical approach to find out the impact of selected factors on energy use intensity (EUI) of accommodation buildings in Kanto area.
Third stage, a validation study to examine the accuracy of regression model. It is an important step since the statistical approach is not high accurate approach among other approaches. ANNs model was designed through
3 choosing the best learning method and hidden layers to ensure sufficient accuracy.
Finally, the study applied the previous stages on franchised hotel in Tokyo as a case study to examine the applied methodology of energy assessment.
Study’s results point out the benefits of establishing a benchmark for energy performance of accommodation buildings to enable powerful assessment of energy plan and to create practical tool that supports managers to develop their energy management without affecting facility’s function.
Keywords: Accommodation Buildings, Artificial Neural Network, Benchmark, Database for Energy Consumption of Commercial Buildings, Energy Performance, Energy Use Intensity, Regression Model
4
ACKNOWLEDGEMENTS
First and the most, I would like to express sincere gratitude to Allah,
the Almighty, for giving me the strength and the sustenance while
undertaking this study.
I would like to express sincere thankfulness to my supervisor,
Professor
Wanglin
Yan,
for
his
constructive
guidance,
encouragement, continuous support, patience, and friendly response.
I would also like to thank my co-supervisors, Professor Yasushi Ikeda
for his great support and value suggestion to improve my academic
skills.
I would like to thank Professor Manabu Omae for his kind support
and appreciated suggestions to achieve best results.
I would like to express my thanks to Professor Shaw Rajib for his kind
cooperative and appreciated comments.
My deep appreciation and gratitude to my international co-supervisor,
Professor Ismail Ekmekci for his insightful comments and invaluable
scientific guidance
.Finally and most importantly, I would like to thank my loving parent,
brothers and sisters. Last but by no means least, my pretty wife for
continuous support with endless emotional and spirally support,
encouragement and kindness during my PhD. study.
5
Table of Contents
1. Introduction ... 11
1.1. Background: ... 11
1.2. Research Objectives and Significant ... 14
1.3. Research Framework: ... 16
2. Literature Review ... 19
2.1. Japan’s Energy Sector and Building Management Systems ... 19
2.2. Methods for Improving Building Energy Management ... 24
2.2.1. Indicators of Energy Performance ... 25
2.2.2. Modeling Energy Consumption of Building ... 28
2.2.3. Benchmarking System ... 30
2.3. Accommodation Buildings and Energy Consumption ... 30
2.3.1. The Characteristics of Accommodation Buildings ... 30
2.3.2. Occupancy and Accommodation Energy Consumption ... 33
2.3.3. Weather Conditions/ Energy Use of Accommodation Buildings 34 2.4. Approach for Developing a Benchmark System ... 35
2.4.1. Defining A benchmark System ... 36
2.4.2. Process of Developing Benchmark ... 38
2.4.3. Requirement for Setting up a Benchmark System ... 39
6 3.1. Database for Energy Consumption of Commercial Buildings (DECC)
40
3.2. Quantitating Energy Performance ... 47
3.3. Clustering the DECC Samples ... 56
3.4. Correlation between Energy Use and Occupancy ... 58
3.4.1. Electricity Use ... 59
3.4.2. City Gas Use ... 61
3.4.3. LPG Use ... 62
3.4.4. Oil Fuel Use ... 63
4. Benchmark Energy Performance of Accommodation Buildings ... 66
4.1. Developing Benchmark Using Linear Regression Model ... 67
4.2. Adopting the Artificial Neural Networks Model ... 74
4.2.1. ANNs Design ... 76
4.2.2. Modeling Energy Consumption Using ANNs ... 82
4.2.3. Validation of Regression Model ... 87
4.3. Franchised Hotel ... 91
5. Discussion... 99
5.1. Energy consumption of accommodation buildings ... 99
5.2. Benchmarking Energy Performance of Accommodation Buildings 99 5.3. Robustness of Benchmark ... 100
7
6. Conclusion and Future work ... 103
6.1. Conclusion ... 103
6.2. Limitation ... 104
6.3. Future works ... 105
8
List of Tables
Table 3-1: Approaches for Developing Benchmark ... 39
Table 3-3: Model summary of number of stories, heating, cooling and operation hours .... 46
Table 3-4: the ANOVA results of DECC variables ... 46
Table 3-5: classification of the building floor category (exclude indoor parking area) ... 48
Table 3-6: the center of DECC clusters ... 57
Table 3-7: Clusters of DECC database ... 57
Table 3-8: Correlation coefficient between energy use and occupancy and temperature .... 64
Table 4-1: the performance of the ANN models for different training algorithms ... 80
Table 4-2: The performance of the ANN models for different hidden layers ... 81
9
TABLE OF FIGURES
FIGURE 1-1:BENCHMARK CONCEPT OF ACCOMMODATION BUILDING ... 16
FIGURE 1-2:RESEARCH FRAMEWORK ... 17
FIGURE 2-1:BUILDING ENERGY BENCHMARKING PROCESS ... 38
FIGURE 3-1:THE REGIONS CLASSIFICATION BY DECC ... 42
FIGURE 3-2: ANNUAL PRIMARY ENERGY INTENSITY AND NUMBER OF BUILDINGS IN JAPAN (MAIN REGIONS) ... 45
FIGURE 3-3:ANNUAL PRIMARY ENERGY INTENSITY AND AREA CATEGORIES.2007 ... 48
FIGURE 3-4:ANNUAL PRIMARY ENERGY INTENSITY AND CONSTRUCTION DATE.2007 ... 49
FIGURE 3-5:ANNUAL PRIMARY ENERGY INTENSITY AND NUMBER OF FLOORS.2007 ... 51
FIGURE 3-6:ANNUAL PRIMARY ENERGY INTENSITY AND OPERATION HOURS.2007 ... 52
FIG 3-7:ANNUAL PRIMARY ENERGY INTENSITY AND USING CONDITION PERIOD.2007 ... 53
FIGURE 3-8:CORRELATION BETWEEN ELECTRICITY AND TEMPERATURE ... 54
FIGURE 3-9:CORRELATION BETWEEN CITY GAS AND TEMPERATURE ... 55
FIGURE 3-10:CORRELATION BETWEEN LPG AND TEMPERATURE ... 55
FIGURE 3-11:CORRELATION BETWEEN OIL FUELS AND TEMPERATURE ... 56
FIGURE 3-12:ELECTRICITY USE INTENSITY WITH OCCUPANCY RATE AND MEAN AIR TEMPERATURE ... 60
FIGURE 3-13:CITY GAS USE INTENSITY WITH OCCUPANCY RATE AND MEAN AIR TEMPERATURE ... 61
FIGURE 3-14:LPGUSE INTENSITY WITH OCCUPANCY RATE AND MEAN AIR TEMPERATURE... 62
FIGURE 3-15:OIL USE INTENSITY WITH OCCUPANCY RATE AND MEAN AIR TEMPERATURE. ... 63
FIGURE 4-1:OUTPUTS OF REGRESSION MODEL FOR CLUSTER1 OF DECC ... 70
FIGURE 4-2:OUTPUTS OF REGRESSION MODEL FOR CLUSTER2 OF DECC ... 71
FIGURE 4-3:OUTPUTS OF REGRESSION MODEL FOR CLUSTER3 OF DECC ... 72
FIGURE 4-4:OUTPUTS OF REGRESSION MODEL FOR CLUSTER4 OF DECC ... 73
FIGURE 4-5:TOPOLOGY OF FULLY CONNECTED THREE-LAYERED MLPNETWORK ... 76
FIGURE 4-6:OUTPUTS OF ANNS WITH REAL DECCSAMPLES-CLUSTER1 ... 82
FIGURE 4-7:REGRESSION PLOT OF CLUSTER 1 ... 83
FIGURE 4-8:OUTPUTS OF ANNS WITH REAL DECCSAMPLES-CLUSTER2 ... 84
FIGURE 4-9:REGRESSION PLOT OF CLUSTER 2 ... 84
FIGURE 4-10:OUTPUTS OF ANNS WITH REAL DECCSAMPLES-CLUSTER3 ... 85
FIGURE 4-11:REGRESSION PLOT OF CLUSTER 3 ... 85
FIGURE 4-12:OUTPUTS OF ANNS WITH REAL DECCSAMPLES-CLUSTER4 ... 86
FIGURE 4-13:REGRESSION PLOT OF CLUSTER 4 ... 87
FIGURE 4-14:COMPARISON OUTPUTS OF REGRESSION AND ANNS-CLUSTER1 ... 88
10
FIGURE 4-16:COMPARISON OUTPUTS OF REGRESSION AND ANNS-CLUSTER3 ... 89
FIGURE 4-17:COMPARISON OUTPUTS OF REGRESSION AND ANNS-CLUSTER4 ... 90
FIGURE 4-18:LOCATION OF TWO BLOCKS OF FRANCHISED HOTEL (F1-F2) ... 92
FIGURE 4-19:LOCATION OF TWO BLOCKS OF FRANCHISED HOTEL (F3-F4) ... 93
FIGURE 4-20:LOCATION OF BLOCK (F5) OF FRANCHISED HOTEL ... 94
FIGURE 4-21:LOCATION OF BLOCKS (F6) OF FRANCHISED HOTEL ... 95
FIGURE 4-22:ELECTRICITY USE TREND OF FRANCHISED HOTEL ... 95
FIGURE 4-23:CITY-GAS USE TREND OF FRANCHISED HOTEL ... 96
FIGURE 4-24:ELECTRICITY TREND OF FRANCHISED HOTEL BASED ON DECCBENCHMARK EQUATIONS ... 97
FIGURE 4-25:PREDICTED VALUES OF GROUP (A) USING DECCEQ. ... 97
11
1.
Introduction
1.1.
Background:
Man made his first building as a shelter to protect himself against the harsh weather and defense against outside attack. Gradually, man improve his shelters to adapt different aspects such as climate, location and material. He could developed a large spectrum of buildings that meet his needs and adapt with different conditions around the world. As consequence of advanced knowledge, man could improve most of building’s component such building structure, energy system, energy flow and control. These improvements increase the performance of buildings in term of functionality or thermal comfort. Generally, the usage of buildings depends on energy through different sources such as electricity, Gas, Coal and liquid fuels which are used to run all of building operation systems such as light, ventilation, cooling, heating and other household equipment. That means without energy buildings can not be used or inhabited.
Because of the pressure on the global environment from energy use, the sufficiency of building design converted into the efficiency of building to emphasis the necessity to reduce energy consumption of buildings. In the same time, ensuring healthy and comfortable condition for all types of users. Advance technologies promise significant achievement to save energy and to integrate renewable energy. On the other hand, new regulation, policy and standards have been issued to change new building to be more sustainable.
12 Buildings sector is the third consumer of total energy after industry and transportation sectors in most of developed countries. Both of residential and commercial buildings are major need for human activities either as shelter or work place. In this term, increasing population will rise demand for building facilities accompanied with the long time spent inside buildings. Therefore, the energy efficiency in buildings consider an essential issue for energy policy at regional, national and international levels.
The global contribution from buildings towards energy consumption, both residential and commercial sectors, has steadily increased between 20% and 40% in developed countries [1]. Commercial buildings consist of different types of buildings with variety of function or economic activities. Each type has certain intensity of energy use and has certain contribution to national’s GDP. Accommodation buildings are the most energy intensive among other buildings categories in many countries. Generally, there are many of factors affect the high-energy consumption, some of which are related to building design and operations, weather condition, and occupancy rate and guest behavior. The accommodation buildings are intensive energy among other commercial buildings and have a high potential to reduce its energy consumption. On other hand, accommodation buildings are a main part of tourism sector beside to transportation and other tourism components. Therefore, many researchers, policy makers and other stockholders employ many efforts to improve energy performance of accommodation buildings.
Different procedures can be applied to enhance less energy usage in accommodation buildings such as passive design or renewable integration.
13 However, it is necessary to assess the efficiency of these procedures either comparing to other similar buildings or to certain reference. Therefore, the assessment process requires a powerful reference to compare the energy performance of accommodation building; this reference can be developed as benchmark system based on regression model considering most effective variables. Benchmark system is adopted using several approaches. Regression model provides valuable benchmark equation which weighs the impact of variables. However, regression model has low accuracy comparing to other approaches, because of that; ANNs model is used to validate regression results. In Japan case, the accommodation buildings include western style of hotels, city hotel, business hotels, Traditional hotels (Ryokan) and Inns. The study covers all categories of accommodation buildings regardless the classification, size, age, ownership and functions. In addition, the study performed in regional scale to enhance future work on national scale.
This research evaluates the energy performance of accommodation building within Kanto region in Japan. This area was selected to represent the whole trend of Japanese accommodation buildings. The selection of Kanto region was based on the highest number of survived buildings with high annual primary energy intensity among other regions. Other aspects about choosing the case study will be offer in third chapter. The study reports the importance of building’s physical parameters, operation parameters, energy intensity, and weather and occupancy rate to assess the energy performance of accommodation buildings.
14 Other variables such as end user behavior, sub-system performance, employee density and the breaking down of energy use will not be included in this investigation. Since to cover all variables and parameters requires very detailed survey, which is not available within this study. It does not focus on macro or micro scale where detailed investigation are required for individual buildings.
Despite of great efforts to improve the energy performance of accommodation buildings in Japan, there is no reference to evaluate the output of these efforts. Therefore, this study seeks to develop a powerful benchmark to enable different stockholder in hospitality sector to assess their energy plan or management. The availability of DECC database have not been used yet to achieve such aim for different categories of commercial buildings.
1.2.
Research Objectives and Significant
The main aim of current research is to assess the energy performance of accommodation buildings in Kanto region-Japan. Three sub-objectives are required to achieve the main goals, which are:
To examine the role of physical variables of building, operation variables and occupancy rate on energy consumption. The correlation between energy consumption and occupancy rate will be investigated deeply because of controversial relation between each other.
To develop a benchmark system using regression model to compare the energy performance of accommodation buildings with their peers of the same group.
To design ANNs model by selecting the best learning method and the hidden layers to adopt an accurate ANNs model to validate regression model.15 Study’s benchmark supports improving the economic performance of buildings by reducing energy cost and improving the reputation of accommodation facility as sustainable building. The reduction of energy consumption will reduce the CO2 emission and using other natural resources that means better environmental performance. The research has social contribution through increasing awareness about energy saving, providing sustainable facilities that sustain quality level with less energy and natural resources.
Nowadays the improving of energy performance of commercial buildings is an urgent issue because of its contribution in energy usage and environmental impact. The accommodation category is one of energy intensity category in Japan. Therefore, it is an essential to evaluate the energy performance and to investigate the main variables which affect the energy use. In addition, it is necessary to develop a reference to evaluate the energy performance of energy management off accommodation buildings.
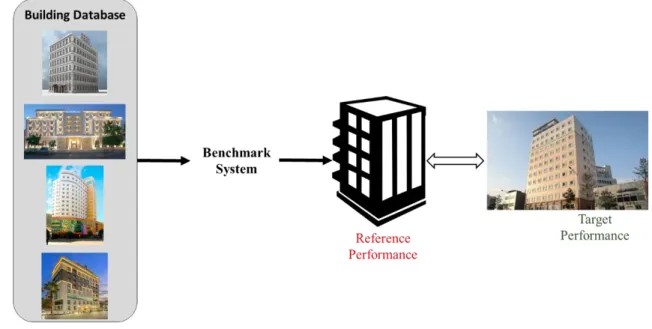
According to the above, the current research aims to assess the energy performance of accommodation buildings in Japan, few studies was done to cover accommodation buildings that most studies focused on office buildings. The study aims to present the first reference/ benchmark in Japan which can be used to assess the energy use of accommodation buildings. Therefore, this study will be a yardstick for owners, managers and other organization’ bodies to assess the performance of existence accommodation buildings as shown in figure (1-1). The regression model used to find out the benchmark equation. However, ANNs model was used to validate the regression model. A
16 precise design was adopted for ANNs model by selecting learning method and hidden layer, this step ensures accurate outputs of ANNs model.
Figure 1-1: Benchmark Concept of Accommodation Building
Finally, this study can be extended to include the whole Japan after performing some climate/ weather correction for future studies. Moreover, it can be deployed to include various categories of commercial buildings with consider different variable due to the function of building
1.3.
Research Framework:
The research is framed into six main stages: data acquisition and preparation, energy modeling using regression model, model design of ANNs, comparison study and case study implementation. As shown in Figure 1-1. The figure illustrates the detailed stages of current work; the data collection is the start point of benchmarking process where the DECC is the main source of data to develop proposed benchmark of energy performance.
17 Figure 1-2: Research Framework
This thesis consists of six chapters. An outline of each chapter is given as follows.
Chapter 1 presents an introductory text to the whole research work. Firstly, it presents the background of the study, with focus on energy use in accommodation buildings. Then, the tourism industry in Japan is introduced. Other issues related to research such as Objective, significant and others are introduced in this chapter. At the end, organization of the thesis is outlined, so that the reader knows what to expect in the following chapters.
In Chapter 2, previous research work related to the current study will be reviewed. It includes various aspects of energy use of buildings and its environmental impact, energy use of commercial buildings, accommodation building as intensive energy. The relation between the occupancy and energy consumption. Finally, the effect of weather condition on energy consumption.
18 In Chapter 3, examines the various factors affect energy performance of accommodation buildings. In addition, the correlation between energy consumption and outdoor weather conditions is included. A descriptive analysis applied to correlate the energy use with occupancy rate and outdoor air temperature. The analysis covers different forms of energy use, such as electricity, gas, and oil fuels.
In Chapter 4, introduces the benchmarking system of DECC by using regression method. A regression model was used to find out the benchmark equation of selected samples of DECC. The impact of target variables was calculated and the relation between real and predicted values was illustrated in graphs. Artificial Neural Network (ANN) model was implied to validate the benchmark results by regression model. ANN uses the same samples of regression model and same input variables.
Chapter 5 presents a discussion regarding previous four chapters and research’s finding. The chapter summarizes the energy us in accommodation buildings and the procedures of developing benchmark of energy consumption. The reliability of benchmark have been introduced them to sum up chapter with research’s contributions.
Lastly, the study is concluded in Chapter 6, which summarizes the research objectives, research design and also the main results of data analysis. Contributions made by the study will be presented; agreements as well as disagreements with previous research work will be noted. In addition, the chapter also will be discussed the limitations of this study and suggestions for further research.
19
2.
Literature Review
This chapter reviews previous research work related to the current study. It includes various aspects of energy use in buildings and its environmental impact, improving the energy performance of buildings, energy use of commercial buildings, accommodation building as intensive energy, energy-use in accommodation buildings, the occupancy and energy consumption, the effect of weather condition on energy consumption and finally benchmark system in details. Japan’s Energy Sector and Building Management Systems
2.1.
Japan’s Energy Sector and Building Management Systems
Building is a basic human activity and is an essential component of sustainable development. The multiple functions of the accommodation sector require different types of energy usage. Therefore, energy in various forms (e.g., electricity, diesel, and LPG) are often required in a building. Furthermore, one energy form is sometimes used for multiple tasks; for example, electricity is used for lighting, air conditioning, and many other functions. The fuel variety can depend on the climate zone in which the building is located. Typically, gas and oil are used more for heating in cold climates, whereas electricity may be required more for cooling in tropical or hot climates.
As a major sub-sector of the tourism industry, the hotel sector accounts for a significant amount of the overall resource consumption in the world's largest export industry, as well as for a substantial portion of the environmental impacts it generates[2]. The percentages of different fuels depend on accommodation type and class. For instance, the accommodation sector in
20 Vietnam uses various proportions of electricity. Resorts and 4-star hotels have a relatively low percentages of electricity use at 66% and 76%, respectively, whereas 2- and 3-star hotels depend nearly entirely on electricity, accounting for over 90% of total energy consumption[3].
The accommodation industry is considered the most environmentally harmful portion of the hospitality sector because of its considerable consumption of natural resources and production of waste[4]. Most environmental damage influences the air, water, and soil because of the extreme consumption of non-recyclable goods, water, and energy for heating, ventilation, and air conditioning [7]. For instance, two groups of hotels in Europe discharged approximately 160-200 kg of CO2 per m2 of room floor area per year, produced 1 kg of waste per guest per night, and used 170-440 liters of water per guest per night [8]. Buildings are responsible for a considerable amount of greenhouse gas emissions, energy and raw material use, waste, and changes in land use dynamics [9].
Furthermore, the growing number of tourists worldwide has increased occupancy rates and the consumption of energy and resources, thereby creating an increased ecological footprint for accommodation buildings [10]. This trend has an obvious effect on the environment when compared with other commercial buildings of similar size because of high energy and resource consumption [11]. In other words, the environmental footprint of accommodation buildings is typically larger than those of other buildings of similar size [12]. Notably, the rapid growth of energy use worldwide has raised
21 concerns regarding supply difficulties, the exhaustion of energy resources, and severe environmental impacts [13].
This extensive consumption of natural resources and the resulting environmental impacts have prompted the accommodation sector to enhance sustainable tourism practices [14]. In addition, this problem requires more attention to environmental issues, policies, and daily routine practices [15]. There are social and environmental problems related to the increasing of energy use. Some of them are not obviously, but we have to survive its effects in the end. More of social/ Culture impacts can be recognized from accommodation sector that can not be measured easily such as the cross-cultural exchange. Therefore, more studies are required to investigate the contributions of accommodation sector in either city or countryside.
Japan imports 91.3 percent of its energy supply. After oil crises of the 1970s, Japan has taken actions to promote energy conservation, find alternatives to petroleum, and secure supply of petroleum. However, after the Great East Japan Earthquake, the percentage of fossil fuels has been increasing, as a substitute for nuclear power as fuel for power generation[13]. Nowadays, despite the actions for decreasing the dependence of energy imports, Japan still considers as one of the most volatile countries in the world. Therefore, different organizations and government-bodies, public institutions, economic agents and researchers concern about energy security [14].
Japan's final energy consumption has trended downward since fiscal 2005. In fiscal 2012, the total primary energy supply in Japan was 21,710 petajoules. While energy consumption in the industrial sector has remained
22 level, there were sharp increases in energy consumption in the commercial and residential sector and in the transport sector. In the commercial and residential sector, energy consumption by the commercial sector in particular has risen in recent years[13].
There are two Japanese governmental programs which intend to enhance energy management by firms. One is regulation on firms by Energy Conservation Law, and the other one is free-of-charge energy audit programs by governmental subsidiary organizations. Energy efficiency policy has an important role to remove market barriers to energy efficiency.
There are three approaches in such policy intervention. One is regulation. This approach includes technology standards, performance standards, and management standards. The last type, which is also called enforced self-regulation or management-based self-regulation, is a way of self-regulation which requires firms to have some kind of management systems, and the firms determine the details of the management systems by themselves [15]. Japanese Energy Conservation Law on firms is a good example of management-based regulation. The second approach is providing information and education, such as guidelines, manuals and training. Energy audit programs in Japan belong to this category.
The law was established in 1980 and has been amended in 1993, 1998, 2002, 2005, and 2008. Every time it was adapted the regulatory requirements have became stricter in scope and obligations. It covers large facilities consuming more than 1,500 kilo litters in crude oil equivalent per year (approximates 3,000 t-CO2 per year) are regulated. The regulated firms sum up
23 to more than 14,000 facilities and their energy consumption consist of 90% in industrial sector, and 10% in commercial sector[16].
The energy conservation standards for housing and building were first established in 1980 as a part of the revised Energy Conservation Act. These energy conservation standards are called the “Standard of Judgment” in the Act. The “Standard of Judgment” is a set of regulatory reference standard and the construction clients of housing and building that fall in the designated group under the Act are recommended to use in implementing their energy conservation obligation as mandated by the Energy Conservation Act. The key obligation includes an annual report on energy conservation measures which shall be submitted by regulated construction clients of housing and building to the government. Since the inception, there were several revisions of the standards regarding this sector in 1992, 1999, and 2012. In the Basic Energy Plan published in 2014, the government plans to strengthen these standards for building and housing towards 2020 in a step by step approach[17].
The direct contribution of Travel & Tourism was 2.4% of total GDP in 2014, and is assumed to rise 2.8% of total GDP in 2025. The total contribution of Travel & Tourism to GDP was 7.5% in 2014, and is forecasted to rise 8.1% in 2025. In addition, Travel & Tourism directly supported 1,152,500 jobs (1.8% of total employment). The growth is expected to rise by 2.2% of total employment in 2025. Travel & Tourism investment in 2014 was JPY3,341.8 bn, or 3.1% of total investment. It should rise to JPY4,018.1bn in 2025 (3.2% of total) [18]. In Japan, the increase in commercial sector energy consumption is almost fully caused by the increase in the total floor area of commercial
24 buildings [19]. Energy consumption of the hotel sector in Japan has been specified as one of the large energy consumers among commercial buildings about 3,421MJ/m2 annual load [20].
Generally, Japanese accommodation facilities can be divided into hotels, traditional inns, family-run guesthouses, pensions and membership resort clubs. Japanese-style inns and guesthouses continued to decline, but hotels grew in scale and number according to JETRO, 2007. Japanese accommodation buildings consist of hotels that simulate the western culture and Ryokan that preserve the traditional culture of Japan[20].
2.2.
Methods for Improving Building Energy Management
Energy is one of the most difficult fields to manage especially when it comes to building sector due to many factors that can influence on energy performance as in accommodation sector. There is no specific strategy to follow; many energy agencies and governmental officers have established general guides and tools to help building managers to adjust them for their own needs.
Many management studies dominated the competitiveness of a country firms from the performance of its facilities. At the national level, it is reflected in the performance of the economy, while at the operational level, it is viewed in terms of the market share secured by an enterprise[21]. On top of saving utilities bills, how to link the energy management to business advantages is an area under investigation. For example, the Ecolabel, Green Hotel, etc. are an excellent market tools to promote the hotel’s image to the existing and potential
25 customers, in additional to the benefits of reducing energy costs and improvement of environmental quality standards[21].
As the energy performance becomes part of the hotel management measures, in the hospitality industry, it is already quite common to used key performance indicators for assessing its business operations. However, energy benchmarking will only become a major force in the supply chain when it becomes a selection criterion for guests, through travel policy changes either for major stockholders/ governments or through inclusion in the facility quality star rating system. Education and information is the key to achieve this.
2.2.1. Indicators of Energy Performance
The energy performance in buildings is affected by various factors, such as ambient weather conditions, building structure and characteristics, the operation of sub-level components like lighting and condition systems, occupancy and their behavior [22]. The physical parameters of the building affect the resource consumption in accommodation buildings. These parameters include size, building design, geographical and climatic location, type of energy, type and amount of available local resources and energy and water use regulations and cost [6]. Due to accommodation buildings function and operation, it consumes large amount of energy [23][24]. Moreover, the round-the-clock operations drives to excessive use of energy in accommodation buildings [25].
In the built environment, an Energy Use Index (EUI) is widely used to represent the overall energy performance of a building, using its performance to be compared against another, as in benchmarking processes. In general, the indicators are commonly expressed in kWh/m2/year or MJ/m2/year, also It can
26 be kgCO2/m2/year which expresses an overall CO2 emission per unit floor area [26]. By normalizing various Factors of energy use, the EUI can be used to compare energy performance between buildings to highlight the inefficiency of a building or its services.
Floor area is the most widely used denominator; there is a large variation in conventions for measuring floor areas such as the Treated Floor Area (TFA) used by building services engineers; Net Internal Area (NIA) or Net lettable Area (NLA) widely used in commercial properties; and Gross Internal Area (GIA) commonly used by design and building teams Bordass (2006). In addition, there are other types of indicators used in certain types of buildings in which other characteristics of buildings or businesses are considered to represent energy use better than the floor area. For example, number of meals served in hotel buildings in Singapore (kWh/room) [27], the number of persons (household) in a residential building in Brunei Darussalam (kWh/person) [28], it can be the number of pupils in a school, or the numbers of bedrooms in a hotel.
These indicators were however deemed insufficient as performance indicators for motivating energy efficiency of buildings through comparison of energy performance, due to a lack of understanding of how effectively a building will be used once it is occupied. In accommodation buildings, The benchmark are measured by energy use intesity (EUI) which is typically expressed in the unite of building consumption per floor area per year, per guest per year or per guest night [29][30].
Saving energy is one of the most important global challenges in nowadays. In the meantime, environmental concerns drive this trend much
27 further. In order to reduce greenhouse gas (GHG) emissions, which are considered to be reason of global warming and sources of pollution, the Kyoto protocol set specific targets for reduction of CO2 emissions. This situation has encouraged two important initiatives. First, efforts on producing electricity with higher efficiency; Second, on using electricity with higher efficiency and more efficient use of energy not only reduces the consumption of electricity, but also lowers the consumption of primary energy sources.
Buildings, whether residential or commercial, mainly use energy to attain comfort for their residents. Although comfort includes visual and ergonomic, the main concern is about thermal. Air conditioning used to maintain comfort nowadays but utilities high energy. In order to reduce energy utilization of buildings, several passive techniques are introduced in attaining thermal comfort [31].
Passive cooling systems depend on non-mechanical methods to achieve the thermal comfort inside building and reduce the impact of buildings on the environment. Passive cooling techniques can save energy in buildings by decreasing the required cooling load [32]. Earth-Air Heat Exchanger (EAHE) is a passive cooling technology that uses the earth as a heat sink. This technology can be applied into conditioning system through three primary methods: direct, indirect, and isolated method.
EAHE system takes advantage of the high thermal inertia of the soil where at sufficient depth the ground temperature is lower than the outside temperature in summer. The fresh air is drawn inside the EAHE system to cool it before carry it out inside the building. EAHE system can supply conditioned
28 fresh air to air-conditioning units which could reduce value percentage of electricity consumption in the building [33].
Earth-Air Heat Exchangers have been defined as “a system of pipes that utilize the earth near constant temperature in order to cool or heat air or other fluids that move through the pipes. It can be used as a passive cooling or heating system for residential, commercial, industrial or agricultural applications” [34]. In certain areas or applications, EAHE system can be used as alternative system to conventional air condition system that could possibly reduce energy consumption [35] [33] [36][37].
The using of EAHE system becomes common as a passive technique in buildings to reduce the required cooling or heating demand. But this implementation requires large surface of area for their installation and using of large diameter tubes to reduce the pressure drop [38]. EAHE system is used as a passive technique from long time ago for heating and cooling usage [39]. Other passive solutions will improve the energy performance of accommodation buildings and decrease the environmental impact of using fusel fuel energy.
2.2.2. Modeling Energy Consumption of Building
The energy system of a building is affected by many factors, such as the weather conditions, building structure and properties, and occupants and their behavior [21]. Due to the complexity of the energy systems of buildings and the necessity to obtain accurate predictions of usage, many approaches have been proposed to solve this complicated issue, including elaborate and simple
29 methods. These methods are used in different applications, such as designing new buildings and operations or retrofitting existing buildings. Many works related to energy modeling and the prediction of building energy consumption use different methods, including engineering, statistical analysis and artificial intelligence methods [22]. Additionally, many software programs, such as Energy Plus, have been developed to assess energy consumption in buildings [23] [24]. Although these tools are accurate, they have some limitations related to using detailed parameters as inputs and require a high level of experience to ensure effective use [25].
Statistical models, such as regression models, have been widely used for building energy assessment [26]. These models correlate energy consumption with effective variables and depend on historical data. Although these methods are easy to implement, they are generally less accurate than complex methods.
Artificial intelligence (AI) methods are widely used to solve linear and nonlinear problems involving complex applications. Artificial neural networks (ANNs) and support vector machines (SVMs) are the most widely used models applied in building energy prediction [27][46]. AI methods have high accuracy in term of result outputs, but it require high detailed date and high skills to run the analyzing process.
Energy performance assessment schemes and methods are developed mainly for two goals: energy classification and energy performance diagnosis. Energy classification provides constant or authorized means to illustrate a building’s relative energy efficiency and carbon emissions to both the owners and the public to encourage ongoing efficiency and conservation gains. Energy
30 performance diagnosis aims at detecting faults and describing the causes of poor performance in buildings, and accordingly providing specific energy efficient measures to improve energy performance.
2.2.3. Benchmarking System
Benchmarking system in building sector for energy consumption is a process to investigate the energy performance of buildings with its own history or peer buildings, this action is an essential step to evaluate the efficiency of all applied energy plans and energy management in selected buildings. So that the goal of improving performance and saving energy of buildings can be fulfilled. In this section, previous research will be reviewed in order to demonstrate the purpose and the process of building energy benchmarking; then, previous research regarding benchmarking using regression analysis and ANNs will be summarized.
2.3.Accommodation Buildings and Energy Consumption
It is necessary to understand the properties of accommodation buildings to be able to evaluate the energy consumption. Up to facility’s function, different forms of energy can be used to meet the energy demand.
2.3.1. The
Characteristics of
Accommodation BuildingsGenerally, accommodation building as a system consists of several sections depending on the services provided. The basic section is guest room, it occupies between 65 and 80 % or more of the total building space [47][48]. A full service building uses 70 to 80 % of its space for guest rooms and corridors. The size of guest rooms varies in area, from about 20 m² for a typical European hotel to over 76 m² in deluxe hotels and suites [47].
31 Guest rooms are one of the main sources of hotel revenue [49]. The guests mainly spend their time in their guest rooms. For this reason, hotels put considerable resources into providing a pleasant and comfortable atmosphere in the guest rooms. Public zones are another large area that makes up an accommodation building. These areas are the lobby, food and beverage outlets (bars, restaurant, dining hall), hallways, staircases, conference rooms, meeting rooms, health and sport facilities (gym, swimming pool, dressing rooms, massage rooms) and public washrooms [49]. A hotel as a facility provides different services to its customers. Basic services are lodging and food and beverages but it can accommodate all kinds of other activities, such as entertainment, training events, cultural activities, exhibitions, conferences, education, etc.
Accommodation buildings are divided into two basic types, which are: full-service and limited-service hotels, depending on the number of services provided. Full-service hotels offer full service around the clock, seven days a week. Such an operation demands intensive use of energy/water/consumables for lodging, kitchen, restaurant, conference and recreation/relaxation premises, etc., which also generates significant waste.
Studies in many countries detected that accommodation buildings are one of the most energy intensive building categories. A study carried out on 158 Hellenic hotels to estimate the energy saving potential. Where he found the annual average total energy consumption in those hotels was 273kWh/m2. On other hand, the annual energy consumption in office and school buildings was only 187kWh/m2 and 92kWh/m2 respectively [50].
32 In Europe, a study of energy consumption in 184 Hilton and Scandic Hotels conducted and mean energy use indicators of 364 kWh/m2 and 285 kWh/m2 were reported for both hotel groups [6]. An investigation of the energy performance of 19 Ottawa hotels in Canada, reported the average energy use intensity to be 612kWh/m2 [51]. Another study carried out in 36 hotels in Hong Kong reported the mean energy use intensity to be 542kWh/m2[52].
As mentioned before, the multifunction of accommodation sector, it requires different needs of energy use. Therefore, energy in various forms (e.g. electricity, diesel, and LPG) is often required in a building [53]. further, one energy form is sometimes used for multiple tasks, for example, electricity for lighting, air conditioning as well as many other functions. The variety of fuel depends on the climate zone it is located in. typically, gas and oil used more in cold climate for heating, while electricity may require more for cooling in tropical or hot climate.
In Ottawa hotels, three different types of energy used. Electricity and gas represented 36% and 51.1% of the total energy consumption respectively, with the rest provided by steam [51]. The percentage of total energy consumption supplied by electrical is much higher in Hong Kong hotels, 73% of the total [54]. A study of hotels in New Zealand had a similar result with that reported in Hong Kong, which shows that electricity provided more than 70 % of the total energy requirements [48].
The percentage of different fuels depends on accommodation type and class. For instance, accommodation sector in Vietnam has different proportion of electricity use. In resort and 4-star hotels has relatively low rate of electricity
33 use 66% and 76% respectively, whereas the 2 and 3- star hotels depend nearly fully on electricity. It accounts over 90% of total energy consumption [3]. A possible reason is determined by government’s energy policy and regulations on estate development.
2.3.2. Occupancy and Accommodation Energy Consumption
As a general anticipation, many would expect that a building’s energy consumption is affected by its occupancy rate, but most studies have not proven a clear correlation between energy consumption and occupancy rate. For instance, a study of energy use intensity against the annual mean occupancy rate of 16 Hong Kong hotels was conducted, and no clear relationship could be addressed [52]. In New Zealand’s B&B and backpacker, Correlations between energy consumption and occupancy rate were plotted to be statistically significant, though the R2 were generally low [48].
However, some studies found statistical relationship between energy consumption and occupancy rate in individual hotels. In Hong Kong, a regression model assumed to correlate a hotel’s monthly total electricity consumption with outdoor air temperature and number of guests. In that case, the high R2 of 0.93 shows a strong correlation [52]. An exponential relationship between monthly electricity consumption and number of guests in a five-star Cyprus hotel specified by [55]. The regression model supposed accordingly fits the data very well, with an R2 of 0.95.
It is possible to consider the occupancy rate for citizens and foreigner in Japanese case because the behavior of both cases are not similar. In Turkey, the occupancy rate among citizens and foreigners are different from city to
34 another[12]. This separation can help to understand the energy use in accommodation buildings
Finally, the improving of energy performance of accommodation facilities will enhance good price for gusts that means increasing the occupancy rate in more efficient buildings.
2.3.3. Weather Conditions/ Energy Use
of
Accommodation BuildingsBuildings experience different weather conditions depending on the climate zones where they are located. To maintain the same level of indoor comfort, those in very cold or hot climates usually need more energy intensive than other buildings in more temperate climates. In some cases, the same building also goes through very different weather conditions; in subtropical regions, for instance, a building may have both cold winters and hot summers, hence heating and cooling in two seasons.
In Hong Kong hotels, a study showed very good correspond between monthly electricity use and the match monthly mean outdoor air temperature [54]. A study in Swedish hotels reported confused results. Some hotels indicated significant negative correlation between electricity use and temperature, other hotels showed no significant correlation [56].
Weather will affect energy consumption by changing how consumers react to weather condition[57].
Recently, researchers focus on sustainability; how climate change will affect tourism and how destinations can be adapted. Therefore, significant attention is
35 paid to hospitality sector as a contributor to greenhouse gas emission and how to mitigate it.
2.4.Approach for Developing a Benchmark System
Benchmarking have been used widely in industrial sector to evaluate the performance of different manufacturing process through production line. The concept is used in other sectors and fields such as business, marketing and energy field. The benchmarking process verifies based on the applied scope and the aim of the benchmark system, different approaches and techniques can be used to perform benchmark study.
There are two fundamentally different approaches that are used to analysis or design systems in engineering disciplines: down and bottom-up. A top-down approach refers to the way in which a system is designed by first formulating an overview without details of the sub-systems. The bottom-up approach on the other hand refers to ways in which whole-building energy benchmarks are built up by aggregating system-level information. For example, benchmarks for accommodation would be derived by first estimating the energy performance of individual systems, such as the ventilation or condition systems. These system-level consumption figures would then be aggregated together into a single EUI representing the hypothetical performance of a whole building. The system would then be refined further, subject to the availability of more detailed information. A bottom-up approach on the other hand would involve specification of lower-level system information that would then be used to build up a more precise overview.
36 In the field of benchmarking, the top-down approach can be referred to ways in which energy benchmarks are derived based on building-level energy performance figures. These benchmarks are usually expressed as energy use intensities (EUI) and indicate how other buildings with similar demand use energy.
2.4.1. Defining A benchmark System
In the Cambridge dictionary, benchmark is defined as “to measure the quality of something by comparing it with something else of an accepted standard”[58]. The practical definition of benchmarking as developed at Xerox. In the built environment, often benchmarking is applied as part of an energy management practice in existing buildings to evaluate and improve their energy efficiency according to CIBSE 2012[59].
Building energy performance is a term to refer the quantity of energy consumed in a building, which can be introduced by one or more indicators [60]. For example, a widely used indicator is the annual building energy use per gross floor area, which has the unit of KBtu/yr-ft2. Generally, building energy performance assessment can be divided into two categories: energy classification and performance diagnosis. Energy classification is defined as “providing uniform means to communicate a building’s relative energy efficiency and carbon emissions to both the owners and the public to encourage ongoing efficiency and conservation gains” [61]. The concepts of benchmarking, rating and labeling all under this category.
Building energy benchmarking is a simple, straightforward and low-cost method to inform decision makers of a facility’s energy performance score by
37 comparing a whole-building energy performance of the assessed building against reference benchmarks. Therefore, the objectives of building energy benchmarking can be summarized as: 1) introducing a reference to assess the relative energy performance of the target buildings. 2) alerting concerned stockholders to poor energy performers. 3) indicating the need for energy management to decision-makers, such as building owners, architects, engineers, and energy managers; and 4) providing a pre-retrofit baseline, so that it could be possible to estimate energy savings of installed conservation measures (ECMs) during the retrofit.
Building energy benchmarking belongs to a sub-category of building energy performance assessment. Building energy performance is a term to refer the quantity of energy used in a building, which can be represented by one or more numeric indicators [60].Building energy performance assessment can be generally classified into two categories: energy classification and performance diagnosis. Energy classification is defined as “providing uniform means to communicate a building’s relative energy efficiency and carbon emissions to both the owners and the public to encourage ongoing efficiency and conservation gains” [61]. The concepts of benchmarking, rating and labeling all belong to this category.
Building energy benchmarking is a simple, straightforward and low-cost method to inform decision makers of a facility’s relative energy performance level by comparing entire of building energy performance of the assessed building(s) against reference benchmarks [62].
38 2.4.2. Process of Developing Benchmark
The building energy benchmarking process consists of four stages, shown in Figure 2-1 [1]. First, the building energy database needs to be established in order to collect and archive the building energy information. Then, energy usage of the assessed building(s) should be calculated, and an indicator of the building energy performance should be selected and quantified as well. Third, conduct a comparative analysis in order to define best practice examples, as well as the worst case scenario. Last, cost-effective ECMs will be recommended.
Figure 2-1: Building Energy Benchmarking Process
The first step in a benchmarking process is to collect building energy related information with a representative sample of buildings. It is difficult and time-consuming to collect such amount of data including not only energy consumption, but also variables having influence on energy performance, such as number of occupancy, activity type, system specifications, temperature set points, site information, etc.
In the second step, energy consumption needs to be quantified first in order to obtain the energy performance indicator. The next step is comparative analysis, which is the core of benchmarking. In this step, building energy performance indicator of the assessed building(s) is evaluated against certain criteria, such as available reference. The analysis helps to identify the relative
39 energy performance of the assessed building(s), thus enabling ranking the candidate buildings for future energy plan. The analysis’ results might also give guide on potential energy management, which would help to improve energy efficiency of the buildings.
2.4.3. Requirement for Setting up a Benchmark System
There are many goals of benchmarking of commercial buildings. Therefore, many approaches are utilized to benchmark buildings according to proposed aim and availability of data. In the same time, establishing benchmark imposes certain requirements to develop robust benchmark. Database is an essential part of setting a benchmark, sufficient dataset with acceptable quality are required. Analysis approach is another part to interpret dataset into guideline for compression process. Different factors determine the adequate approach to analysis dataset such as aim, scope, accuracy, complexity and the character of dataset itself. Statistical, engineering and simulation approaches are used in different studies to analyze energy performance for various buildings categories. Main approaches are listed in the table (3-1); These methods are classified according to different aspects related to usability, accuracy, structure and required inputs.
Table 3-1: Approaches for Developing Benchmark
Methods Complexity Usability Accuracy Inputs
Simulation (Engineering) Fairly high No Fairly high Detailed Statistical Fair Yes Fair Historical data Artificial Neural Networks High No High Historical data Support vector machines Fairly high No Fairly high Historical data
40
3.
Analysis
of
Energy
Performance
in
Accommodation Building
This chapter consists of the description of database of accommodation buildings. Database includes energy consumption data and building’s characters. The database was quantified to have more clear understanding of the impact of different factors.
3.1.
Database for Energy Consumption of Commercial Buildings (DECC) The availability of data of energy consumption is the main obstacle to assess the energy consumption of commercial buildings. There are many reasons make the accessibility into data related to privacy issue or lack of documentation. The quality of data, collecting interval and size of data play an essential role to assess the energy performance of buildings.The data used in the present analysis was taken from two different sources. First, Database for Energy Consumption of Commercial Buildings (DECC) from Japan Sustainable Building Consortium (JSBC). Second, Occupancy data from Ministry of Land, Infrastructure, Transport and Tourism (MLIT) under project name (overnight trips statistical survey).
The “Data-base for Energy Consumption of Commercial building” (DECC) disclosed the energy consumption data of commercial buildings. The DECC project established with the support of the Ministry of Land, Infrastructure, Transport and Tourism, and the energy industry. In addition,
41 DECC research committee collected the data examined thereafter and updated the consumption data as the 2013 version, and will be disclosed later.
The DECC currently allows users to access data for 38,273 samples. Approximately 9,000 samples were added in 2006, 16,000 samples in 2008. The data collected focused mainly on areas that were under an advisory to reduce power consumption. Furthermore, the DECC contains a statistically significant number of data sets for most building types.
There are few studies that used the DECC for analyzing the energy performance of commercial buildings in Japan from different prospective such as the impact of temperature on energy consumption[63] or comparing the energy consumption based on floor area of retail buildings[64]. Except the combination between department store and shopping center, these retail categories showed a significant difference in the total floor area and/or annual energy consumption per total floor area. Another study depended on DECC to develop a nationwide database on CO2 emission and water usage of commercial buildings[65]. The estimation of energy saving of office buildings in 2009 using DECC was analyzed[66]. Not only for energy analyzing but also for other aim such as analyzing water consumption of buildings[67].
The overnight trips survey established to investigate the actual number of guest of accommodation facilities on national scale. The survey classified the monthly data according to the purpose of visit (tourism or non-tourism), the number of employee, international or domestic guest and the other criteria for 2007 until 2015. The survey includes the number of surveyed, number of guest and occupancy rate for each prefecture in Japan. In addition, a franchised hotel
42 Kanto area will be examined in the current study to examine the used data that are used from previous sources. The franchised hotels contains six block in different location with different size.
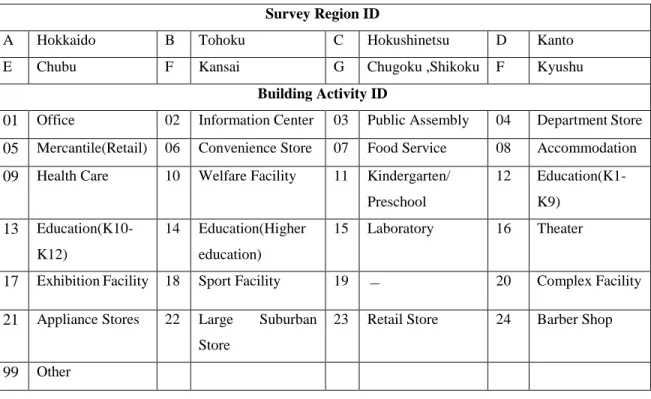
As described earlier, the data of energy consumption and occupancy rate contain manifold data in many categories. Therefore, more filtration and classification of obtained data have to take place to minimized the size of unused data and ensure the quality of selected database. For example, DECC has eight main regions as shown in figure (3-1). Each region classified commercial buildings into 12 categories. While each building ID has a reference letter to indicate its main region.
Figure 3-1: The Regions Classification by DECC
The current study depends on the DECC segments to ensure accurate usage of data. According to coding system of DECC, it is possible to recognize
43 the sample location as regional scale. Unfortunately, it is not possible to have more detailed location. Current study cover Kanto region that have similar climate zone that will eliminate the effect of location for selected samples.
Kanto region was selected as case study; it includes Kanagawa prefecture, Tokyo City, Chiba city, Saitama city and main part of Gunma city. Kanto region are coding with “G” as ID for all commercial buildings. Some part of selected cities are not included in this survey but such point will not affect the quality of database. In addition, DECC research committee classified the commercial buildings into 24 categories as shown in table (3-2). DECC has variety of commercial buildings with different functions. The main factor of this classification is building function that characterizes the energy consumption trend for each category. In the same time, each category has various type, size and class of building such as accommodation, retail, food services and other.
Table 3-2: Component of Building ID, DECC project, Japan Sustainable Building
Survey Region ID
A Hokkaido B Tohoku C Hokushinetsu D Kanto E Chubu F Kansai G Chugoku ,Shikoku F Kyushu
Building Activity ID
01 Office 02 Information Center 03 Public Assembly 04 Department Store
05 Mercantile(Retail) 06 Convenience Store 07 Food Service 08 Accommodation
09 Health Care 10 Welfare Facility 11 Kindergarten/ Preschool 12 Education(K1-K9) 13 Education(K10-K12) 14 Education(Higher education) 15 Laboratory 16 Theater
17 Exhibition Facility 18 Sport Facility 19 - 20 Complex Facility
21 Appliance Stores 22 Large Suburban Store
23 Retail Store 24 Barber Shop
44 More details about each region or category can be obtained from the official guide of DECC online where it can provide more details about the number of surveyed samples, total floor area and other statistical information[68]. In addition, some of previous studies conducted statistical studies regarding either overall commercial buildings or certain types of buildings of DECC[64][65][66][40].
For example: D08000001 refers to building in Kanto, accommodation function. Also overnight trips survey includes too much information regarding tourism situation in accommodation sectors. Include the original destination of occupant either domestic (with same prefecture or out of it) or international occupant with his/her nationality.
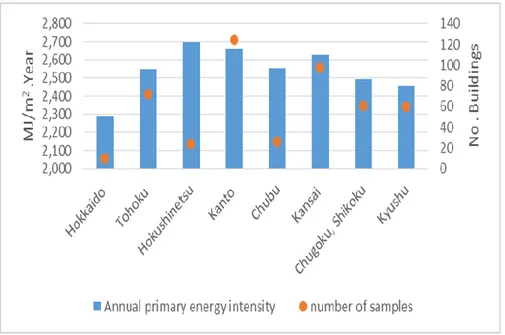
The selection of Kanto region as a case study is related to different reasons. First, the region contains the biggest number of collected samples of DECC survey. In addition, the selected region has the high annual energy consumption comparing to other region. Figure 3-2 shows the number of samples and the annual primary energy intensity of all eight regions of DECC survey.
The total floor area of surveyed accommodation facilities of Kanto region is about 5 million square meter, which is the biggest floor area of surveyed accommodation facilities of other regions. Another reason of selecting Kanto region is the population of it, since 1/3 of total population of Japan are lived in Kanto region. Kanto region has a homogenous geographic character; this property eliminates the effect of climate zone during analyzing the energy
45 consumption of region’s samples. The temperature and other weather indicators are nearly similar within Kanto region.
Figure 3-2: Annual Primary Energy Intensity and Number of Buildings in Japan (Main Regions) There are many factors and variables related to building design or operational parameters. They can affect the energy consumption of accommodation building. Some of variables have no high impact on energy use, some of them have no clear impact on energy consumption or it can not be measured easily such as gust behavior. Recent study focuses on variables that have clear correlation with energy consumption of accommodation buildings to obtain accurate estimation.
The database consists of many factors and variables of accommodation buildings related to building character such as building age, number of stories and area category. Some of operation parameters are introduced such as operation hours, cooling hours, heating hours and the cooling/heating periods.
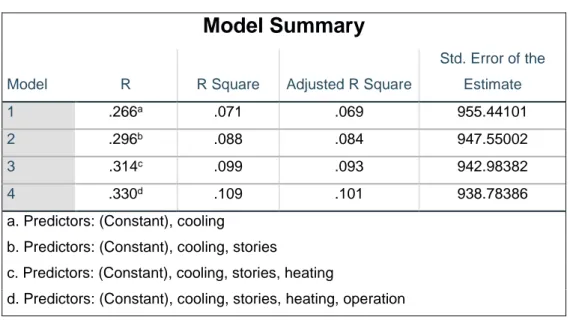
46 The classification of effective factors was done using ANOVA test as common statistical method. Table (3-3) shows the summary of R and R square for four variables; cooling hour, number of stories, heating hours and operation hours. These values evaluate the impact of each variable on energy use of accommodation buildings in Kanto.
Table 3-3: Model summary of number of stories, heating, cooling and operation hours
Model Summary
Model R R Square Adjusted R Square
Std. Error of the Estimate 1 .266a .071 .069 955.44101 2 .296b .088 .084 947.55002 3 .314c .099 .093 942.98382 4 .330d .109 .101 938.78386
a. Predictors: (Constant), cooling
b. Predictors: (Constant), cooling, stories
c. Predictors: (Constant), cooling, stories, heating
d. Predictors: (Constant), cooling, stories, heating, operation
Table (3-4) show the ANOVA results to test cooling hour, number of stories, heating hours and operation hours. Where F value and ρ value are calculated for previous variables.
Table 3-4: the ANOVA results of DECC variables
ANOVAa
Model Sum of Squares df Mean Square F Sig.
1
Regression 31330244.793 1 31330244.793 34.321 .000b
Residual 412616116.687 452 912867.515
Total 443946361.480 453
47 Residual 404930815.844 451 897851.033 Total 443946361.480 453 3 Regression 43798041.819 3 14599347.273 16.418 .000d Residual 400148319.661 450 889218.488 Total 443946361.480 453 4 Regression 48235863.898 4 12058965.975 13.683 .000e Residual 395710497.582 449 881315.139 Total 443946361.480 453
a. Dependent Variable: Primary b. Predictors: (Constant), cooling
c. Predictors: (Constant), cooling, stories
d. Predictors: (Constant), cooling, stories, heating
e. Predictors: (Constant), cooling, stories, heating, operation
3.2.
Quantitating Energy Performance
The investigation will examine certain variables according to DECC database. The relation between this variables and energy consumption are evaluated statistically to determine if there is any relation or impact. For each variable, the descriptive findings have been shown separately into following graphs:
Building Size
The total floor are is one of most important factor that reveal the energy intensity in certain facility. In addition, it can be used to normalize the energy consumption while comparing groups of buildings with different area. In this study, all accommodation buildings are classified into 5 categories of size. As shown in table (3-5)
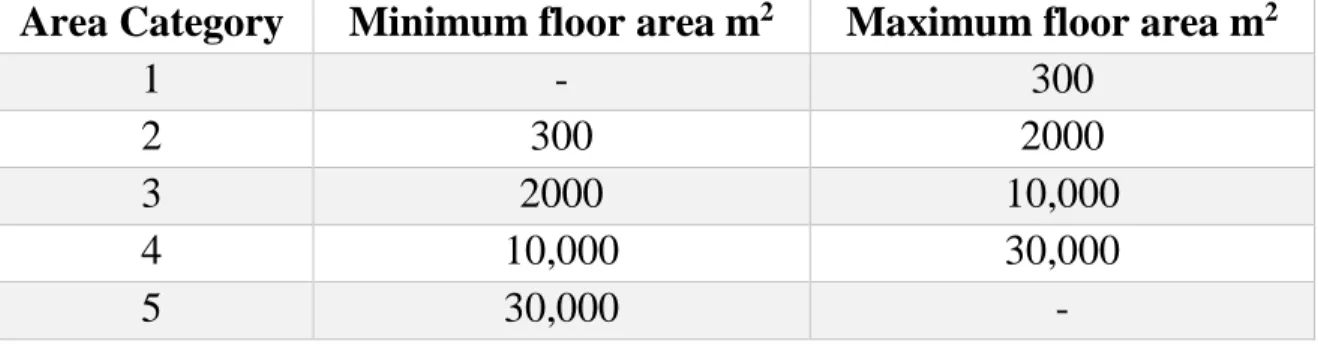
48 Table 3-5: classification of the building floor category (exclude indoor parking area)
Area Category Minimum floor area m2 Maximum floor area m2
1 - 300
2 300 2000
3 2000 10,000
4 10,000 30,000
5 30,000 -
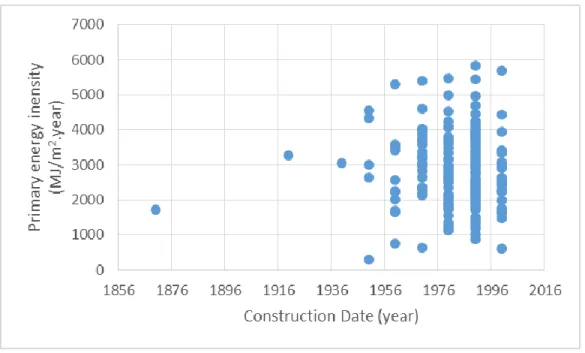
The figure (3-3) shows buildings belong to category 3 has highest number of buildings with various level of energy intensity. In most case, this category includes the business hotels class which are the preferable category for wide occupant.
Figure 3-3: Annual Primary Energy Intensity and Area Categories. 2007
It can be seen that category 5 which has the highest floor area has not the highest average of primary energy. It means there is no clear relation between floor area size and the energy consumption. The figure (3-3) shows close energy consumption trend between categories 4and 5 that proves the previous argue.