A
A
C
C
E
E
D
D
2
2
0
0
1
1
0
0
P
P
r
r
o
o
c
c
e
e
e
e
d
d
i
i
n
n
g
g
s
s
o
o
f
f
t
t
h
h
e
e
1
1
5
5
t
t
h
h
A
A
s
s
i
i
a
a
n
n
C
C
o
o
n
n
f
f
e
e
r
r
e
e
n
n
c
c
e
e
o
o
n
n
E
E
l
l
e
e
c
c
t
t
r
r
i
i
c
c
a
a
l
l
D
D
i
i
s
s
c
c
h
h
a
a
r
r
g
g
e
e
November 7-10th, 2010
Xi
’
an, China
Organized by : State Key Lab of Electrical Insulation & Power Equipment,Xi’an Jiaotong University, China
Co-Organized by : State Key Lab of Power Transmission Equipment & System Security and New
Technology, Chongqing University, China
PREFACE
Welcome to ACED 2010 in China
On behalf of the organizing committee, I am honored
to welcome all colleagues from around the world to
attend the 15th Asian Conference on Electrical Discharge
(ACED) in Xi
’
an, China on November 7-10th, 2010.
Th
e conference is organized by Xi’
an Jiaotong
University, and co-organized by Chongqing University,
China. The conference will be held at XJTU Nanyang
Hotel, which is near Xi
’
an Jiaotong University with
about 5 minute
’
s walk.
ACED 2010 will be a great event in the field of electrical discharge, and
also other related fields. More than 200 full papers have been accepted for the
conference CD. Many world-famous experts and professors in electrical
discharge will be invited to attend the Conference and make invited talks.
ACED founders will be invited to make memorial lectures. You can attend the
oral and poster sessions to discuss recent progress and exchange ideas in
phenomena, characteristics and applications of electrical discharges, and also
other interesting high voltage insulation issues.
We believe the conference will be a key stage to improve electrical
discharge research level, especially in the Asian-Pacific region, show our
great development to the world in the field of discharge and plasma academic
research.
Xi
’
an is the provincial capital of Shaanxi Province, China, and it is the
cultural and economic center of Western China. Historically 13 dynasties
placed their capitals here for more than 1300 years. There are numerous
famous historical sites waiting for your visit and discovery.
As the General Chair of 15th ACED, I would like to extend my warm
welcome to all participants to attend ACED 2010.
I wish you a joyous and rewarding stay in Xi
’
an.
Nov.2010
Prof. Yan-Ming Li
SCOPE
The Asian Conference on Electrical Discharge (ACED) is a non-profit,
international organization whose purpose is to encourage the advancement of
the science and application of phenomena and applications of electrical
discharges, primarily by conducting symposia for the exchange of scientific
information. Symposia are held biennially (every two years).
The Conference is an interdisciplinary meeting for the exchange of
results, presentation of progress and discussion of ideas and challenges for the
future in the field of electrical discharges. Both fundamental and application
aspects are covered. The Conference programs consist of memorial lectures,
ORGANIZATION COMMITTEE
International Steering Committee
K. Hidaka (Chair, Japan)
J-Y. Koo (Co-Chair, Korea)
Z. C. Guan (Co-Chair, China)
N. Hayashi (Secretary, Japan)
Y. M. Li (China)
H-Y. Kim (Korea)
K. H. Lock (Singapore)
S. Sangkasaad (Thailand)
M. Akbar (Pakistan)
Redy Mardiana (Indonesia)
Hussein B. Ahmad (Malaysia)
International
Advisory
Committee
M. Akazaki (Japan)
T. Takuma (Japan)
M. Hara (Japan)
Y. Qiu (China)
J. S. Cho (Korea)
C. H. Park (Korea)
H. R. Kwack (Korea)
K. T. Sirait (Indonesia)
Y. Sakai (Japan)
R. Y. Zhang (China)
Conference
Chair
Yan-
Ming Li (Xi’
an Jiaotong Univ.)
Conference
Vice
Chair
Ming-Zhe Rong (Xi
’
an Jiaotong Univ.)
Rui-Jin Liao (Chongqing Univ.)
Conference Executive Chair
Transformer
Jae-Keun Song, In-Jin Seo, Jong-Yeol Kim, Young-Jo Lee, Bang-Wook Lee, Ja-Yoon Koo
A49 Laboratory Study on Hydrophobicity Properties and Surface Resistance of Composite Insulators and Comparison with Porcelain under Pollution and Wet Atmospheric
Conditions
Saeed Ahmadi, Alireza Bakhshinejad, Hassan Abravesh
A50 Estimation of Degradation of Surrounding Dielectric Due to Partial Discharges within Tree Tubules
Alireza A. Ganjovi, Nandini Gupta
A51 Results of Contamination Test of Silicone Rubber Polymer Insulators for the Round- Robin Test by CIGRE
Ryosuke Matsuoka, Basanta K. Gautam, Kenji Sakanishi, Shin’ichi Kato, Takaaki Ukai,
Yasuki Hayashida, Shinkei Tomida
A52 Condition Monitoring of Biodegradable Oil-Filled Transformer by Using Polarization and Depolarization Current (PDC) Tests
N.A. Muhamad, B.T. Phung, T.R. Blacknurn
A55 The Effect of Nano Filler Mixture on the Visual Aspects of Treeing Degradation in
LDPE Based Composite
Rudi Kurnianto, Zainuddin Nawawi, Husein Ahmad, N. Hozumi, M. Nagao
A56 Performance of HTV SiR as Outdoor Insulation at 72 cm of Hg.
S. Hashim Bukhari, Muhammad Amin
A57 An Investigation on Surface Tracking on Epoxy Resin Materials
Abdul Syakur, Tumiran, Hamzah Berahim, Rochmadi
A58 Risk Management in System Operation Planning (Case Study in Transmission Line 150
kV Bukit Asam-Leramasan)
Muhammad Alamin, Herry Nugraha
A59 Partial Discharge Characteristic of Natural Rubber-LDPE Blend
Aulia, Yanuar Z.Arief, Zulkurnain Malek, M.A.M. Piah, Hadi Nur
A61 On the Deformation and Fracture of Solid Dielectrics Immersed in an Electric Field
Syed Nizamuddin Khaderi, Sumit Basu
PAPER LIST
–
by
PAPER ID
A62 Design of High Voltage Impulse Generator for Application Waste Water Treatment with Corona Discharge Plasma Technology
Agung Warsito, Abdul Syakur, Fajar Arifin, Syafrudin
A63 Effect of Contamination on the Formation of Electrical Tracking on Expoxy Resin
Materials
Tumiran, Abdul Syakur, Hamzah Berahim, Rochmadi
A64 Switching Surge Overvoltage Characteristics of Six-phase Transmission Line for Insulation Studies
Muhammad Irfan Jambak, Hussein Ahmad
A65 Modeling Lightning Induced Voltages on Nearby Overhead Conductor's Ends
Zuraimy Adzis, Zulkurnain Abdul Malek, Hussein Ahmad
A69 Performance Analysis of MHD Accelerator with Non-equilibrium Air-Plasma
Makbul Anwari, Hummad Habib Qazi, Sukarsan, Nobuhiro Harada
A71 Characteristics of Leakage Current on Epoxy Resin Insulators: Non Linear Behaviour
Suwarno, Daniel D.P.
A73 An Experiment on Dishcarge Time Lag Affected by Humidity and Rough Surface in a
PMMA Closed Void
Zainuddin Nawawi, Husein Ahmad, Rudi Kurnianto, Naohiro Hozumi, Masayuki Nagao
A76 Influence of Electrolyte on Current Distribution from Local Discharge and Electrode-fall on Electrolytic Solution
Yasutomo Moriyama, Tomoyuki Fujishima, Takahiko Yamashita
A77 Generation of High Concentration Ozone Using Dielectric Barrier Discharge with
Divided Outer Electrode
Bunpei Ueda, Tomoyuki Fujishima, Takahiko Yamashita
A78 Measurement of Pressure Distribution of Shock-wave Generated by a Pulsed Arc Discharge in Water under Various Experimental Conditions
Hirofumi Shinozaki, Noriyuki Hayashi
A79 Study on the Effects of Space Charge on Conduction Current
Su-il Choe, Seung Hwangbo, Jong-min Kim, Ki-hyung Kwon, June-Ho Lee
A80 Influence of Chemical Polishing Treatment on Vacuum Breakdown Characteristics of Copper Electrodes
Yasushi Yamano, Shogo Saeki, Shinichi Kobayashi, Yoshio Saito
A81 Observation of Surface Charge Distribution on Dielectric Films Using Pockels Effect
A55
15th Asian Conference on Electrical Discharge, Xi’an, China - 2010182
-Abstract—This paper deals with a nanocomposite of magnesium oxide (MgO) added to a low-density polyethylene (LDPE) which was subjected to an electrical treeing degradation. During propagation, there was an addition of tree branches within filled specimen compares to the pure LDPE. If the branches are assumed very closed enough then it may be more appropriately to consider the tree as a uniform conducting medium. This brought to higher local breakdown strength at the tree tip, leads to the suppression of propagation. Furthermore, even the tree had bridged the specimen the breakdown was not immediately to occur. There would be so-called time lag between bridging and final breakdown. LDPE with MgO excelled to suppress the increase of tree parameters than that of LDPE without MgO. The polymer nanocomposite seems to be more resistive against treeing degradation than their base material.
Index Terms—Nano filler MgO, LDPE, tree degradation, visual aspect, breakdown.
I. INTRODUCTION
INCE power apparatus are recently being weight reduced
and downsized in order to reduce power transmission cost; the compact design of high quality of composite material with nano-fller has become attractive [1-3]. As for LDPE, which is widely used for cable insulations, a nano-composite material of MgO added to LDPE is the most attractive material to be investigated nowadays. Electrical treeing is one of the main factors for ageing of electrical insulation systems. It has been studied for more than 30 years. Since it has complex structural characteristics that are difficult to describe using Euclidean geometry, trees can be appropriately described using fractal geometry. Unlike homogeneous solid materials, in composite insulation system, the existence of filler may affect the fractal parameters of tree growing through the composite [4]. By using fractal geometry, it was obtained that the incorporation of MgO filler in LDPE has an effect on the tree structure with more branches [5]. If the branches are assumed very close then it may be more appropriate to consider the tree as a uniform conducting medium due to it shielded neighboring branches from very high field enhancement in the tree tips. Electrical
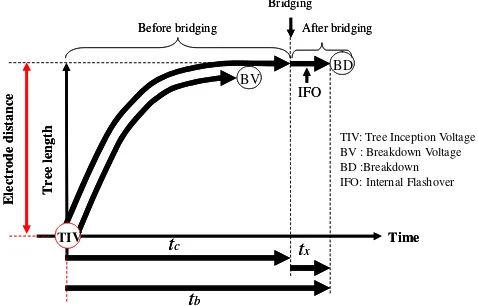
trees consist of connected channels few micrometers in diameter, with branches tens of micrometers long. The walls of the channels are not always carbonized and only weakly conducting; thus although a short circuit may occur if the tree bridges the insulation [6], this is not always immediately the case. However, it is also possible for a breakdown to be initiated before electrical trees completely bridge the insulations. Thus, the runaway stage of final breakdown mechanisms of electrical trees could be either “visual” or “not visual” aspect [6]. It is not so easy to discriminate experiment to investigate these mechanisms when it will become visual of not visual. In the previous paper [7-8], classification of both visual and not visual aspects of final breakdown mechanisms have been successfully conducted. In this classification, not visual aspect was investigated by breakdown voltage using large applied voltage compared to their inception level. While, visual aspect was investigated using applied voltage which lied exactly at the inception level. It was supposed that the higher voltage above their inception level is applied the higher tendency of final breakdown to change from visual to be not visual. The results are sketched in Fig. 1.
Fig. 1. Sketch of time to treeing breakdown.
Time to breakdown (tb) is the sum of the time the tree needs to
The Effect of Nano Filler Mixture on the Visual
Aspects of Treeing Degradation in LDPE Based
Composite
Rudi Kurnianto
1, Zainuddin Nawawi
2, Husein Ahmad
2, N. Hozumi
3, and M. Nagao
41 Department of Electrical Engineering, Tanjungpura University, Indonesia
2 Faculty of Electrical Engineering, Universiti Teknologi Malaysia, Malaysia
3 Department of Electrical & Electronic Engineering, Aichi Institute of Technology, Japan
4 Department of Electrical & Electronic Engineering, Toyohashi University of Technology, Japan
S
183
-bridge the counter electrode (tc) and time lag to breakdown (tx).
The recent paper is a digest on the visual aspect of final breakdown mechanisms before and after tree bridged the specimen.
II. EXPERIMENT
A. Specimen
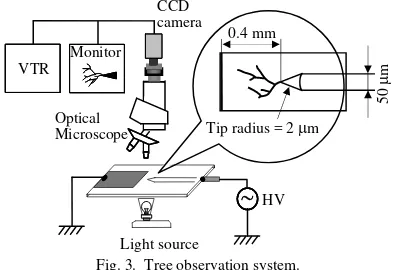
A tungsten wire with 50 μm in diameter was used as a needle electrode. Electrolytic polishing formed the needle tip; its tip radius was 2 μm. The tungsten needle was sandwiched in between two nanocomposite films (each thickness was 80 μm) and hot-pressed down to about 150 μm in thickness. The specimen sheet was fixed between a slide glass and cover glass by Aron Alfa adhesive (Toa Gosei Ltd.). Aluminium foil was applied as a counter electrode at a distance of 0.4 mm from the tip of tungsten needle. The leaf-like specimens (see Fig.2) were prepared with various concentrations of MgO fillers 0, 1, 5, and 10 phr (part per hundreds ratio).
Fig. 2. Specimen configuration (NC: nanocomposite, CG: cover glass, SG: slide glass, CE: counter electrode, ER: epoxy resin).
B. Treeing Tests
A schematic diagram of measuring system is shown in Fig. 3.
Fig. 3. Tree observation system.
An ac ramp voltage of 60 Hz was applied between the needle and counter electrodes at a continuous rising speed (0.5 kV/s), however, as soon as tree had been observed, the voltage was kept at the constant value to observe the tree propagation until bridging the counter electrode and leading to final breakdown. It was recorded by VTR (video tape recorder) through CCD (charge couple device) camera that mounted on the microscope.
The tree inception voltage was defined as the voltage when the tree length observed by CCD camera had exceeded 10 μm [6]. When applying voltage, the specimens were placed in a vessel
filled with silicone oil of 10 mm2/s (10 cSt) in viscosity to avoid
surface flashover. All tests are carried out under ambient temperature.
III. RESULTS AND DISCUSSIONS
A. Effect of Nano Filler MgO on Trees before Bridging
After incepted, the tree grew up towards the counter electrode. The MgO nano filler acted as barrier against tree propagation. During propagation, there was an addition of fractal dimension on tree within filled specimen compares to
the pure LDPE, as shown in Table Ⅰ.
TABLE I FRACTAL DIMENSIONS OF TREE GROWTH IN THE NANOCOMPOSITE
The introduction of filler brought the rise in fractal dimension due to the increase of branches. It should be noted that the larger fractal dimension means more branching pattern of tree propagation. However, the characteristics are not necessarily connected to the meaning that the material is easy to destroy when its fractal dimension is large.
According to Dissado [6], free volume is an intrinsic feature of polymeric insulation in crystalline and amorphous regions. It might be considered that the fillers change the state of crystallization and restrict the formation of free volume. All the crystals must have a core in their structure. If a better packing is brought by introducing filler particle as a cores, then the formation of free volume may be restricted. The local breakdown strength at the tree tip may be high if the imperfection such as free volume in the insulation could be restricted.
Fig. 4 compares the tree growth in pure LDPE and 5 phr MgO/LDPE nanocomposite. The tree propagation in pure LDPE is characterized with not so many branches. However, the incorporation of filler in LDPE has an effect on the tree structure with more branches. The tree branches shielded neighboring branches from very high field enhancement and if the branches are assumed very close then it may be more
Fractal Dimension of Tree
184 -appropriate to consider the tree as a uniform conducting medium.
Fig. 4. Tree growth in (a) LDPE and (b) phr MgO/LDPE Nanocomposite.
B. Effect of Nano Filler MgO on Trees after Bridging
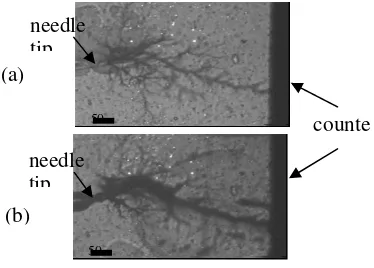
Based on the observation, after about several minutes depending on the filler concentrations, the tree arrived at the counter electrode and stopped the growth at there. However, even the tree had bridged the counter electrode; the breakdown was not immediately to occur. There was time lag between bridging and final breakdown. During the period of time lag, as the active tree channel had bridged the counter electrode, the partial discharges occurred within this channel. It occurrences could be seen clearly as a very bright light (just like lightning strike in the nature) from the needle tip towards the counter electrode. It is called as internal flashover (IFO). The tree channels were eroded by this flashover. Fig. 5 shows the photograph of tree propagation when it bridged the counter electrode at the first time (a) and then just prior to the final breakdown (b).
Fig. 5. Photograph of tree propagation when it bridged the counter electrode at the first time (a), and then just prior to the final breakdown (b).
By comparing Fig. 5 (a) and (b); it seen that the tree channel became thicker as the internal flashover occurrence more intense. There would be several internal flashover occurrences before the specimens were completely broken down. The effect of MgO filler on the tree parameters is shown in Table
Ⅱ.
TABLE Ⅱ FILLER EFFECT ON TREEING PARAMETERS
The change of diameter of trees growth in the composite with various concentrations of nano filler is shown more detail in Fig. 6.
Fig. 6. Comparison of tree channel diameter changes from inception, first time of bridging and just prior to final breakdown under various MgO
concentrations.
The time to bridging, time to breakdown and time lag to breakdown increased with increasing of MgO concentration in LDPE. The incorporation of nano filler MgO tends to make longer time lag since the filler particle would increase the electron affinities on the tree channel wall and finally could significantly restrain the occurrence of internal flashover during this period, as illustrated in Fig. 7. At the low diameter (D = 6 μm) the effect of filler would be significant in restraining the internal flashover (IFO). If, the occurrence of internal flashover more intense, the tree diameter will get wider. And according to the simulated tree channel, it is believed that, there was a maximum tree diameter above which the effect of MgO would be very small. In this case, time to treeing breakdown is interpreted as a measure of the life time that an insulation material can withstand under a certain electric field until it breakdown. As time lag to breakdown is included in
Tree Parameters 0 phr 1 phr 5 phr 10 phr
Tree inception voltage (kV)
Time to bridging (minutes) 3.84 5.13 8.15 10.51 Time to breakdown (minutes) 5.27 7.11 10.32 14.57 Time-lag to breakdown
(minutes) 0.78 1.51 2.23 4.39
Internal flashover rate
(number/minutes) 58.11 9.85 6.88 2.15
Equipotential lines
inception bridging prior to breakdown
185 -time to breakdown, the MgO nano filler would suppress the tree propagation and finally the life time of the insulation systems.
Fig. 7. Illustration of MgO filler effect on the tree channel changes after bridging the counter electrode.
IV. CONCLUSION
Effect of MgO nano filler mixture on the visual aspect of treeing degradation in LDPE based composite has been studied. The main results are summarized as follows. The filler suppressed tree propagation. The incorporation of filler into LDPE brought the rise in fractal dimension number of trees due to the increase of its branches. The tree branches shielded neighboring branches from very high field enhancement and if the branches are assumed very close then it may be more appropriate to consider that the tree as a uniform conducting medium. This would lead to the higher local breakdown strength at the tree tip. Therefore, the filler effectively reduces field enhancements arising from electrical trees and leading to the suppression of tree propagation. Even the had bridged the specimen; the breakdown was not immediately to occur. There was time lag between bridging and final breakdown. During the time lag, the tree channel was eroded by the occurrence of internal flashover in it. The more nano filler concentration, the longer times needed to make tree channel diameter thicker enough for breakdown to occur. The time lag to treeing breakdown characteristics of LDPE could be significantly improved by adding a few percents of nano size MgO filler, which is very beneficial for tree aging performance of polymer nanocomposite materials.
REFERENCES
[1] T. Tanaka, G. C. Montanari and R. Mulhaupt, “Polymer Nanocomposites as Dielectric and Electrical Insulation-Perspective for Processing Technologies, Material Characterization and Future Application,” IEEE Transl. DEI, vol. 11, no. 5 2004, pp. 763–784.
[2] T. Tanaka, M. Kozako, N. Fuse and Y. Ohki, “Proposal of a Multi-core Model for Polymer Nanocomposite Dielectrics,” IEEE Transl. DEI, vol. 12, no. 4 2005, pp. 669–681.
[3] Y. Murata, Y. Sekiguchi, Y. Inoue and M. Kanaoka, ”Investigation of Electrical Phenomena in Inorganic-filler/LDPE Nanocomposite Material,” in 2005 Proc. ISEIM Symp., pp. 650–653.
[4] R. Kurnianto, Y. Murakami, N. Hozumi, and M. Nagao, “Characterization of Tree Growth in Filled Epoxy Resin : The Effect of Filler and Moisture Contents,” IEEE Trans. DEI, vol. 14, no. 2 April 2007, pp. 427- 435. [5] R. Kurnianto, Y. Murakami, N. Hozumi, M. Nagao, and Y. Murata,
“Effect of Nano filler on Treeing Breakdown in MgO/LDPE Nanocomposite,” in 2007 Proc. Int. Conf. Electr. Engg.& Informatics (ICEEI), pp.424-427.
[6] Electrical Degradation and Breakdown in Polymers, Peter Peregrinus,
L.A. Dissado and J. C. Fothergill, Ed. G. C. Steven, London, 1992, pp. 57-58, 120.
[7] R. Kurnianto, Y. Murakami, N. Hozumi, M. Nagao, and Y. Murata, “Some Fundamentals on Treeing Breakdown in MgO/LDPE Nanocomposite,” in 2006 Proc. Conf. Electr. Insul. And Dielectr. Phen. (CEIDP), pp. 3737-376, Kansas City, USA.
[8] R. Kurnianto, Y. Murakami, M. Nagao, N. Hozumi, and Y. Murata, “Treeing Breakdown in Inorganic–filler/LDPE Nanocomposite Material,” Trans. on Fundamentals and Materials, vol. 127, no. 1, pp. 29-34, January 2007.
Rudi Kurnianto (S’06) was born in Pontianak, Indonesia on 27 May 1967. He
received B. Eng. degree from Tanjungpura University Indonesia in 1994 and the M. Eng. degree from Bandung Institute of Technology, Indonesia in 1998. His Dr. Eng. degree was obtained from Toyohashi University of Technology, Japan in March 2008. He has been working as a lecturer at Tanjungpura University since January 1995, and now he is a Head of High Voltage Engineering Laboratory, Department of Electrical Engineering, Tanjungpura University. His research interests are in areas of high voltage engineering..
Zainuddin Nawawi was born in Lubuk-Linggau, Indonesia on March 3rd 1959.
He received his B.S. degree in Electrical Engineering from Sriwijaya University, Indonesia in 1984 and became an assistant lecture in the Department of Electrical Engineering of Sriwijaya Univesity. He is currently as a doctor course student at Universiti Teknologi Malaysia.
Husein Ahmad was born in Mersing, Johor Bahru, Malaysia, on 1st July 1953.
He obtained B.Sc. (Hons) and M.Sc. in Electrical Engineering from the University of strathclyde, Scotland and subsequently obtained his Ph.D. degree in High Voltage Engineering from University of Manchester Institute of Science and Technology (UMIST) in 1986. He is a senior member in the IEEE, USA and member of CIGRE. Currently, he is a Professor in the Faculty of Electrical Engineering and Director of Institute of High Voltage and High Current (IVAT) Universiti Teknologi Malaysia, Johor Bahru, Malaysia.
Naohiro Hozumi (M’94) was born in Kyoto, Japan on 2 April 1957. He
received B.S., M.S. and PhD degrees in 1981, 1983, and 1990, respectively from Waseda University. He has engaged in Central Research Institute of Electric Power Industry (CRIEPI) from 1983 to 1999. He has been an Associate Professor at Toyohashi University of Technology since 1999. He became a Professor since April 2006 at the Department of Electrical and Electronic Engineering of Aichi Institute of Technology. He has been engaged in the research on insulating materials and diagnosis for high voltage equipment. He received awards in 1990 and 1999 from IEEJ for his outstanding research papers. He is a member of IEE Japan.
Masayuki Nagao (M’90) was born in Japan on 16 April 1950. He received the
Dr. Eng. degree from Nagoya University in 1978. He became a lecturer in 1980, an Associate Professor in 1985 and a Professor in 1998 in the Department of Electrical and Electronic Engineering of Toyohashi University of Technology. He is engaged primarily in research on high-field electrical properties of polymers and insulation degradation phenomena. He received a Paper Award from IEE Japan in 1991. He is a member of IEE Japan, Japan Society of Applied Physics, CIGRE, and Cryogenic Association of Japan.
MgO filler effect was higher
MgO filler effect was getting smaller
BD At the first time of bridging
Needle
Needle
Needle
Counter electrode
MgO filler effect was higher
MgO filler effect was getting smaller
BD At the first time of bridging
Needle
Needle
Needle
A73
- 235 -
15th Asian Conference on Electrical Discharge, Xi’an, China - 2010
Abstract—The discharge time lag due to deteriorations of high humidity and rough dielectric surface in insulation-gap-metal system has been studied using CIGRE Method II (CM II) electrode. The sample was polymethylmethacrylate (PMMA). The residual probability of time lag was becoming shorter as the relative humidity (RH) rises. It is considered due to the electrons detached from water molecule. The characteristics time lag at 36.8 % of residual probability made the positive polarity shorter than the negative. Time lag with positive polarity was more sensitive to the applied voltage than the negative one. A rough surface brought by plasma exposure would enhance electrical field so that the discharge would be easier to take place with shorter time lag. Decrease in discharge time lag would make possible for partial discharge (PD) occurred with large number of small discharges. After 20 and 60 minutes of recovery times, the time lag of 16 and 21 seconds of exposure levels were not change significantly. However, at 3 seconds of exposure level, 60 minutes of recovery time was long enough to shift the curve to the longer time lag compares to that of 20 minutes. It seems that the treatment changes the surface properties of material only, not the bulk properties.
Index Terms—CM II, cumulative and residual probabilities, partial discharge, plasma, PMMA, relative humidity.
I. INTRODUCTION
HE breakdown due to rapidly changing voltages or impulse
voltages is of great importance phenomena in outdoor insulation systems. It has been recognized that there is a time difference between the application of a voltage sufficient to cause breakdown and the occurrence of breakdown itself. This time difference is called time lag. Most of the electrical apparatus use air as the insulating medium because of their simplicity and enormous availability in the nature. Tim lags are very important in practical engineering designs. Especially, in insulation coordination the volt-time characteristics of different electrical apparatus are very important to identify [1]. The requirement for protective devices such as rod gaps is that their volt-time curve must lie below the withstand level of the protected insulation in any time region in which protection is needed [2]. As consequence, the margin of the two curves must be adequate to allow for the effects of distance, polarity,
variations in relative air density, humidity, ageing of the insulation and likely changes in the characteristics of the protective devices.
Time lag test on protective devices under deteriorations such as wet/humid condition or surface erosion in real situation suffer from the difficulty that uniform heavy rain accompanied by humid space is hard to achieve, and random errors are therefore large. Different insulation arrangements have different characteristics; this adds enormously to the test load. For that reason, even today the available information within this domain is neither definite nor complete.
To avoid this difficulty yet still enable to study the discharge time lag, artificial small size of gap has been successfully employed using CM II electrode system in the previous paper [3]. In this paper, it was concluded that some features of the pattern can qualitatively be explained by the voltage dependence of the discharge time lag. However, the discharge time lag characteristic due to humidity and surface roughness is not yet clarified. Accordingly, in the recent paper, investigations are conducted to ascertain the characteristics of discharge time lag affected by the humidity and roughness of the air gap and insulation surface, respectively.
II. EXPERIMENTAL
The employed specimen was CM II electrode system as shown in Fig. 1. One side of the flat gap was in contact with a metallic electrode, and the other side with insulation. The insulation was a 1 mm thick plate of PMMA. In the first test, in order to evaluate the humidity effect on the discharge time lag, two slits of 10 mm in wide were made at the spacer. The specimens were placed in the chamber controlled at constant humidity. Humidity of the space surrounding specimen was conditioned using saturated salt solutions at 33 %, 75 %, and 98 % RH [4]. The specimens were conditioned for 24 hours to ensure stability of the RH prior to measurement. In the second test, the insulation surface was roughened by plasma. Before plasma treatment the sample surface was cleaned by ethanol. Then the samples were subjected to arc plasma sprayer (Keyence ST-7010). The exposure times were 3, 6, 11, 16, and
An Experiment on Discharge Time Lag Affected
by Humidity and Rough Surface in a PMMA
Closed Void
Zainuddin Nawawi
1, Husein Ahmad
1, R. Kurnianto
2, N. Hozumi
3and M. Nagao
41
Faculty of Electrical Engineering, Universiti Teknologi Malaysia, Malaysia
2
Department of Electrical Engineering, Tanjungpura University, Indonesia
3
Department of Electrical & Electronic Engineering, Aichi Institute of Technology, Japan
4
Department of Electrical & Electronic Engineering, Toyohashi University of Technology, Japan
- 236 - 21 seconds. Soon after stopping the plasma exposure the sample was assembled into the CM II electrode system.
Fig. 1. Configuration of CM II specimen.
The PD measurement is shown in Fig. 2; the voltage was applied to the spherical electrode side of specimen, while the lower was connected to the measurement system.
Fig. 2. Schematic diagram of PD measurement system.
The discharge current through the specimen was integrated by the capacitance-resistance (CR) circuit and was digitized using the peak detecting function of the digitizing oscilloscope. Discharge time lag under a step voltage was measured by applying periodical square HV pulses with 10 milliseconds in pulse width. The intervals of pulse application was 20 milliseconds, being corresponded to 50 Hz. Time lag between the leading edge of square pulse and the discharge pulse was measured as shown in Fig. 3.
Fig. 3. Illustration for the measurement of discharge time lag.
The measurements through 64 pulses were performed to statistically analyze the time lag using identical voltage under several levels of RH and plasma exposures. The rising time of the pulse was as short as 40 microseconds. The polarity of the voltage was defined by that applied to the spherical electrode in Fig. 1, the polarity being identical to that applied to the insulation side of the void. All experiments were performed
under room temperature.
III. EXPERIMENTAL RESULTS AND DISCUSSION
A. Effect of Humidity on the Discharge Time Lag
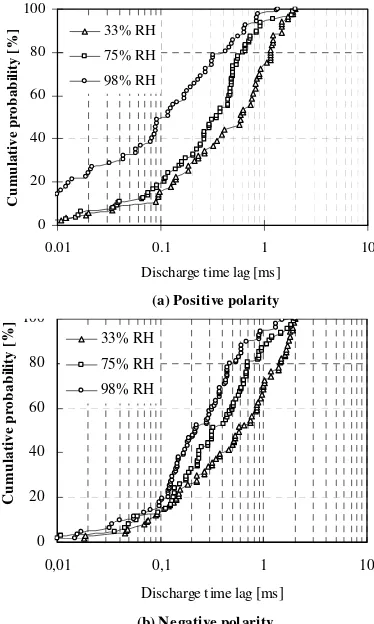
Fig. 4 shows the cumulative probability as a function of discharge time lag with each RH.
Fig. 4. Cumulative probability of the PD time lag of (a) positive and (b) negative polarities for relative humidity of 33 %, 75 % and 98 %.
The cumulative probability is determined from the equation as follow.
Where ntwas the number of certain time lag occurred within
applied pulses, and n0 was the number of applied pulses (64
- 237 - At 33 % and 75 % of RH, the time lag showed almost the same period both positive and negative polarity. However, at 98 % RH, the negative polarity showed a little bit longer time lag compares to that of positive, along the horizontal axis.
The statistical time lag of discharge is often explained by the Laue’s theory. Assuming that the initial electron which triggers the discharge appears with the same rate, the probability that
the discharge does not take place until t after the application of
a step voltage is expressed by
⎟
Where R is the residual probability and τ is the characteristic
time lag. The residual probability could be related to the cumulative probability as follow.
P
R
=
1
−
(3)A Laue plot is therefore plotted with log R as the vertical
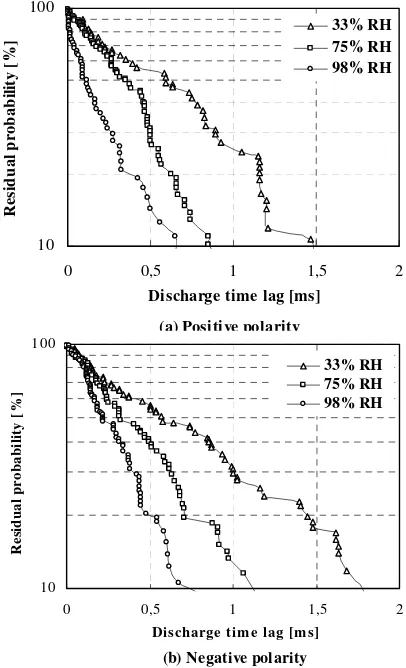
axis and t as the horizontal axis. Fig. 5 shows the Laue plots
based on the data in Fig. 4. Laue plots showed more clearly than the cumulative probability plots. In both polarities, the discharge time lag becomes shorter with increasing RH. The negative polarities have longer time lag than the positive polarities along periods of (0.6 – 1.7) ms, (0.4 – 1.1) ms, and (0 – 0.6) ms, for 33 %, 75 % and 98 % of RH, respectively.
Sawa et al. measured the time lag of the discharge through a short air gap between metal-metal electrodes. They reported that a large resistance inserted into the discharge circuit brought a glow discharge and the statistical distribution of discharge time lag followed the Laue’s theory, whereas a small resistance brought an arc discharge and a large deviation from the Laue’s theory was observed [5]. As the discharges were triggered successfully on the identical electrode, they suggested that the change in surface condition by the arc discharges brought the deviation from the Laue’s theory. In case of partial discharge through a void in contact with insulation, the discharge current is limited by extremely large resistance of the insulation so that the damage on the surface by discharge would be very small. The discharge time lag of the present experiment would thus follow the Laue’s theory.
At t = τ, the probability will become 63.2 % or 36.8 % for
cumulative or residual probability, respectively. Fig. 6 shows
the RH dependent characteristic on discharge time lag τ.
The characteristic time lag of positive polarity was shorter than negative polarity. This means that the discharge time lag with positive polarity was more sensitive to the applied voltage than the negative polarity.
Fig. 5. Residual probability of the PD time lag of (a) positive and (b) negative polarities for relative humidity of 33 %, 75 %, and 98 %.
Fig. 6. Plot of the characteristic time lag as a function of RH.
B. Effect of Plasma Exposure Time on Discharge Time Lag
In order to explain this phenomenon, the partial discharge time lag of each level exposure time soon after exposed by plasma was investigated. As shown in Fig. 7, the time lag becomes shorter with increasing exposure time. This would be explained by assuming that the initial electron is easier to be supplied from the metallic electrode. A rough surface brought
- 238 - by plasma exposure would emphasize electrical field so that the discharge with longer exposure time would be easier to take place. Decrease in discharge time lag would make possible the PD occurred with a large number of small discharges.
Fig. 7. Laue plots of PD time lag of each level of exposure time.
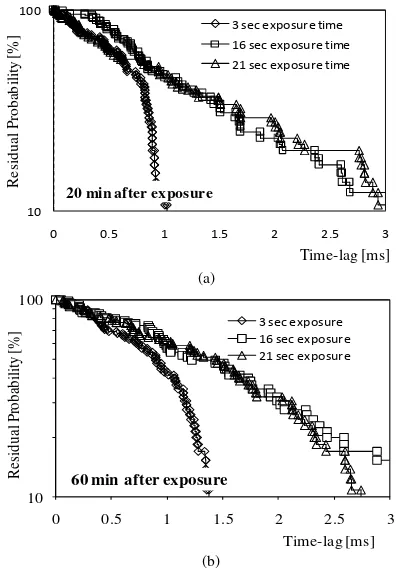
Fig. 8(a) and (b) show the Laue plots of PD time lag for 20 and 60 minutes after exposure by plasma. In this investigation the exposure time levels respectively 3, 16, and 21 seconds.
(a)
(b)
Fig. 8. Laue plots of PD time lag for (a) 20 minutes and (b) 60 minutes after being exposed by arc plasma.
As shown in Fig. 8, in case of 16 s and 21 s of exposure levels, the partial discharge time lags after 20 minutes of exposure seemed not much change compares to that of 60 minutes. However, in case of 3 s of exposure level, there was a significant change between 20 and 60 minutes. The time lag after 60 minutes seemed to be longer than that of 20 minutes. The time lag becomes longer probably related to the recovery
time of material properties. Collections of ions and electrons remove gradually from void surface. The ions and electrons are accompanying the exposure should be disappear gradually. It means that, following the time the effect of plasma exposure should be disappear. When the plasma effect was disappeared, it would make possible the discharge occur with longer time lag. This clarified that, for short exposure time the plasma treatment changes the surface properties of material only, not the bulk properties.
IV. CONCLUSION
The discharge time lag due to deteriorations of high humidity and rough dielectric surface in insulation-gap-metal system has been carried out using CM II electrode system. The main results are summarized as follows.
1. In both polarities, the time lag was become shorter as
the RH rises from 33 % to 98 %.
2. The characteristic time lag of positive polarity was
shorter than negative polarity. This means that the discharge time lag with positive polarity was more sensitive to the applied voltage than the negative polarity.
3. The time lag also becomes shorter with increasing
exposure time. It seems the initial electron is easier to be supplied from metallic electrode. A rough surface brought by plasma exposure would emphasize electrical field so that the discharge with longer exposure time would be easier to take place. Decreased in discharge time lag would make possible the PD occurred with large number of small discharges.
4. At 16 and 21 seconds of exposure levels, the time lag
after 20 or 60 minutes seemed not quite different; however, at 3 seconds of exposure level, the time lag was shifted to the longer time. Short exposure level of plasma still gave any possibility for recovery of material properties.
REFERENCES
[1] M. S. Naidu and V. Kamaraju, “High Voltage Engineering”, New York: McGraw-Hill, 1996.
[2] W. Diesendorf, “Insulation Co-ordination in High-voltage Electric Power Systems”, London Butterworths, 1974.
[3] N. Hozumi, H. Michiue, H. Nagae, Y. Muramoto, and M. Nagao,” Time- lag measurement of Void Discharges for the Clarification of the Factor for Partial Discharge Pattern”, Annu. Rep. Conf. Electr. Insul. & Dielectr. Phenomena (CEIDP), #C-7, pp.717-720, Victoria, Canada, 2000. [4] L. Greenspan, “Humidity Fixed Points of Binary Saturated Aqueous
Solutions”, Journal of Research of the national Bureau of Standards-A, Physics and Chemistry, Vol. 81A, No. 1, 1977.
[5] R. Messaoudi, A. Younsi, F. Massines, B. Despac, C. Mayoux, “Influence of Humidity on Current Waveform an Light Emission of Low-Frequency Discharge Controlled by a Dielectric Barrier”, IEEE Trans. on EI, vol. 3, No.4, 1996, pp. 537-543.
10
20 min after exposure
3 sec exposure time
60 min after exposure
3 sec exposure
16 sec exposure