AUTOMATIC OBJECT-ORIENTED ROUNDABOUTS EXTRCTION FROM HIGH
RESOLUTION MULTISPECTRAL IMAGES
Xinyi Li a, Wen Zhang a*
a School of Remote Sensing and Information Engineering, Wuhan University, Luoyu Road No.129, Wuhan, Hubei Province, China -
@ whu.edu.cn [email protected]
KEY WORDS: Roundabout Extraction, Remote Sensing, Object-oriented Feature Extraction, GF-2
ABSTRACT:
Road roundabouts, a typical class of road facilities to avoid collision, are generally not directed extracted in existing road extraction methods. This paper presents a novel four-step approach for automatic vegetated roundabout extractions from high resolution multispectral satellite images, which combines object-oriented extraction, Support Vector Machine (SVM) classification and spatial relationship estimation. Firstly, after proper preconditioning, the vegetated roundabouts are extracted by object-oriented extract algorithm in ENVI with rules that simultaneously taking area, roundness and vegetation index (NDVI) into consideration. After a certain number of experiments, the set of three items’ thresholds can be found, which may stand as the general rules for vegetated roundabouts extraction in similar conditions. Next, the roads are classified using Support Vector Machine (SVM) and the outputs are several band shaped polygons. Then, the holes in road polygons will be detected by examining the topological relation in ArcGIS. Lastly, since the margin of extracted roundabout and the biggest detected hole may not strictly coincide, by comparing the distance between central points of both the extracted roundabout and the hole with the threshold, convincing determination can be made. The proposed automatic approach has been proved to have very high production accuracy that all above 85% in each case of the test set, which is good enough for automatic vegetated roundabouts extraction from high resolution remote sensing images without manual interpretation.
1. INTRODUCTION
Roundabouts (road circles), a typical class of road facilities, are often found in crossings, where traffic is not heavy and space is abundant. Roundabouts can reduce vehicles’ speed, avoid collision accidents, and improve the quality of road networks, as they turn collision points into drivable points. Some roundabouts can even become famous landmarks or recreation squares. Generally speaking, radiuses of roundabouts can vary from 12 to 30 meters, according to the roads’ grades. The higher the grade, the bigger the roundabouts (Chai, 2007).
In this paper, we focus on vegetated roundabouts’ extraction, which are usually planted with flowers, low shrubs and evergreen species with neat edges and driver-friendly heights.
Direct extractions from remote sensing images for vegetated roundabouts are very infrequent. Previously relevant researches usually used axillary information that did not provided by images, neglected the roundabouts’ vegetated information, or had misjudgements.
For example, topographic geospatial database was used as prior knowledge and the parameters were used to form the detection vector. Ziplock snake algorithm consisted of gradient vector flow force and the balloon force, which enabled the roundabout border to be delineated (Ravanbakhsh and Fraser, 2009). Other kinds of roundabout detection with priori knowledge may deploy a base digital map and extend it with roundabouts and other details, using landmarks from raw sensor data and match those in the base map. Then laser scanners could detect central islands, and the results are quite good as error of estimated roundabout centre was less than 0.30m and error of the estimated gate position was less than 0.40m, but the paper contained only one test (Raaijmakers and Bouzouraa, 2015). Besides, vehicles’
* Corresponding author
trajectories were manually isolated and Bayesian classified into 15 classes, and roundabouts’ centres and radiuses were found by clustering successive rotation centres (Zinoune, Bonnifait et al., 2012). Or after using Adaboost classification, filter and extraction could overcome image noise and road canopy, and then hough transformation was successful for roundabouts’ edge extraction and randomized hough transform was suitable for elliptical roundabouts formed by sensor distortion, but did not utilize the vegetation information (Mancini, Frontoni et al., 2009). Or using SPOT5 images, after primitive edge detection, and feature vector generation through line and circle extraction as well as junction and parallel detection, Adaboost successfully separated roundabouts and insulated buildings. However, this method’s accuracy was disappointing, with 2 false detection in about 10 roundabouts (Erus, 2008).
This paper presents a novel four-step automatic vegetated roundabout extraction method, making full use of the image contained information without any ancillary data and making a balance between robustness and correctness. This method works well in different images with different resolution and produces no misjudgement but convincing and reliable roundabout extraction with high accuracy that over 85% in each case of the test set.
The successful roundabout extraction can benefit municipal engineering to design crossings with higher efficiency, improve the completeness of digital maps for both human and automatic driving, and help social researcheres evaluate the prosperity of a certain area.
Vector Machine (SVM) classification and spatial relationship estimation. The remain of this paper is organized as follows: First the theory of roundabout extraction methodology will be summarized, then the details of experiment and evaluation will be introduced, lastly conclusion and future studies will be presented.
2. METHODOLOGY
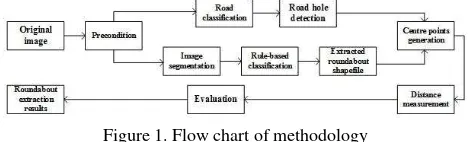
The kernel of roundabouts extraction is to distinguish roundabouts from other spatial objects, especially identify them from complex road crossings. To achieve our goal, we try to make full use of the spatial and spectral characteristics of vegetated roundabouts only from remote sensing images, and the topological relationship of road and roundabout to make reliable determinations. Furthermore, the proposed method should not use axillary data, while dependable and accurate outputs of this automatic algorithm are expected with quantification methods. According to this, a new roundabouts extraction method is proposed, which contains four steps. After proper preconditioning, the procedure starts with image segmentation and rule-based classification, as well as SVM road classification and hole detection. Then the distance will be measured between the centres of the biggest hole and the extracted roundabout polygon with GIS software, as an evidence that the rule-based extracted areas are roundabouts with high reliability. A graphical presentation of discussed methodology is shown in Fig.1.
Figure 1. Flow chart of methodology
2.1 Roundabouts Detection and Extraction
2.1.1 Object-oriented image segmentation: Image segmentation is the process of splitting an image into multiple segments by grouping neighbouring pixels with similar values. Ideally, the segments correspond to real-world features. There are two algorithms adopted during segmentation process, the watershed algorithm and merging algorithm.
The watershed algorithm is an image dividing method, which is developed from the hydrologic concept. Since water fill a landscape starting at the lowest areas, dams are built where water coming from different basins would meet. When water stops rising eventually, the whole landscape is divided into multiple areas by dams, called watersheds. Similar in the digital image processing, the darkest pixel can be regarded as the lowest one in height, and a brighter one would be higher in elevation. Water floods from the darkest region in image, and thus the watersheds would be at the margins where pixels in an area share a similar spectral feature. Therefore, the watershed algorithm is easy to realize with satisfactory accuracy and can produce continuous boundaries whose widths are usually more than a single pixel’s width. These merits show that the watershed algorithm can divide images within acceptable short processing time, and users do not need to face the difficulty to handle a broken margin of a extracted roundabout. After proper merging to fix the over-segmentation problem, the outputs of segment are ready for direct roundabout extractions.
The watershed algorithm may have two options: edge and intensity, which respectively generates gradient maps using a sobel edge detection and intensity map that average the selected bands from original images. The extent of segmentation can be
controlled by scale level(X) numbered 0 to 100, by neglecting the lowest X% pixel values computed from a normalized cumulative distribution function (CDF) (Exelis Visual Information Solutions, 2017). The higher the scale level value, the rougher the segmentation would be, and the bigger output zone would be in gradient maps (Roerdink and Meijster, 2000).
After watershed algorithm, images can be divided into multiple segments, and the output are segmentation images and numerous zones in shapefiles.
The merging algorithm will combine adjacent segments with similar spectral attributes to a proper degree to prevent over-segmentation, thus merging adjacent segments with alike spectral characters is necessary to obtain intact roundabouts. In order to merge small neighbouring pieces, each band’s mean spectral values in each segment will be computed, and the Euclidean distances between the segments will be measured. There are two different ways to measure the Euclidean distances between two adjacent segments: full lambda schedule and fast lambda schedule.
Full lambda schedule iteratively merges adjacent segments based on a combination of spectral and spatial information (Robinson, Redding et al., 2002). If the merging cost ti,j is less than a threshold, two segments will be merged in one. Merging cost ti,j is calculated as follows: the relative length of Euclidean color distance (E)and the length of their common border (L) between two segments (Exelis Visual Information Solutions, 2017). A large lambda value stands for a larger Euclidean color distance or a small common border and vice versa. All adjacent regions with an L value less than a given thresholdwill be merged on an iterative basis. Lambda value is calculated as follows:
E= Euclidean color distance between region 1 and 2 L= length of region 1 and 2’s common border
The threshold is computed from a normalized cumulative distribution function (CDF) of Lambda spectral distance values. For example, if merge level is set to x, it will merge adjacent segments with the lowest x% of Lambda values.
If merge level is at 0, no merging process will be done in both full lambda and fast lambda schedule.
2.1.2 Rule-based roundabout classification: By setting rules that consider spatial, spectral and textural simultaneously, typical objects can be easily pin down among numerous segmentation zones from last step. Since vegetated roundabouts have conspicuous features, such as perfectly round in shape, expected area (roundabouts’ radius are usually strictly restricted by traffic administration) and relatively high in vegetation index, rule-based classification contains spatial and spectral constrains would be effective in roundabout extraction. Texture information is not considered in rules since vegetated roundabouts have similar textures with roadside vegetation, and diversity is remarkable in plant types and growing status even in a single roundabout. Ideally in different conditions, segmented roundabouts should be 450-3000 square meters in area (12-30 meters in radius), near 1 in roundness and have a computed average vegetation index in top 40% of their images. Roundness can be computed as follows:
R =4∙�∙� (3)
where R=roundness S=area of a zone C=perimeter of a zone
Additionally, weight can be set among three selected attributes: area, roundness and vegetation index, in order to overcome unsatisfactory circumstances. For images with poor calibration and correction that may affect the spatial features of grounded objects, the weight of two spatial attributes as roundness and size can be lower and set higher NDVI weight. Those images with partly shadow over roundabouts or taken in winter with less vegetation can be set with a reduced NDVI weight. Remote sensing images with expected size, intact roundness and conspicuous vegetation features can be set with balanced weights as 1:1:1 among these three items (Exelis Visual Information Solutions, 2017).
After a certain number of experiments, the set of three items’ thresholds can be found, which may stand as the general rules for vegetated roundabouts extraction in similar conditions. After rule-based roundabout classification, there are several outputs: the set of feasible rules, raster classification image and shapefile of roundabout classification.
2.2 Road Classification
To determine the spatial relationship between roundabouts and roads, roads are needed to be classified from the satellite image using supervising classification method. Support Vector Machine (SVM) is a supervised classification method developed from statistical learning theory that often generates good classification results from complex and noisy data. To solve the non-linear-separable problem in the original lower dimension space, SVM transformed it into a higher one, using a kernel function, to make it linear-separable (Wu, Lin et al., 2004). The higher dimensional surface that maximums the margin between the classes is called optimal hyperplane, and the data points closest to the hyperplane are called support vectors, which are critical elements of the training set. For road classification, manually collected ROI of roads are needed, and SVM would classify whether a pixel does or does not belong to road class (Exelis Visual Information Solutions, 2017).
A kernel function gives the weights of nearby data points in estimating target classes. There are four types of kernel function: Linear, Polynomial, Radial Basis Function and Sigmoid. The mathematical representation of each kernel is listed below:
Linear: K(� , � ) = � � (4)
Polynomial: K(� , � ) = �� � + r (5) Radial basis function: K(� , � ) = exp −�‖� − � ‖ (6) Sigmoid: K(� , � ) = tanh g� � + r (7)
where g=the gamma term in the kernel function for all kernel types except linear.
d=the polynomial degree term in the kernel function for the polynomial kernel.
r=the bias term in the kernel function for the polynomial and sigmoid kernels.
Additionally, three other parameters respectively named pyramid level, penalty parameter and classification probability threshold are needed in every SVM procedures and are significant for satisfactory road classification results.
The pyramid level is the number of hierarchical processing levels to apply during the SVM to avoid under-classification or over-classification. The penalty parameter allows a certain degree of misclassification, controls the trade-off between allowing training errors and forcing rigid margins, theoretically permits some training points on the wrong side in the hyperplane, and thus the SVM model is with high fault-tolerance and flexibility. The classification probability threshold indicates the confidence that the closest segment represents the same class of that segment, so the higher threshold value, the fewer nearest segments will be classified and the more unclassified segments in the image. In brief, the classification probability threshold can control the extent of classification.
After carefully setting required parameters, SVM is available for high-quality classification for roads, and the outputs are several band shaped polygons
2.3 Hole Detection
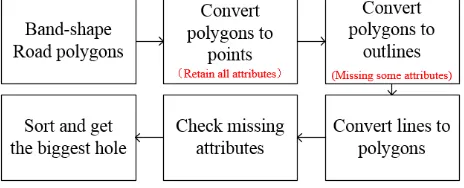
After road classification, the biggest hole in road should be at where the roundabout exists, and other smaller holes in road may be formed by vehicles or other insignificant reasons. Generally speaking, even though cars and side trees’ shadow can affect roads’ band shape and make holes inside, it can be sure that the biggest hole in road shapefile is formed due to the roundabout. To find the biggest hole in classified road polygons, four steps in GIS tools are needed, three of them are conversions (Fig.2). Firstly, convert the polygons to points, the points will contain full information about length, class ID, classname, area and original fid, etc. Next, convert polygon to lines, to restore the boundaries of road polygons in clockwise, including inside holes’ boundaries but in anticlockwise. The lines will contain left and right fids as attributes only. Then, convert the lines to polygons, to create polygons in all closed areas, and choose to preserve attributes using labels from the first step. Lastly, check attributes of the formed polygons from step 3, and those polygons with incomplete attributes, such as losing classname, area and original fid, are holes. Then select the holes by attributes, and find the biggest one. The output is a nearly circled polygon.
The hole detection successfully avoids direct topological determination and deals with the negative influences of the naturally formed gaps and deflections between the hole and the extracted roundabout shapefile creatively, and prepares for the next step: distance measuring.
2.4 Distance Measuring and Evaluation
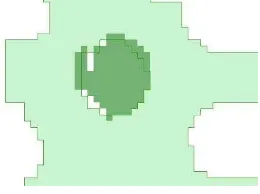
Although the extracted roundabout polygon’s margin and the biggest hole’s may not strictly coincide and the road polygon will not be ideally “contain” the roundabout in topological meanings due to deflections and gaps (shown in Fig.3) would still make direct topological relationship determination between the roads and roundabouts invalid. Therefore, the distance between the biggest hole’s centre and the extracted roundabout polygon’s centre, which are calculated by averaging all polygon’s vertexes’ coordinates, will be measured and compared with the threshold. A distance lower than the threshold will be seen as the proof of successful extraction that the roundabouts are approximately covers the hole, and lying roughly in the middle of the roads’ intersection.
Figure 3. Deflections and gaps
3. EXPERIMENT AND EVALUATION
To prove the feasibility and demonstrate the effect of the proposed methodology, ten roundabouts are successfully tested and extracted in three different cities’ images: Wuhan, E’ Zhou, Huangshi all in Hubei Province, China. High resolution multispectral images are provided by Chinese domestic satellite GF-2, which contains 4 bands: B(0.45-0.52μm), G(0.52-0.59μm), R(0.63-0.69μm) and NIR(0.77-0.89μm). GF-2 can produce high
quality sub-meter images, and the multispectral images are 7300*6908 pixel in size. A vegetated roundabout in E’ Zhou will be shown as an example, which locates at the cross of Dongwu Road and Hubin West Road and numbered as the 9th of ten roundabouts. The experiment is carried out in ENVI 5.3 sp and ArcGIS 10.2.
3.1 Preconditioning
After radiometric calibration and geometric correction, the remote-sensing images are registered according to governmental worldwide map provided in public WMS (Web map service) on http://www.scgis.net.cn/imap/iMapServer/defaultRest/services/ newtianditudom/WMS. Then the images are resized into smaller ones with 100*100 pixels when one pixel represents 3.77 meters in reality, and 400*400 pixels when one pixel represents 4 meters in reality (Fig.4(a)). Different sized pictures with various ground truth resolutions are designed to prove the robustness of the proposed automatic methodology.
3.2 Image segmentation and rule-based extraction
Since “rule-based feature extraction” tool contains image segmentation, using this tool and setting spectral constrains (area
and roundness) as well as spectral constrains (mean value of normalized difference, NDVI) is sensible.
Choose Band 3(R, b1) and 4(NIR, b2) are selected to be the normalized difference bands. Normalized difference is computed as follows, which is close enough to real NDVI value:
Normalized difference = � +� + �� −� (8)
where eps=a very small number to avoid division by 0
Since roundabouts have obvious edge and contain simple texture, for segmentation algorithm, choose edge schedule, whose default scale level is 50; for merging algorithm, choose full lambda schedule, whose default scale is 0, means no merging. For this roundabout, default setting can produce satisfactory segment results, since the extracted roundabout shapefile is round and intact (Fig.4(b)). In rule-based extraction, a rule with several constraint attributes can be founded, for example, “area should be in 100-200 m2”. A suitable rule should filter the segments and remain only the roundabout one. Therefore, choose the roundabout shapefile and get its area, roundness and NDVI value, and make the rule with these values. For the record, no weight settings of these three items in these experiments. Then the raster image of roundabout extraction(Fig.4(c)) and the roundabout shapefile are obtained.
(a) (b) (c) Figure 4. Segmentation and extraction. (a) Resized 400*400
pixel image. (b) Segmentation with numerous shapefiles, including a round intact roundabout one. (c) Rule-based extraction output, a raster image of roundabout extraction.
The area, roundness and NDVI values of ten roundabouts are shown as bellow (Table 1):
ID Coordinates Rd.Name Size(m2
) Roundness NDVI 1 114.368,30.571 Huangli 555.4803 0.584201 0.044186 2 114.377,30.569 Yanhu 1353.093 0.473994 0.122496 3 114.255,30.626 Changqing 897.3143 0.710775 0.072343 4 115.059,30.255 Huangshi 1623.712 0.737449 0.094100 5 114.378,30.580 Liyuan 1285.934 0.816796 0.117352 6 115.097,30.211 Yiyang 1373.633 0.764884 0.035440 7 114.825,30.417 Sihai 3926.975 0.908119 0.229562 8 114.920,30.398 Situ 1600.000 0.810996 0.239780
9 114.882,30.391 Dongwu 2432.000 0.855590 0.207698
3.3 Road classification and Hole detection
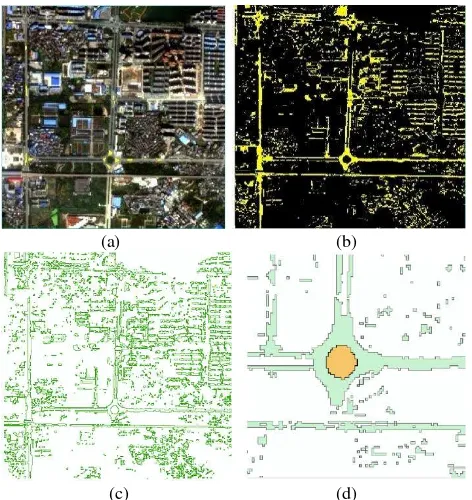
3.3.1 Road classification with SVM: Before running SVM classification, road ROI (Regions of Interests) should be manually collected from images as prior knowledge (Fig.5(a)). After that, Radial basis function is chosen as kernel function, since it works well in most cases. Function’s gamma is set as 0.25, penalty parameter is 100, pyramid level is 0, and classification probability threshold is 0.7. A symbol of successful SVM classification is that inside band shaped road polygons, there is an almost perfectly-round hole, which should ideally coincide with the roundabout (Fig.5(b)). Classification probability thresholds that present satisfactory outcomes may fluctuate in different images, due to different spectral properties, ROI collection difference and errors, etc. After SVM, the classification outputs have to be converted into evf documents, and then into shapefiles, as the preparation of next step in ArcGIS.
3.3.2 Hole detection: As mentioned above, hole detection contains four steps: convert road shapefile to points, convert road shapefile to boundary lines(Fig.5(c)), convert boundary lines to polygons, and check the shapefiles’ attributes to find the biggest hole. In summary, this method utilizes the knowledge that during several conversions, information of some attributes would be missing, to find the hole in roads. In ArcGIS 10.2, accordingly, sequentially use “feature to points”, “polygon to lines”, “feature to polygons”, and three different data conversion can be automatically done. Importantly, during the third conversion: feature to polygons, preserve attributes using the points generated in the first step, or the holes will not be automatically found. Then choose the shapefile generated from step 3 “feature to polygons”, find the polygons that missing classname, area and original fid, which are holes. For holes, sort their attributes by area, and pin down the biggest one. Eventually, the hole is generated as a new shapefile document(Fig.5(d)).
(a) (b)
(c) (d)
Figure 5. Road classification and hole detection. (a) ROI collection in bright yellow. (b) SVM classification. (c) Convert
road polygon to lines. (d) Successful hole detection and generation, the orange polygon is the hole.
3.4 Distance measurement
As an indirect topological relationship determination method, measuring the centres’ distance between the extracted roundabout and the hole is adopted to avoid misjudgement due to gaps and deflections. Centres of polygons (Fig.6) can be easily generated, using the “feature to point” tool.
Figure 6. Distance measurement. The black circle point is the centre of the extracted roundabout, and the red triangle one is
the centre of the detected hole.
Taking the average width of the different levels of roads in China into consideration, the threshold is set as 4 meters. Those polygons with distances lower than the threshold would be judged as a roundabout (shown in Table 2).
3.5 Evaluation
After distance measurement, the effect of roundabouts extraction should be measured. Therefore, extracted roundabouts are compared with manual interpretation (Fig.7), whose outcome is regarded as ground truth regions and thus several indexes in confusion matrixes are helpful (Table 2). The producer accuracy means the ratio of correctly classified pixels’ number (both in classification and selected by manual interpretation) to ground truth pixels’ number.
Reviewing the experiment, the reasons of generation of wrongly extracted and classified pixels are complicated, and are listed as follows.
GTR (m) Distance (m) Producer Accuracy
1 3.7 3.036 91.67%
2 3.7 3.271 86.02%
3 3.7 3.409 85.71%
4 3.7 2.308 92.63%
5 3.7 3.821 87.37%
6 3.7 3.286 90.32%
7 4 0.858 95.47%
8 4 2.461 94.06%
9 4 2.604 96.67%
10 4 2.486 94.74%
Table 2. Ground Truth Resolution (GTR), Distance between centres of extracted polygon and hole, Production accuracy and
omission.
precondition, avoiding resampling with better machine and carefully setting parameters, improved results can be achieved. It should be noted that Table 2 does not contain two numbers: the rate of the number of wrongly classified pixels that calculated as other classes but actually belong to ground truth roundabouts to the number of extracted roundabout’s pixels, and the rate of the number of wrongly classified pixels that calculated as roundabout but actually do not belong to ground truth roundabout to the number of extracted roundabout’s pixels. They may be important in statistic meanings and need more research.
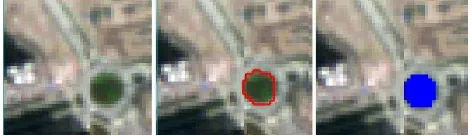
Figure 7. Evaluation. (a) Part of a remote sensing image (b) Output of automatic segment, a roundabout shapefile
(c) Manually interpreted roundabout (in blue).
However, it can be noticed that in each case, distance is lower than 4 meters and producer accuracy is higher than 85%, which are direct proofs that the proposed algorithm works very well in different circumstances. As mentioned above, this method is reliable and can make convincing results, which can surely benefit the society in municipal engineering, traffic navigation and social researches.
Comparing automatic extracted roundabout with manually interpreted one, there are several deductions. Generally, the automatic extracted roundabouts’ outlines are less smooth and less round than the manually interpreted ones. The automatic ones often wrongly contain road pixels or omit roundabout pixels due to spectral or spatial differences, but the omission usually does not rise to 15%.
4. CONCLUSIONS AND FUTURE STUDIES
The presented novel and automatic four-step roundabout extract algorithm is proved to be convincing and reliable. After watershed segmentation and merging, the roundabouts are rule-based extracted while roads are classified through SVM with holes detected. Measuring the distances between centres of the roundabout and the hole and generating confusion matrix with producer accuracy would be the evidence of successful extraction. In distance measurement and producer accuracy, each test case is lower than 4 meters and higher than 85% respectively, which show the extractions are precise in location and trustworthy in reality. The creative distance measurement successfully allows the inevitable existence of deflections and gaps between road’s hole and extracted roundabouts and still makes correct determinations. Furthermore, the algorithm is also proved robust in different cities’ resized data with various ground truth resolutions.
The distance and producer accuracy can be improved by a more meticulous preconditioning, a more careful parameters choice and avoiding resampling.
However, the proposed algorithm cannot deal with roundabouts that are not vegetated, such as directly painted roundabouts in road or some planted roundabouts during withering seasons in high latitudes. Furthermore, in each case, the roundabouts’ calculated NDVI value is not high enough as expected, though they do remain as top 40% NDVI in the whole image. Future studies may focus on simpler hole detection, roundabouts’ texture researches, experiments with more roundabouts and improvements in fewer deflections and gaps.
REFERENCES
Chai, Z., 2007. Design of rural roundabout squares. In: Technology of Gansu, China, 23(3), pp. 176-178. (In Chinese)
Erus, G., 2008. Classification and Detection of Structural Cartographic Objects on High Resolution Satellite Images. 75270 PARIS CEDEX 06,
Exelis Visual Information Solutions, Inc. 2017. Feature Extraction "Merge Algorithms Background", US http://harrisgeospatial.com/docs/backgroundmergealgorithms.ht ml (2017).
Exelis Visual Information Solutions, Inc. 2017. Feature Extraction "Rule Classification Background", US http://harrisgeospatial.com/docs/backgroundruleclassification.ht ml (2017).
Exelis Visual Information Solutions, Inc. 2017. Feature Extraction "Segmentation Algorithms Background", US http://harrisgeospatial.com/docs/backgroundsegmentationalgorit hm.html (2017).
Exelis Visual Information Solutions, Inc. 2017. Classification Tools "Support Vector Machine", US http://harrisgeospatial.com/docs/supportvectormachine.html (2017).
Mancini, A., et al., 2009. Automatic extraction of urban objects from multi-source aerial data. In: Proceedings of CMRT09: Object Extraction for 3D City Models, Road Databases and
Traffic Monitoring—Concepts, Algorithms and Evaluation, pp.
13-18.
Raaijmakers, M. and M. E. Bouzouraa, 2015. In-vehicle Roundabout Perception Supported by A Priori Map Data. Intelligent Transportation Systems (ITSC), 2015 IEEE 18th International Conference on, IEEE.pp. 437-443.
Ravanbakhsh, M. and C. Fraser, 2009. Road roundabout extraction from very high resolution aerial imagery. In: International Archives of Photogrametry and Remote Sensing, pp. 19-26.
Robinson, D. J., et al., 2002. Implementation of a fast algorithm for segmenting SAR imagery,
Roerdink, J. B. and A. Meijster, 2000. The watershed transform: Definitions, algorithms and parallelization strategies. In: Fundamenta informaticae, 41(1, 2), pp. 187-228.
Wu, T.-F., et al., 2004. Probability estimates for multi-class classification by pairwise coupling. In: Journal of Machine Learning Research, 5(Aug), pp. 975-1005.