Estimating carbon inputs to soil in forage-based crop
rotations and modeling the effects on soil carbon dynamics
in a Swedish long-term field experiment
M. A. Bolinder
1,2, T. Ka¨tterer
1, O. Andre´n
3, and L. E. Parent
21Swedish University of Agricultural Sciences (SLU), Department of Soil and Environment, Box 7014, S-75 007
Uppsala, Sweden (e-mail: [email protected]);2Department of Soils and Agrifood Engineering, Universite´
Laval, 2425 rue de l’Agriculture, G1V 0A6 Que´bec, Canada; and3oandren.com, Bjo¨rklundav. 3, S-756 46 Uppsala,
Sweden.Received 10 April 2012, accepted 31 July 2012.
Bolinder, M. A., Ka¨tterer, T., Andre´n, O. and Parent, L. E. 2012.Estimating carbon inputs to soil in forage-based crop rotations and modeling the effects on soil carbon dynamics in a Swedish long-term field experiment. Can. J. Soil Sci.92: 821833. There is a need to improve the understanding of soil organic C (SOC) dynamics for forage-based rotations. A key requisite is accurate estimates of the below-ground (BG) C inputs to soil. We used the Introductory Carbon Balance Model (ICBM) to investigate the effects of C input assumptions on C balances with data from a 52-yr field experiment in northern Sweden. The main objective was to validate an approach for estimating annual crop residue C inputs to soil using the data from a continuous forage-based rotation (A). A rotation with only annual crops and more frequent tillage events (D) was used to obtain a rough estimate of the effect of tillage on SOC dynamics. The methodology used to estimate annual crop residue C inputs to soil gave a good fit to data from four out of the six large plots for rotation A. The approximate effects of more frequent tillage in rotation D increased SOC decomposition rate by about 20%. These results allow us to have more confidence in predicting SOC balances for forage-based crop rotations. Root biomass measurements used for calculating BG C inputs were also reviewed, and we show that they have not changed significantly during the past 150 yr.
Key words: Introductory Carbon Balance Model concept, cool temperate climate, roots, carbon sequestration, forage crops
Bolinder, M. A., Ka¨tterer, T., Andre´n, O. et Parent, L. E. 2012.Estimation des apports de carbone au sol dans des rotations incluant des plantes fourrage`res et mode´lisation de leurs effets sur la dynamique du carbone dans un essai au champ de longue dure´e en Sue`de. Can. J. Soil Sci.92: 821833. Afin d’ame´liorer la compre´hension de la dynamique du C organique du sol (COS) dans les rotations incluant des plantes fourrage`res, l’e´le´ment cle´ re´side dans de bonnes estimations des apports annuels de C au sol issus de la partie souterraine (PS). Les stocks de COS d’un essai au champ de longue dure´e dans le nord de la Sue`de ont permis de ve´rifier diffe´rentes hypothe`ses d’apport de C sur le bilan du COS a` l’aide du mode`le d’introduction au bilan du carbone (ICBM). L’objectif principal de l’e´tude e´tait de valider une approche pour estimer les apports annuels de C au sol a` partir des donne´es pour une rotation avec plantes fourrage`res en continu (‘A’). Une rotation incluant seulement des cultures annuelles et assujettie a` un travail du sol plus fre´quent (‘D’) e´tait utilise´e pour calculer un estime´ approximatif de l’effet du travail du sol sur la dynamique du COS. La me´thodologie employe´e pour estimer les apports annuels de C au sol via les re´sidus de culture a permis de faire de bonnes pre´visions sur l’e´volutions des stocks de COS dans quatre des six grandes parcelles de la rotation ‘A’. L’analyse de la rotation ‘D’ sugge`re qu’un travail du sol plus fre´quent a fait augmenter le taux de de´composition du COS d’environ 20%. Ces re´sultats nous permettent de faire des pre´dictions du bilan de la COS avec plus de certitude dans des rotations incluant des plantes fourrage`res. E´galement, une revue de litte´rature sur les mesures de biomasse racinaire qui sont utilise´es pour calculer les apports annuels de C au sol issus de la PS re´ve`le qu’ils n’ont pas change´ significativement au cours des 150 dernie`res anne´es.
Mots cle´s: Concept ICBM, climat frais et tempe´re´, racines, se´questration du carbone, plantes fourrage`res
The beneficial effect of forage crops and manure applications on soil organic matter (SOM) content and nutrient cycling is not a new observation. Already in the golden age of Greeks (800 to 200 BC) it was observed that manure increased crop productivity, and that green manure crops enriched the soil (Sarton 1959). However, the theories related to these issues were fairly esoteric and sometimes controversial (Manlay et al. 2007). The fact that grasses increase SOM content was highlighted in several investigations in the beginning of the 20th century in, for example, Europe and North America [see references cited in Troughton (1957)]. Since the 1940s,
SOM has been firmly recognized in its role in relation to soil quality and fertility and many other ecosystem services (Manlay et al. 2007).
It is well established that suitable management options can sequester carbon through a sustained in-crease in SOM content, and thereby contribute to the
Abbreviations: AG, above ground;BG, below ground;DM, dry matter;ER, extra-root;F, forage;GAI, green area index;GF, green fodder;GM, green manure;ICBM, Introductory Carbon Balance Model;P, peas;RC, root crops;SOC, soil organic carbon;SOM, soil organic matter;UB, undersown barley;WR, winter rye
Can. J. Soil Sci. (2012) 92: 821833 doi:10.4141/CJSS2012-036 821
Can. J. Soil. Sci. Downloaded from pubs.aic.ca by University of Laval on 07/06/15
reduction of greenhouse gases in the atmosphere. This includes strategies such as conversion of cropland to grasslands, avoided conversion of grasslands, and improved grassland management [Intergovernmental Panel on Climate Change (IPCC) 2000, 2006; Lal 2004; Smith 2004]. The Chicago Climate Exchange (2009) soil organic C change factors (2009) for con-version to grasslands are 0.67 Mg C ha1
yr1
for most of the temperate US regions, in track with a meta-analysis of published data by Eagle et al. (2010). Empirically derived data from long-term field experi-ments in Canada comparing perennial grass cover to annual cropping systems resulted in an average soil organic C stock change factor of about 0.60 Mg C ha1
yr1
for forages (VandenBygaart et al. 2010). The carbon sequestration potential (i.e., increased SOM content) of converting cropland to grassland in Europe has been estimated to range from 1.20 to 1.70 Mg C ha1
yr1
(Smith et al. 2000; Smith 2004).
Although knowledge has accumulated through time, modeling SOM dynamics in forage-based crop rotations as a function of above-ground (AG) plant production and management for various soil and climatic condi-tions still remains a challenge (Jensen et al. 1997). Indeed, the SOM dynamics in forage-based crop rota-tions can be attributed to several agro-ecosystem factors. For instance, compared with annual crops there is a reduced soil disturbance from tillage in perennial forage-based crop rotations. When a crop is moldboard plowed, the soil is broken up and more vulnerable to SOM decomposition as well as water and wind erosion. Besides, tillage will also directly contribute to movement of soil, e.g., from upland positions to depressions (Lal et al. 2007). Some of the surface soil particles, often rich in SOM, are only redistributed over the landscape. Others are deposited in depressions or transported into aquatic ecosystems where a part of the C is lost to the atmosphere as CO2 through mineralization or methanogenesis (Lal 2004). It is also well documented that tillage disrupts soil aggregates. Although all the mechanisms are not fully understood, this disturbance usually leads to decomposition of SOM compounds because of reduced physical protection (Six et al. 2004; Bronick and Lal 2005). Furthermore, perennial forage crops have a root system with root turnover and rhizodeposition during more of the growing season than roots of annual crops, as well as a higher relative allocation of C below-ground resulting in a higher root biomass (Bolinder et al. 2007a). Forage systems (usually in cattle farms) are also often subjected to frequent C input from manure applications (including return of dung during grazing) that contribute to the buildup of SOM (Paustian et al. 1997; Bolinder et al. 2010).
Most SOM models developed for agro-ecosystems accounts for variations in specific climatic and soil conditions through information on daily or monthly climatic data in association with basic crop and soil (e.g., texture) properties. These data are used to
cal-culate the effect of soil water content and temperature on SOM decomposition rates through pedotransfer and biological response functions. The effect of tillage intensity (e.g., moldboard plowing versus harrowing) and frequency (e.g., annual crops only versus annuals in forage-based rotations) on C evolution in the tilled layer is included in many SOM models. This is done by increasing the decay rates of the different SOM pools (e.g., Century/DAYCENT, Ecosys) or using a simple scaling of SOM model parameters (e.g., ICBM, CN-SIM) (Ka¨tterer et al. 2008; Chatskikh et al. 2009). However, most of the models do not account for the fact that tillage may temporarily decrease bulk density and that it can change soil hydraulic properties (Sommer et al. 2007). The magnitude of the annual C inputs to soil is one of the crucial factors for SOM model-ing (Andre´n et al. 2008). Annual C inputs to soil are typically calculated from information on AG plant production and root biomass measurements. However, the approaches used to estimate these C inputs for forage crops vary widely and are often poorly described, but, most importantly, they need to be validated by long-term field data.
ICBM is a two-pool and five-parameter soil C balance model that calculates changes in soil C stocks and has been applied in several temperate regions for estimating regional C balances (Andre´n et al. 2008; Borgen et al. 2012; Lokupitiya et al. 2012). ICBM includes a soil biological activity factor for annual crops, a scaling parameter which is a multiplier in the first-order decomposition rates of the two SOM pools to account for cultivation, and a parameter used to represent annual C inputs to soil. There is a need to improve the model parameter estimates for describing SOM dynamics in the northern areas of temperate regions that are dominated by grass leys. Our objectives in this study were: (I) to describe and test an approach for estimating annual C inputs to soil for forage crop-ping systems, (II) to calculate a soil biological activity factor specific for forages, and (III) to refine the scaling parameter for cultivation. This was done using data from a 52-yr field experiment in northern Sweden, where measurements of SOM dynamics in different forage-based crop rotations were available.
MODELING SOM DYNAMICS IN TEMPERATE REGONS
Annual C Inputs to Soil for Forage-based Crop Rotations
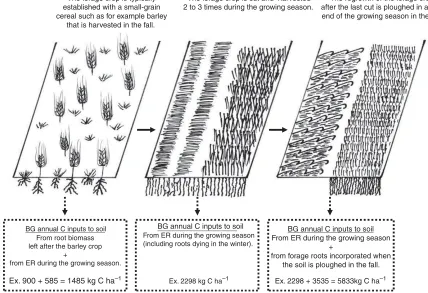
It is not easy to estimate the annual C inputs to soil in forage-based crop rotations (or grasslandpasture systems) and they have been highlighted as a prioritized research area due to their crucial role in the modeling of SOM dynamics (e.g., Jensen et al. 1997). The forage crop is usually established together with a small-grain cereal (i.e., undersown), thereafter growing for a number of years until the end of the rotation (Fig. 1).
Can. J. Soil. Sci. Downloaded from pubs.aic.ca by University of Laval on 07/06/15
The standing root biomass for the forage crop is only incorporated at the end of the rotation; in phase II the below-ground (BG) input to soil for the forage crop is only originating from extra-root (ER) C. The ER-C can be defined as turnover (individual roots dying and decomposing) and cell sloughing of epidermal root tissues during the growing season, and soluble com-pounds released from the roots by exudation (Andre´n et al. 1989). The amount of ER-C is not included in root biomass estimates by soil coring or excavation. To account for this component in the annual C inputs to soil we need a coefficient that multiplies the root biomass by the proportion (%) of ER-C produced during a growing season (root respiration is not included because the CO2 is returned to the atmo-sphere). Information on this is often obtained from tracer (14C, 13C) studies, particularly for cereal crops. This can also be quantified using the physical difference in root biomass from successive temporal measure-ments. For example, Dahlman and Kucera (1965) calculated root turnover by dividing the net annual significant increment in root biomass (i.e., maximum minus minimum value determined with sequential
measurements) with the maximum value of measured root biomass.
There has been early interest in compiling literature data on root biomass for forages and small-grain cereal crops (Table 1). The most extensive review on forages was presented by Troughton (1957), who reviewed published data for different swards; some Russian data for grass mixtures and individual species was presented by Kononova (1961), while Goedewaagen and Schuurman (1950a, b) calculated mean values for small-grain cereals. More recently, Bolinder et al. (2007a) summarized a number of Canadian studies (including some from the United States) for both cultivated forages and small-grain cereals. It is clear from these data that root biomass for forages can often be at least three times that of small-grain cereals. The estimated mean values and relative differences between these two types of crops have remained fairly similar in earlier and more recent literature surveys.
Root biomass measurements obtained under Swedish conditions are similar and within the range of these observations. For instance, early measurements made by Torstensson (1938) reported maximum values for
Phase I: Establishment (yr 1) The forage crop is typically established with a small-grain cereal such as for example barley
that is harvested in the fall.
Phase II: Production (e.g., yr 2 to 5) The forage crop is cut and harvested 2 to 3 times during the growing season.
Phase III: End of rotation (e.g., yr 6) The regrowth of the forage crop after the last cut is ploughed in at the end of the growing season in the fall.
BG annual C inputs to soil From root biomass left after the barley crop
+
from ER during the growing season.
Ex. 900 + 585 = 1485 kg C ha–1
BG annual C inputs to soil
From ER during the growing season (including roots dying in the winter).
Ex. 2298 kg C ha–1
BG annual C inputs to soil From ER during the growing season
+
from forage roots incorporated when the soil is ploughed in the fall.
Ex. 2298 + 3535 = 5833kg C ha–1
Fig. 1. Description of the three phases related to the growth of a forage crop in the northern parts of temperate climates and the annual C inputs to soil associated with the below-ground (BG) component. See the text for explanations with respect to the extra-root C (ER-C). The examples given for the flux of BG annual C inputs to soil for each phase was calculated from the data for mean root biomass (Table 1) and using a mean ER-C coefficient of 65%, assuming a C content of 0.45 g g1
in root tissues, e.g., for phase III: C from roots7855 kg DM45% C3535 kg C ha1and C from ER353565% ER-C2298 kg C ha1.
Can. J. Soil. Sci. Downloaded from pubs.aic.ca by University of Laval on 07/06/15
pastures:2800 kg dry matter (DM) ha1, while
Paustian et al. (1990) and Ka¨tterer and Andre´n (1999) reported mean values of about 6000 to 9000 kg DM ha1 for commonly grown forage species. Data for barley and wheat indicate a mean BG biomass of :1700 kg DM ha1(e.g., Paustian et al. 1990; Ka¨tterer et al. 1993).
There are several literature estimates of ER-C coeffi-cients for small-grain cereals and forages (Dahlman and Kucera 1965; Barber and Martin 1976; Johansson 1992; Gill and Jackson 2000; Kuzyakov and Domanski 2000; Bolinder 2004). For forages most studies have been conducted on grasslands and pastures, and here we assume they behave like a forage crop in an arable system. Furthermore, it is not always clear whether the coefficients for forages include the exudates, or the roots that die during the winter in the studies from the cooler northern regions. Some of these studies were the result of quite extensive literature surveys. In particular those of Gill and Jackson (2000) who estimated root turnover for grasslands using the defini-tion by Dahlman and Kucera (1965), and Kuzyakov and Domanski (2000) who reviewed tracer studies. The average ER-C from all the studies on small-grain cereals was 32% and that of forages 45%. By comparison, in a long-term (19791988) project on agroecosystems, Ecology of arable land the role of organisms in N cycling, Andre´n et al. (1989) concluded that the ER-C coefficient for these two types of crops would be :50% under Swedish conditions. However, common assump-tions have been made that the ER-C coefficient for crops can be as high as 100% (e.g., Rasse et al. 2005). Consequently, there is a wide range in reported values (i.e., 32 to 100%). In this study we use the plant C allocation coefficients proposed by Bolinder et al. (2007a), where an intermediate ER-C coefficient of 65% is used.
The examples of C fluxes from BG for each of the phases (Fig. 1) shows that the C input from BG is lowest for phase I, a little higher for phase II, and that the input from phase III is usually dominating a typical
forage-based crop rotation. In phase I it is often considered that the annual C input to soil from BG is calculated as if it was a small-grain cereal year. The AG C inputs to soil are naturally more straightforward, easily estimated as a proportion of the harvested biomass. Recently, a few simple equations have been proposed for estimating the BG C inputs to soil from forage-based crop rotations (e.g., Andre´n et al. 2004; Bolinder et al. 2007a) and there is a need to validate those equations using data from long-term field experiments.
The Offer Long-term Field Experiment In Northern Sweden
The Offer long-term field experiment is located in the ‘‘North’’ agricultural production region of Sweden (lat. 63.148N, long. 17.758E) and was initiated in 1956 (Andre´n et al. 2008). It was part of a study that compared forage yields in four 6-yr forage-based rotations at three sites (Offer, A˚s and Ro¨ba¨cksdalen). Soil organic carbon and nitrogen dynamics for these sites were presented by Bolinder et al. (2010). In this paper we use data for the Offer site for modeling SOM dynamics; this site was running for a longer time period than the other two and had the most detailed crop records and soil sampling program. A full description of the history of the site, the rotations, soil sampling and analysis are given in Bolinder et al. (2010), only a brief description is given here.
The four 6-yr rotations (A, B, C and D) contained the following crops: undersown barley (UB), forage (F), green fodder (GF which was either a mixture of oats
and peas, or fodder rape), winter rye (WR), peas (P), root crops (RC potato, carrot or rutabaga), green
manure (GM the forage crop was grown as green
manure) (Table 2). For each 6-yr period manure was applied twice in rotation A and B (equivalent to 4.48 Mg C ha1split in two applications) and once in rotation
C (equivalent to 2.99 Mg C ha1
). Each phase of the 6-yr rotations (i.e., year 1 to year 6) was present every year and grown in large plots (820 m) for a total of
24 plots (i.e., 4 rotations6-years). Seven complete Table 1. Summary of data from some literature surveys on quantitative estimates of root biomass (kg of dry matter per ha) for perennial forages and small-grain cereals covering work conducted from approximately the 1850s to the end of the twentieth century
Literature survey
Origin of data and
time-period N Mean9Std. Dev Min. Max.
Perennial forages Troughton (1957) Europe 18441955z 82 790897286 1131 47322
North-America 18891954z 92 702494936 1108 25101
Kononova (1961) Russia 19391949 19 936195166 3390 18000 Bolinder et al. (2007a) North America 19692003y 70 712794983 930 20120
Mean 7855
Small-grain cereals Goedewaagen and
Schuurman (1950a, b)x Europe 18661950 6 22509701 1400 3100
Bolinder et al. (2007a) North-America 19862001y 73 175091424 240 7000
Mean 2000
z
Calculated from the mean values presented in the appendix of that study.
yCalculated from the references cited in Bolinder et al. (2007a) that included mainly data from Canadian studies. x
Calculated from the mean values for wheat and winter wheat, barley and winter barley, oats and rye as cited by Troughton (1962).
Can. J. Soil. Sci. Downloaded from pubs.aic.ca by University of Laval on 07/06/15
rotation cycles were completed from 1963 to 2004. The time period between the initiation of the experiment and 1962 was used to establish the different phases of each rotation. During that period no detailed yield data were recorded.
Thereafter, the DM biomass of all AG plant parts was measured every year in each of the 24 plots. A few missing data in the files were estimated from the closest data point in time and space, and the yield records for forages were almost complete. The yield of F for each harvest (the number of harvests varied from 1 to 2) and the yield of GF was measured. Both the grain and straw yields were measured for the small-grain cereals (i.e., barley, oats and winter rye). The yields of peas and vines were measured separately. The yields were measured for all the RCs, but the vines were determined for carrot and rutabaga only. All small-grain cereal straw was left on the plots after harvest, as well as the vines from peas and RCs. For F grown as GM in rotation D the forage was cut at the end of July and cuttings left in the plots; thereafter the forage was allowed to grow until mid-August when it was plowed under. Since the yield was not measured for GM it was calculated from the average AG biomass by using the average of the first production year of F in rotation A, B and C. No root biomass measurement was made for any crop.
The site was sampled in the fall of 2008 for the 0- to 25-cm soil layer by taking three soil cores in each of the plots. Dry soil bulk density was calculated, and soil organic carbon (SOC) was determined by dry combus-tion (LECO CNS 1000), and final SOC stocks were thereafter calculated for each plot. We also used the concept of ‘‘equivalent soil mass’’ to estimate the changes in SOC stocks through time; the calcula-tions are described in detail by Bolinder et al. (2010), where they were applied to the mean values of the four different rotations. In this paper we made a more detailed analysis with focus on rotation A and D by calculating the changes in SOC stocks for each individual plot.
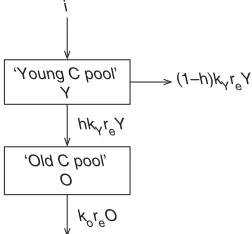
The ICBM Concept and Parameterization
The Introductory Carbon Balance Model (ICBM) is a two-compartment first-order kinetic model with two state-variables; ‘‘Young’’ (Y) and ‘‘Old’’ (O) SOC pools with specific decomposition rates (kY and kO, respec-tively) (Fig. 2). The first-order decomposition rates
(kY0.8 andkO0.007) are held ‘‘constant’’ according
to the original calibration (Andre´n and Ka¨tterer 1997; Andre´n et al. 2004). These decomposition rates are thereafter modified by a soil climate-management para-meter (re) that summarizes the effect of climate and tillage on soil biological activity (i.e., re multiplies the first-order decomposition rates of the two SOC pools in ICBM) as described below in more detail. The annual C inputs to soil (i) come from above- and below-ground crop residues and from manure that enters the model through the ‘‘Young’’ (Y) SOC pool. The humification coefficient (h) determines the fraction of these annual C inputs to soil (i) that enters the ‘‘Old’’ (O) SOC pool. We used the same humification coefficients for crop residues (hY0.125) and manure (hM0.310) as in the study by Ka¨tterer et al. (2008), which were based on those of Andre´n and Ka¨tterer (1997) who calibrated the model on a long-term site in central Sweden.
The total SOC stocks at Offer in 1956 were 8.19 kg C m2
to 25-cm depth (Bolinder et al. 2010). This amount was used as the initial value for each of the plots since only composite soil samples from each replicate were used to determine C concentrations in 1956. These C concentrations were uniform across the site [for more details see Bolinder et al. (2010)]. The initial C mass in each of the SOC pools was estimated as described by Ka¨tterer et al. (2008) by assuming that the young pools were in approximate equilibrium with the previous conditions at the site. For that purpose we used the estimated parameter values of re and i for rotation B Table 2. Summary of the four 6-yr rotations for the Offer site in northern Sweden
Rotation A Rotation B Rotation C Rotation D
Year 1 Undersown barley Undersown barley Undersown barley Undersown barley
Year 2 Forage Forage Forage Green manure
Year 3 Forage Forage Forage Winter rye
Year 4 Forage Forage Winter rye Peas
Year 5 Forage Green fodder Green fodder Root crop
Year 6 Forage Fodder rape Root crop Root crop
i
‘Young C pool’ Y
‘Old C pool’ O
(1–h)kYreY
hkYreY
koreO
Fig. 2.Structure of the Introductory Carbon Balance Model (ICBM): iannual C inputs to soil, kY and kO first-order decomposition rate constants for the Young and Old SOC pools,hhumification coefficient, resoil climate-management parameter.
Can. J. Soil. Sci. Downloaded from pubs.aic.ca by University of Laval on 07/06/15
to derive initial data for all rotations, since that rota-tion reflected the most common previous management practices. Consequently, the initial mass from crop residues was 0.378 and that from manure 0.109 kg C m2
. The initial size of the old SOC pool (7.703 kg C m2
) was set to the difference between the total SOC stocks measured in 1956 and the sum of these two fractions.
Estimating the Soil Climate-management
Parameter (re)
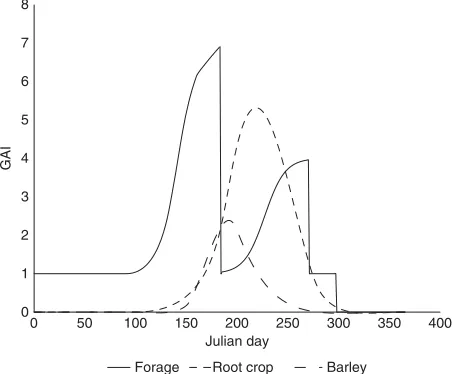
The soil climate-management factor, re, is governed by three components: soil water content (rw), soil tempera-ture (rT) and tillage intensity (rc). These three compo-nents are assumed to be multiplicative, i.e., rerW rTrC. Where the rc component (i.e., tillage) has previously been based mostly on assumptions and expert opinion (Andre´n et al. 2004; Ka¨tterer et al. 2008). The first two components (rW and rT) are estimated with a soil climate module connected to ICBM. This module uses daily standard meteorological data, a soil water model, and commonly used assumptions with respect to the relationships between temperature, soil water con-tent and biological activity (Andre´n et al. 2004, 2007; Bolinder et al. 2007b, 2008). It also uses green area index (GAI) dynamics that influence both the rW and rT components. The GAI is defined as the projected area of all plant parts that are visibly green (Ka¨tterer and Andre´n 2008).
The drivers for estimating rw are daily precipitation and potential evapotranspiration data and two soil parameters: water content at wilting point (uwp) and at field capacity (ufc). The difference between uwp and ufc defines the storage capacity of plant-available water. Furthermore, GAI is governing the plant water requirements for transpiration. Daily climatic data (air temperature, potential evapotranspiration and precipi-tation) were taken from the Sundsvall airport situated about 80 km from the experimental site. Daily values were available for the period from 1961 to 2005. For the periods 1957 to 1960 and 2006 to 2008 we used records from 1961 to 1964 and 2003 to 2005, respectively.
Pedotransfer functions developed from a Swedish soil database (model 7; Ka¨tterer et al. 2006) were used for estimating ufcand uwp from soil texture and C concen-trations. Since soil C concentrations changed over time in the treatments, we estimated these parameters for both 1957 and 2008 and calculated intermediate values by linear interpolation. The water content at wilting point did not change with time and was 0.126 m3m3
. The water content at field capacity was 0.434 m3m3 in 1957 and changed depending on changes in soil C (Table 3). In 2008, ufc was 12% higher in rotation A than in rotation D. These estimates forufcanduwpwere close to those measured in an adjacent field, i.e., 0.128 and 0.456 m3m3, respectively (Andersson and Wiklert
1977).
Annual dynamics of GAI is governed by empirical functions, the amplitude (GAImax) of which is related to the mass of harvested products and a crop specific parameter related to the length of the vegetation period. For undersown barley and winter rye we used the function presented by Bolinder et al. (2008). For root crops, we used a fixedGAImax(5.6) according to data from potatoes (Fortin 2008). For forage crops, we simulated leaf area dynamics with logistic functions for the two seasons between the cuts. Estimates of GAImax (1.8DM yield in Mg ha
1
) were based on data from Be´langer and Richards (1995) using the assumption that GAImax did not exceed a value of 10 m2 m2
. If not recorded in log-files from the ex-perimental station, we assumed reasonable dates for management operations (sowing, harvesting, plowing etc.). The typical GAI dynamics of the different crops contributes to the difference in the soil climate/manage-ment factor between continuous forage rotations versus rotations with annual crops (Fig. 3).
The simple bucket-model used to calculate daily soil water content was based on concepts as described in Table 3. Mean soil organic carbon (SOC) content and estimated soil water content at field capacity (ufc) in the 0
25 cm soil layer in 2008 for each of the four rotations at Offer
Rotation SOC ufc
Fig. 3. Representation of typical green area index (GAI) dynamics for forages, root and barley crops. The GAI is here defined as the projected area of all plant parts that are visibly green and was estimated with different functions, as described in the text.
Can. J. Soil. Sci. Downloaded from pubs.aic.ca by University of Laval on 07/06/15
detail by Karlsson et al. (2011) and Fortin et al. (2011). This model involves parameters for precipitation and crop interception of precipitation; both of these are modulated by the GAI. A semi-empirical model was used for estimating daily soil temperature from air temperature and leaf area index as described by Ka¨tterer and Andre´n (2008). Leaf area index was assumed to be 80% of GAI [see Ka¨tterer and Andre´n (2008) for details]. Daily soil water and soil temperature were transformed into the activity factors, rw andrT, respec-tively, and the resulting annual means of the product rwrT calculated for each day were then divided by a constant scaling factor which refers to conditions at the reference sites used for model calibration [see Bolinder et al. (2008) for details]. All calculations were conducted for each experimental plot.
Estimating Annual C Inputs to Soil (i)
We used the plant C allocation coefficients as described in detail by Bolinder et al. (2007a) to estimate the annual C inputs to soil from BG for the undersown barley, forage and green manure crops. The coefficients were based on a review on plant shoot-to-root ratios for these crop types. We considered that 40% of the total annual AG production for forage was returned to the soil, i.e., as litter fall and harvest losses during the growing season plus the regrowth after the last cut dying during the winter. For the crop types in rotation D that were not addressed in Bolinder et al. (2007a), we used data from a Swedish field study and calculated BG input for winter rye with a shoot- to root-ratio of 13.5 (Ka¨tterer et al. 1993). The BG input for peas was based on data from Wichern et al. (2007). The shoot refers to the total AG material (i.e., grain, straw, vines etc.). We used a fixed estimate (0.12 kg DM m2
) of BG input for the potato crop (Carter et al. 2003) and for the other two root crops (i.e., carrot and rutabaga). We assumed that the C content of all plant parts was 0.45g g1
and the ER-C coefficient was set to 0.65.
RESULTS AND DISCUSSION Annual C Inputs to Soil and Climate Factors
The average annual C inputs to soil from crop residues (1957 to 2008) were similar between rotations A and D, with 0.280 kg C m2
yr1
for rotation A and 0.276 kg C m2yr1for rotation D. The continuous forage-based
rotation A also received manure applications equivalent to 0.075 kg C m2
yr1
and the total annual C input to soil was therefore higher than that for rotation D. The BG C inputs were higher in rotation A (0.170 kg C m2 yr1) compared with those of rotation D (0.126 kg C
m2 yr1
).
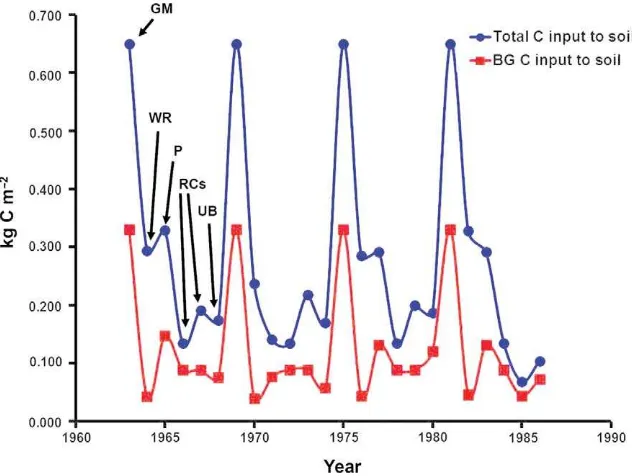
There were inter-annual variations in the total and BG annual C inputs to soil in the rotations, both between crop types and for a given crop type (Figs. 4 and 5). The forage crop grown at the end of rotation A and the green manure crop in rotation D
contributes the most to the total annual C inputs to soil from crop residues, while the undersown barley contributes a similar amount in both rotations. The winter rye, undersown barley, peas and the root crops generally contribute a smaller amount of BG C, compared with the forage crop at the end of rotation A and the forage crop grown as green manure in rotation D.
The annual amount of BG C inputs to soil for the three phases related to the continuous forage-based crop rotation A (Fig. 4) was estimated using the Bolinder et al. (2007a) methodology. Considering the entire period from 1957 to 2008, our values for the annual BG C input were 1.0290.27 Mg C ha1
yr1
for the undersown barley, 1.4390.40 for the forage crop grown in a production year and 3.4490.93 Mg C ha1yr1
for the forage crop grown at the end of rotation A. This is lower than the example of values presented in Fig. 1 (1.49, 2.30 and 5.83 Mg C ha1
yr1
, respectively) and is explained by the fact that the estimates of BG input is specific to the AG productivity at the Offer site. The Bolinder et al. (2007a) methodology also includes specific assumptions about the BG allocation based on the values that were reviewed for Canada. However, the relative differences in BG C inputs to soil between the three phases we obtained with our approach are similar to those from a broader perspective, as presented in Fig. 1.
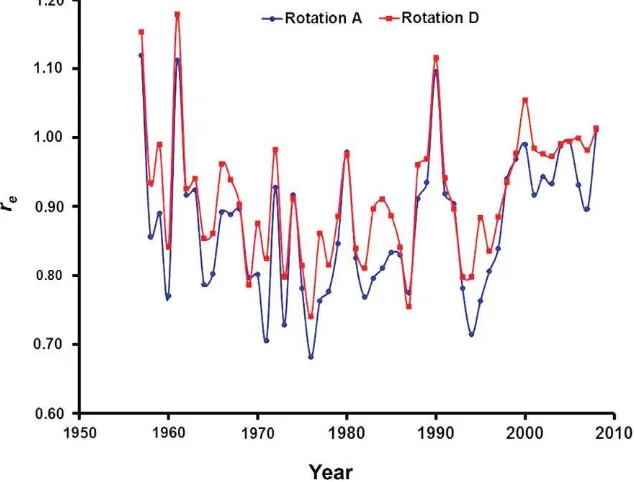
The two main driving variables used to estimate the effects of climate on SOC decomposition are air tem-perature and total precipitation (Fig. 6). They are used to calculate the multiplicative soil-temperature (rT) and soil-moisture (rW) factor that results in the soil-climate parameter re (Fig. 7). In the ICBM, annual average values forrewere used when simulating changes in SOC stocks through time. However, the re parameter is calculated using daily time-steps for the climatic input data because it has been shown that this allows a more accurate estimate for temperate regions (Fortin et al. 2011). Considering the average value of the six plots for each rotation over the time period 1957 to 2008, there value for Offer was 0.88 for rotation A and 0.92 for rotation D (Table 4). Because the total steady-state C mass is linear in response to the ICBM re and i parameters (Andre´n and Ka¨tterer 1997). This means that it would be necessary to have an annual C input to soil about 5% higher (i.e., 0.92/0.88) for rotation D in order to reach the same steady-state soil C mass as that for rotation A.
The first-order decomposition rates for the ‘‘young’’ (kY) and ‘‘old’’ (kO) SOC pools in ICBM are multiplied by the soil-climate parameter. Consequently, re also affects the inter-annual variations in decay rates (Fig. 7). Other components of the ecosystem, both biotic and abiotic related factors (e.g., soil structure and earthworm activity), also play a role in temporal variations in SOC decay rates, but they are less well documented and orders of magnitude more difficult to
Can. J. Soil. Sci. Downloaded from pubs.aic.ca by University of Laval on 07/06/15
quantify compared with the effect of climate for which reasonable assumptions are made in most SOC models. The inter-annual range inrefor the Offer site was about a factor 2, with an average minimum and maximum value of 0.66 and 1.15, respectively.
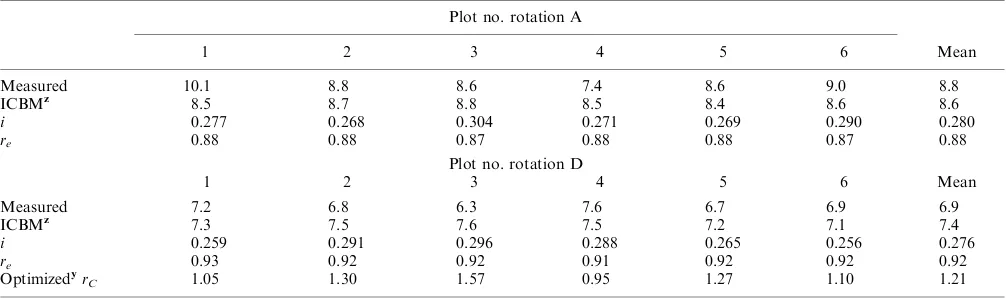
Predicting Final SOC Stocks with ICBM
The predicted final SOC stocks with the ICBM for rotation A were close to those measured for four of the six plots (plot no. 2, 3, 5 and 6), for which the deviation from measured final SOC stocks was less than 5% Fig. 4.Total and below-ground (BG) annual C inputs to soil from crop residues in one of the six large plots for rotation A during 1963 to 1986 (time period when the most detailed yield data were recorded). The phases of this 6-yr crop rotation from 1963 is as follows: 4 yr of forage in production (F-PY), 1 yr of forage in the end of rotation (F-EOR) and 1 yr of undersown barley (UB).
Fig. 5. Total and below-ground (BG) annual C inputs to soil from crop residues in one of the six large plots for rotation D during the period 1963 to 1986. The phases of this 6-yr crop rotation from 1963 is as follows: 1 yr green manure (GM), 1 yr of winter rye (WR), 1 yr of peas (P), 2 yr of root crops (RC) and undersown barley (UB).
Can. J. Soil. Sci. Downloaded from pubs.aic.ca by University of Laval on 07/06/15
(Table 4). For rotation D, final SOC stocks for three of the six plots (plot no. 1, 4 and 6) was also predicted with less than 5% deviation, and two plots (plot nos. 2 and 5) with about 10% deviation from measured final SOC stocks. The final measured SOC stocks were somewhat lower than the overall mean values for plot no. 4 in
rotation A and plot no. 3 in rotation D. Consequently, ICBM over-estimated the final SOC stocks for these two plots. ICBM under-estimated the final SOC stocks for plot no. 1 in rotation A since the measured final SOC stocks for this plot were high. We have no particular explanation why the measured final SOC stock values for
1982 2008
1957
(°C)
(mm)
Year 0.0
1.0 2.0 3.0 4.0 5.0 6.0
0 200 400 600 800 1000 1200
Mean annual temperature Mean annual total precipitation
Fig. 6.Mean annual temperature and total precipitation during 1957 to 2008 for the Sundsvall weather station.
Fig. 7.The mean annual soil climate-management parameter (re) for two of the large plots (one for rotation A and one for rotation D) during the period 1957 to 2008 only including the effects of soil water content and temperature (i.e.,rerWrT).
Can. J. Soil. Sci. Downloaded from pubs.aic.ca by University of Laval on 07/06/15
these three latter plots diverged from the overall mean values. The mean absolute deviation from measured values for the six large plots for rotation A was 6.9% and that for rotation D 7.5%. These overall predictions made with ICBM are within the range of commonly observed results with SOC models applied to data from long-term experiments (e.g., Bolinder et al. 2006).
The methodology used to estimate annual crop residue C inputs to soil performed reasonably well. Annual C inputs to soil were only under-estimated by 4% (data not shown) when optimizing the annual C inputs to soil from the undersown barley and forage crops for rotation A [i.e., by multiplying the total annual crop residue C inputs to soil (i) by a constant in order to force the ICBM predicted value to match the measured value for each plot]. This exercise of course implies that the reference values for the other four parameters remained unchanged. The objective of this study was to examine the performance used to estimate the i parameter for rotation A in such a scenario.
The data used to derive the relative plant C allocation coefficients for forage crops and undersown barley used in this study originated from a review of field measure-ments of shoot and root C allocation. Most of the field studies that were reviewed considered mainly the 0-to 18-cm, 0- to 20-cm or 0- to 30-cm depths [see Bolinder et al. (2007a) for more details]. Only a limited number of data considered a deeper sampling depth such as 060
or 090 cm (i.e., less than 10% of the data). About 20% of the data included 45-cm depth, but it was found that the root biomass measured in the deepest sampling layer (i.e., 3045 cm) represented only 10% of the total root biomass. Therefore, we considered that the estimate of BG C input with this methodology was representative for the 0- to 25-cm depth, which was the sampling depth used to estimate the SOC stocks in this study.
We also predicted final SOC stocks considering the equivalent soil mass concept for each of the plots. This concept applied on SOC stock dynamics accounts for changes in soil bulk density due, for example, to tillage and manure applications. Although the application of manure resulted in lower bulk density for rotation A, in this study this effect was not crucial and the equivalent soil depth was on average 26.5 cm (Bolinder et al. 2010). Values for each plot ranged from 25.1 to 28 cm (data not shown) and this has a fairly small effect on the predicted SOC stocks and the optimizediparameter. The effect of using equivalent soil depth for rotation D was also small (i.e., equivalent depth was 23 cm).
For rotation D, the annual C inputs to soil for the undersown barley and green manure (i.e., the forage crop grown as green manure) followed the Bolinder et al. (2007a) methodology, and as discussed above gave reasonable estimations. For the 2 yr of root crops in that rotation we used a fixed estimate for BG C inputs. If we consider that annual C inputs to soil for the other two crops in that 6-yr rotation (i.e., winter rye and peas) were well estimated and using the default parameter settings for ICBM, then we can have a ‘‘rough estimate’’ for the cultivation factor (rC). This resulted in a mean optimized rC value of 1.21, indicating that cultivation would have accelerated the decomposition by 21% in rotation D (Table 4). This assumes that the constant obtained in the optimization accounts for the effect of tillage that occurred in the last 5 yr of that 6-yr rotation (i.e., 5 yr of annual crops as compared with the continuous forage rotation A). In previous ICBM applications, the relative difference in decomposition rates between an annual crop or a root crop versus a perennial forage crop has used guestimates for rC of 10 and 30%, respectively (Andre´n et al. 2004; Ka¨tterer et al. 2008). Of course, the additional effect attributed to Table 4. Measured and ICBM predicted final soil organic carbon (SOC) stocks in 2008 for the Offer site for each of the six large plots of rotation A and D (kg C m2). The values for the annual crop residue C inputs to soil (i) and the soil climate/management factor (r
e) are annual averages for the time period 1957 to 2008. The scaling factor for cultivation (rC) was optimized for each plot
Plot no. rotation A
1 2 3 4 5 6 Mean
Measured 10.1 8.8 8.6 7.4 8.6 9.0 8.8
ICBMz 8.5 8.7 8.8 8.5 8.4 8.6 8.6
i 0.277 0.268 0.304 0.271 0.269 0.290 0.280
re 0.88 0.88 0.87 0.88 0.88 0.87 0.88
Plot no. rotation D
1 2 3 4 5 6 Mean
Measured 7.2 6.8 6.3 7.6 6.7 6.9 6.9
ICBMz 7.3 7.5 7.6 7.5 7.2 7.1 7.4
i 0.259 0.291 0.296 0.288 0.265 0.256 0.276
re 0.93 0.92 0.92 0.91 0.92 0.92 0.92
Optimizedyr
C 1.05 1.30 1.57 0.95 1.27 1.10 1.21
zFinal SOC stocks with ICBM were predicted using the annual C inputs to soil and climate-factor estimated for each plot between 1957 to 2008 (see
the text for details).
yThe optimized values represent the estimated constant used to multiply ther
Cparameter in order to force the ICBM predicted value to match the
measured value for each plot.
Can. J. Soil. Sci. Downloaded from pubs.aic.ca by University of Laval on 07/06/15
rCcould well be assigned to the other components of the ICBM approach (e.g., decay rates, SOC pool sizes, etc.). For instance, in another study on SOC dynamics in a long-term Swedish field experiment, Ka¨tterer et al. (2011) found that root-derived C likely contributes about two times more to relatively stable soil C pools (h twice as high) than the same amount of AG crop residues. That study comprised more detailed data records for soil C changes and was dominated by spring cereals. However, if we apply these findings to the current study, by calculating a weighted average of hY for the above- and below-ground crop residues for rotation A and D, then the simulated relative differences between the treatments decreases. With these assump-tions, the effect attributed to rC would decrease from 21% to about 10% since the below-ground C input was relatively higher in A than in rotation D.
Furthermore, it is difficult to use data from long-term field experiments to examine the effect of manage-ment and land use change on SOC dynamics, since they were often not designed for that purpose. This implies that it is rather problematic to define ‘‘clear-cut’’ effects and there are several non-trivial potential error sources. However, they constitute one of the best sources we have to generate hypotheses and bring models into line. In experiments like this, the effects of tillage and crop types in the different rotations are unavoidably confounded. The initial plant communities of the experimental site they replace may also be a problem (DuPont et al. 2010). However, this latter aspect may have been less of a problem in this study because the management of Offer prior to initiation involved similar cropping systems used in the four rotations, i.e., forages and annual crops such as small-grain cereals (Bolinder et al. 2010).
It is recognized that management-induced changes on SOC stocks are limited to the approximate depth of the plow layer (020 or 030 cm) in most agricultural soils
(IPCC 2006). Furthermore, the SOC stock changes for grasses appear to decrease with greater depths, reaching a modest level beyond the 30-cm depth (Liebig et al. 2010). However, there is a considerable gap in the under-standing of SOC dynamics in the whole soil profile, and modeling of SOC dynamics from this perspective should be improved (e.g., Ga¨rdena¨s et al. 2011).
CONCLUSIONS
The use of the continuous forage rotation (A) to validate the Bolinder et al. (2007a) methodology for estimating annual C inputs to soil for forage crops was relatively straightforward, and it was shown that it worked fairly well when used within the ICBM concept. The analysis of recent and historical root biomass measurements for forages that is the basis for estimating the below ground C inputs to soil indicates that the estimates have remained relatively constant for at least the past 150 yr. The use of rotation D with respect to the approximate cultivation factor confirms that previous assumptions we have made are within a reasonable
range. These results improve our confidence in using the ICBM and other models to predict SOC balances for forage-based crop rotations in cool, temperate agricul-tural regions.
ACKNOWLEDGMENTS
This work was funded by the Swedish Farmer’s Foundation for Agricultural Research within the project ‘‘The impact of perennial leys in crop rotations on soil carbon balances’’. Additional financial support was also provided by the NSERC project CRDPJ-385199 on ecosystem services and collaborative potato farms. We acknowledge Lars Ericson and Kent Dryler who provided archived yield records. Thanks to Mireille Vigneault who kindly prepared illustrations for the conceptual Figure 1.
Andersson, S. and Wiklert, P. 1977. Studier av markprofiler i svenska a˚kerjordar. Del III. Norrbottens-, Va¨sterbottens-, Va¨sternorrlands och Ja¨mtlands la¨n. Swedish University of Agricultural Sciences, Department of Soil Sciences, Division of Agricultural Hydrotechnics. Report 104. [Online] Available: http://pub-epsilon.slu.se/1976/01/andersson_wiklert_ 090908.pdf.
Andre´n, O. and Ka¨tterer, T. 1997.ICBM the Introductory Carbon Balance Model for exploration of soil carbon balances. Ecol. Appl.7: 12261236.
Andre´n, O., Kihara, J., Bationo, A., Vanlauwe, B. and Ka¨tterer, T. 2007.Soil climate and decomposer activity in Sub-Saharan Afrika estimated from standard weather station data: A simple climate index for soil carbon balance calculations. Ambio36: 379386.
Andre´n, O., Ka¨tterer, T., Karlsson, T. and Eriksson, J. 2008. Soil C balances in Swedish agricultural soils 19902004, with preliminary projections. Nutr. Cycl. Agroecosyst. 81: 129144.
Andre´n, O., Ka¨tterer, T. and Karlssson, T. 2004. ICBM regional model for estimations of dynamics of agricultural soil carbon pools. Nutr. Cycl. Agroecosyst.70: 231239.
Andre´n, O., Lindberg, T., Bostro¨m, U., Clarholm, M., Hansson, A-C., Johansson, G., Lagerlo¨f, J., Paustian, K., Persson, J., Pettersson, R., Schnurer, J., Sohlenius, B. and Wivstad, M. 1989. Chapter 5. Organic carbon and nitrogen flows. In O. Andre´n, T. Lindberg, K. Paustian, and T. Rosswall, eds. Ecology of arable land organisms, carbon and nitrogen cycling. Ecol. Bull. (Copenhagen)40: 85125.
Barber, D. A. and Martin, J. K. 1976.The release of organic substances by cereal roots into soil. New. Phytol.76: 6980.
Be´langer, G. and Richards, J. E. 1995. Growth analysis of timothy cultivars differing in maturity. Can. J. Plant Sci.75: 643648.
Bolinder, M. A. 2004. Contribution aux connaissances de la dynamique du C dans les syste`mes sol-plante de l’est du Canada. [Contribution to the understanding of soil organic carbon dynamics for eastern Canadian agroecosystems.] Ph.D. thesis. Universite´ Laval, Ste-Foy, QC. 125 pp.
Bolinder, M. A., Janzen, H. H., Gregorich, E. G., Angers, D. A. and VandenBygaart, A. J. 2007a.An approach for estimating net primary productivity and annual carbon inputs to soil for common agricultural crops in Canada. Agric. Ecosyst. Environ.118: 2942.
Can. J. Soil. Sci. Downloaded from pubs.aic.ca by University of Laval on 07/06/15
Bolinder, M. A., Andre´n, O., Ka¨tterer, T., VandenBygaart, A. J., Gregorich, E. G., Angers, D. A. and Parent, L.-E. 2007b. Soil carbon dynamics in Canadian agricultural ecoregions: Quantifying climatic influence on soil biological activity. Agric. Ecosyst. Environ.122: 461470.
Bolinder, M. A., Andre´n, O., Ka¨tterer, T. and Parent, L.-E. 2008.Soil organic carbon sequestration potential for Canadian Agricultural Ecoregions calculated using the Introductory Carbon Balance Model. Can. J. Soil Sci.88: 451460.
Bolinder, M. A., Ka¨tterer, T., Andre´n, O., Ericson, L., Parent, L.-E. and Kirchmann, H. 2010.Long-term soil organic C and N dynamics in forage-based crop rotations in Northern Sweden (63648N). Agric. Ecosyst. Environ.138: 335342.
Bolinder, M. A., VandenBygaart, A. J., Gregorich, E. G., Angers, D. A. and Janzen, H. H. 2006.Modeling soil organic carbon stock change for estimating whole-farm greenhouse gas emissions. Can. J. Soil Sci.86: 419429.
Borgen, S. K., Grønlund, A., Andre´n, O., Ka¨tterer, T., Tveito, O. E., Bakken, L. and Paustian, K. 2012.CO2emissions from cropland in Norway estimated by IPCC default and Tier 2 methods. Greenhouse Gas Measurement Management1: 117. doi: 10.1080/20430779.2012.672306.
Bronick, C. J. and Lal, R. 2005.Soil structure and manage-ment: a review. Geoderma.124: 322.
Carter, M. R., Kunelius, H. T., Sanderson, J. B., Kimpinski, J., Platt, H. W. and Bolinder, M. A. 2003.Trends in productivity parameters and soil health under long-term two-year potato rotations. Soil Tillage Res. Special Issue72: 153168.
Chatskikh, D., Hansen, S., Olesen, J. E. and Petersen, B. M. 2009.A simplified modelling approach for quantifying tillage effects on soil carbon stocks. Eur. J. Soil Sci.60: 924934.
Chicago Climate Exchange. 2009.CCX offset project protocol: Agricultural best management practices Continuous con-servation tillage and conversion to grassland soil carbon sequestration.
Dahlman, R. C. and Kucera, C. L. 1965.Root productivity and turnover in native prairie. Ecology46: 8489.
DuPont, S. T., Culman, S. W., Ferris, H., Buckley, D. H. and Glover, J. D. 2010. No-tillage conversion of harvested perennial grassland to annual cropland reduces root biomass, decreases active carbon stocks, and impacts soil biota. Agric. Ecosyst. Environ.137: 2532.
Eagle, A. J., Henry, L. R., Olander, L. P., Haugen-Kozyra, K., Millar, N. and Robertson, G. P. 2010. Greenhouse gas mitigation potential of agricultural land management in the United States A synthesis of the literature. Nicholas Ins-titute for Environmental Policy Solutions, Duke University, Durham, NC.
Fortin, J. 2008.Mode´lisation des rendements de la pomme de terre par re´seau de neurons. Ph.D. thesis. Universite´ Laval, Ste-Foy, QC. 137 pp.
Fortin, J., Bolinder, M. A., Anctil, F., Ka¨tterer, T., Andre´n, O. and Parent, L.-E. 2011. Effects of climatic data low-pass filtering on the ICBM temperature- and moisture-based soil biological activity factors in a cool and humid climate. Ecol. Model.222: 30503060.
Ga¨rdena¨s, I. A., .A˚gren, G. I., Jeffrey, A. B., Clarholm, M.,
Hallin, S., Ineson, P., Ka¨tterer, T., Knicker, H., Nilsson, S. I., Na¨sholm, T., Ogle, S., Paustian, K., Persson, T. and Stendahl, J. 2011.Knowledge gaps in soil carbon and nitrogen interac-tionsFrom molecular to global scale. Soil. Biol. Biochem.43: 702717.
Gill, R. A. and Jackson, R. B. 2000.Global patterns of root turnover for terrestrial ecosystems. New. Phytol.147: 1331.
Goedewaagen, M. A. J. and Schuurman, J. J. 1950a. Wortel-productie op bouw- en grassland als bron van organische stof in de grond. [Root production on arable land and grassland as a source of soil organic matter]. Landbouwk, Tijdschr. Wageningen.62: 469482.
Goedewaagen, M. A. J. and Schuurman, J. J. 1950b. Root production by agricultural crops on arable land and on grassland as a source of organic matter in the soil. Trans. 4th Int. Congr. Soil Sci.2: 2830.
Intergovernmental Panel on Climate Change. 2000.Land use, land-use change, and forestry. Intergovernmental Panel on Climate Change: a special report of the IPCC, Cambridge, University Press, Cambridge, UK.
Intergovernmental Panel on Climate Change. 2006.2006 IPCC guidelines for national greenhouse gas inventories. Vol. 4. Agriculture, Forestry and Other Land Use. Institute for Global Environmental Strategies, Hayama, Japan.
Jensen, L. S., Mueller, T., Nielsen, N. E., Hansen, S., Crocker, G. J., Grace, P. R., Klir, J., Ko¨rschens, M. and Poulton, P. R. 1997.Simulating trends in soil organic carbon in long-term experiments using the soil-plant-atmosphere model DAISY. Geoderma81: 528.
Johansson, G. 1992. Below-ground carbon distribution in barley (Hordeum vulgare L.) with and without nitrogen fertilization. Plant Soil144: 9399.
Karlsson, T., Delin, S., Ka¨tterer, T., Berglund, K. and Andre´n, O. 2011. Simulating site-specific nitrogen mineralization dynamics in a Swedish arable field. Acta Agric. Scand. Sect. BSoil Plant Sci.61: 333344.
Ka¨tterer, T. and Andre´n, O. 2008. Predicting daily soil temperature profiles in arable soils in cold temperate regions from air temperature and leaf area index. Acta. Agr. Scand. 599: 7786.
Ka¨tterer, T. and Andre´n, O. 1999.Growth dynamics of reed canarygrass (Phalaris arundinacea L.) and its allocation of biomass and nitrogen below ground in a field receiving daily irrigation and fertilisation. Nutr. Cycl. Agroecosyst.54: 2129.
Ka¨tterer, T., Andersson, L., Andre´n, O. and Persson, J. 2008. Long-term impact of chronosequential land use change on soil carbon stocks on a Swedish farm. Nutr. Cycl. Agroecosyst.81: 145155.
Ka¨tterer, T., Andre´n, O. and Jansson, P.-E. 2006.Pedotransfer functions for estimating plant available water and bulk density in Swedish agricultural soils. Acta. Agric. Scand.56: 263276.
Ka¨tterer, T., Bolinder, M. A., Ande´n, O., Kirchmann, H. and Menichetti, L. 2011.Roots contribute more to refractory soil organic matter than above-ground crop residues, as revealed by a long-term field experiment. Agric. Ecosyst. Environ.141: 184192.
Ka¨tterer, T., Hansson, A.-C. and Andre´n, O. 1993.Wheat root biomass and nitrogen dynamicseffects of daily irrigation and fertilization. Plant Soil151: 2130.
Kononova, M. M. 1961.Soil organic matter: Its nature, its role in soil formation and in soil fertility. The Academy of Sciences of the USSR, the Dokuchaev Soil Institute. Pergamnon Press, New York, NY. 450 pp.
Kuzyakov, Y. and Domanski, G. 2000.Carbon input by plants into the soil. Review. J. Plant Nutr. Soil Sci.163: 421431.
Lal, R. 2004. Soil carbon sequestration impacts on global climate change and food security. Science304: 16231627.
Can. J. Soil. Sci. Downloaded from pubs.aic.ca by University of Laval on 07/06/15
Lal, R., Reicosky, D. C. and Hanson, J. D. 2007.Evolution of the plow over 10,000 years and the rationale for no-till farming. Soil. Tillage Res.93: 112.
Liebig, M. A., Gross, J. R., Kronberg, S. I., Philips, R. L. and Hanson, J. D. 2010.Grazing management contributions to net global warming potential: A long-term evaluation in the northern Great Plains. J. Environ. Qual.39: 799809.
Lokupitiya, E., Paustian, K., Easter, M., Williams, S., Andre´n, O. and Ka¨tterer, T. 2012. Carbon balance in US croplands during the last two decades of the 20th century. Biogeochem-istry107: 207225.
Manlay, R. J., Feller, C. and Swift, M. J. 2007. Historical evolution of soil organic matter concepts and their relation-ships with the fertility and sustainability of cropping systems. Agric. Ecosyst. Environ.119: 217233.
Paustian, K., Andre´n, O., Clarholm, M., Hansson, A.-C., Johansson, G., Lagerlo¨f, J., Lindberg, T., Pettersson, R. and Sohlenius, B. 1990. Carbon and nitrogen budgets of four agro-ecosystems with annual and perennial crops, with and without N fertilization. J. Appl. Ecol.27: 6084.
Paustian, K., Andre´n, O., Janzen, H. H., Lal, R., Smith, P., Tian, G., Tiessen, H., Van Noordwijk, M. and Woomer, P. L. 1997.Agricultural soils as a sink to mitigate CO2 emissions. Soil Use Manage.13: 230244.
Rasse, D. P., Rumpel, C. and Dignac, M.-F. 2005. Is soil carbon mostly root carbon? Mechanisms for a specific stabilization. Plant Soil269: 341356.
Sarton, G. 1959. A history of sciences: Ancient science through the golden age of Greece. Harvard University Press, Cambridge, MA.
Six, J., Bossuyt, H., Degryze, S. and Denef, K. 2004.A history of research on the link between (micro)aggregates, soil biota, and soil organic matter dynamics. Soil Tillage Res.79: 731.
Smith, P. 2004. Carbon sequestration in croplands: the potential in Europe and the global context. Eur. J. Agron. 20: 229236.
Smith, P., Powlson, D. S., Smith, J. U., Falloon, P. D. and Coleman, K. 2000.Meeting Europe’s climate change commit-ments: quantitative estimates of the potential for carbon mitigation by agriculture. Global Change Biol.6: 525539.
Sommer, R., Wall, P. C. and Govaerts, B. 2007.Model-based assessment of maize cropping under conventional and con-servation agriculture in highland Mexico. Soil Tillage Res.94: 83100.
Torstensson, G. 1938. Sko¨rdeintervallens och stubbho¨jdens inverkan pa˚ avkastning och rotutveckling hos gra¨s. En hos Svenska betes och vallfo¨reningen utfo¨rd fo¨rberedande under-so¨kning. [The effect of harvest intervals and stubble heights on the yield and root development in grasses. A preliminary investigation carried out by the Swedish Grassland Society.] Medd. Svenska Betes- o Vallfo¨ren. 5, No. 37. [English Translation. Imp. Bureau Pastures and Forage Crops. Mimeo-graphed Publications No. 2/1938].
Troughton, A. 1957. The underground organs of herbage grasses. Commonwealth Agricultural Bureaux, Central Sales, Farnham Royal, UK. Bulletin No. 44. 163 pp.
Troughton, A. 1962. The roots of temperate cereals (wheat, barley, oats and rye). Commonwealth Agricultural Bureaux, Central Sales, Farnham Royal, UK. Mimeographed Publica-tion No. 2. 91 pp.
VandenBygaart, A. J., Bremer, E., McConkey, B. G., Janzen, H. H., Angers, D. A., Carter, M. R., Drury, C. F., Lafond, G. P. and McKenzie, R. H. 2010.Soil organic carbon stocks on long-term agroecosystem experiments in Canada. Can. J. Soil Sci.90: 543550.
Wichern, F., Mayer, J., Joergensen, R. G. and Mu¨ller, T. 2007. Release of C and N from roots of peas and oats and their availability to soil microorganisms. Soil. Biol. Biochem. 39: 28292839.
Can. J. Soil. Sci. Downloaded from pubs.aic.ca by University of Laval on 07/06/15