Controls on Soil Carbon Dioxide
and Methane Fluxes in a Variety
of Taiga Forest Stands in
Interior Alaska
Jay Gulledge
1and Joshua P. Schimel
2*
1Institute for Earth and Ecosystem Sciences, Department of Ecology and Evolutionary Biology, Tulane University, New Orleans,
Louisiana 70118;2Department of Ecology, Evolution, and Marine Biology, University of California, Santa Barbara, California
93106, USA
A
BSTRACTCO2and CH4fluxes were monitored over 4 years in a range of taiga forests along the Tanana River in interior Alaska. Floodplain alder and white spruce sites and upland birch/aspen and white spruce sites were examined. Each site had control, fertilized, and sawdust amended plots; flux measurements began during the second treatment year. CO2 emis-sions decreased with successional age across the sites (alder, birch/aspen, and white spruce, in order of succession) regardless of landscape position. Al-though CO2fluxes showed an exponential relation-ship with soil temperature, the response of CO2 production to moisture fit an asymptotic model. Of the manipulations, only N fertilization had an effect on CO2 flux, decreasing flux in the floodplain sites but increasing it in the birch/aspen site. Landscape position was the best predictor of CH4flux. The two upland sites consumed CH4at similar rates
(approx-imately 0.5 mg C m22d21), whereas the floodplain sites had lower consumption rates (0 – 0.3 mg C m22 d21). N fertilization and sawdust both inhib-ited CH4 consumption in the upland birch/aspen and floodplain spruce sites but not in the upland spruce site. The biological processes driving CO2 fluxes were sensitive to temperature, moisture, and vegetation, whereas CH4 fluxes were sensitive pri-marily to landscape position and biogeochemical disturbances. Hence, climate change effects on C-gas flux in taiga forest soils will depend on the relationship between soil temperature and moisture and the concomitant changes in soil nutrient pools and cycles.
Key words: CO2 flux; CH4 consumption; taiga; climate.
I
NTRODUCTIONOver ecological time scales (years to centuries), at-mospheric CO2 concentrations are controlled pri-marily by the balance of biotic uptake and release of CO2 (Schimel and others 1995). The biota has the potential to affect global climate by controlling CO2 concentrations and may drive both positive feed-backs (through enhanced decomposition with
in-creased temperature) and negative feedbacks (through enhanced plant uptake with increased CO2; Shaver and others 1992). There are two com-ponents to C cycling that are important in terms of controlling CO2cycling: the rate of C turnover and the amount of C stored in an ecosystem. Over the short term, the fast C turnover in tropical systems may dominate changes in global C cycling (McGuire and others 1995). Ultimately, however, northern tundra and taiga (boreal forest and wet-land) ecosystems are likely to be more important in driving changes in atmospheric CO2 because of
Received 10 March 1998; accepted 29 December 1999.
*Corresponding author; e-mail:[email protected]
© 2000 Springer-Verlag
their large C pools (approximately 40% of global soil C; McGuire and others 1995). These large C stores are of particular concern as components of a positive climate feedback because warming is pre-dicted to be greatest in the north. The IPCC predicts a best estimate of global average warming of 2.5°C over the next century (Kattenberg and others 1996), whereas warming predictions for the boreal region average closer to 4°C (Moore 1996).
The taiga covers 12 million km2(Leith 1975) and contains roughly 18% of global soil C (McGuire and others 1995). It is a diverse biome, including a wide climatic range, from the cold, wet peatlands of Hud-son Bay to the warm, dry aspen forests of interior Alaska. Even within a single watershed, the taiga can encompass great variation; for example, young, closed-canopy, dry birch and aspen stands often occur adjacent to mature, wet, open-canopy black spruce muskeg underlain by permafrost. The vege-tation mosaic within a region is controlled by land-scape structure (for example, upland vs river flood-plain) and disturbance, particularly fire (upland) and fluvial dynamics (floodplain), which are the dominant factors in taiga ecology (Dyrness and oth-ers 1986). Much of the taiga experiences warm, dry, continental climates during the growing sea-son; water stress is a common constraint on tree growth in interior Alaska (Jacoby and D’Arrigo 1995).
Models generally predict that the future climate of the taiga will have warmer summers, but the predictions for precipitation and soil moisture vary (Kattenberg and others 1996). It therefore is not surprising that predictions for changes in boreal C dynamics also vary. For example, models of aboveground biomass in various taiga sites range from tripling in a world with twice as much CO2 (UKMO model for Northern Quebec; Smith and others 1992) to complete elimination (for example, UKMO and GFDL for Alaska; Smith and others 1992). Predictions of changes in soil organic matter range from243% to180% (Pastor and Post 1988). Because much of the variability in the models stems from soil moisture, any study that examines the C balance of taiga ecosystems should pay particular attention to soil moisture dynamics and the inter-actions of temperature and moisture to provide in-formation that will enhance modeling efforts.
Atmospheric CH4concentration also is controlled by feedbacks between the biota and the climate system. Methane has several roles in atmospheric chemistry and physics, particularly as a greenhouse gas (Schimel and others 1996). Unsaturated taiga soils are generally CH4 sinks (Whalen and others 1992), and the strength of the sink is affected by soil
moisture both through restricting CH4diffusion as well as regulating biological CH4consumption (Cas-tro and others 1994; Gulledge and Schimel 1998). Temperature, on the other hand, appears to be a less important control on CH4 consumption from the atmosphere (Whalen and Reeburgh 1996; Cas-tro and others 1994).
In this study, we (a) measured soil CO2and CH4 fluxes in a variety of Alaskan taiga forests, (b) eval-uated the relationships among soil temperature, moisture, and gas flux in the different sites, and (c) evaluated the effects of nitrogen manipulations on gas fluxes. N availability can affect both soil micro-bial and root respiration (So¨dersto¨m and others 1983; Hendricks and others 1993; Vance and Chapin 2000), both of which should be important components of total belowground respiration (Ruess and others 1996). Added NH4
1
also inhibits CH4 consumption in many ecosystems (Gulledge and others 1997).
We studied four taiga ecosystems at various times over a 4-year period. Three of the 4 years provided striking contrasts in weather patterns. By analyzing how CO2 and CH4 fluxes in the various sites re-sponded to changes in temperature and soil mois-ture across contrasting years, we were able to make predictions about how gas fluxes in taiga soils may respond to different climate change scenarios.
M
ATERIALS ANDM
ETHODS Study SitesWe studied four sites that are part of the Bonanza Creek Long Term Ecological Research (LTER) study, approximately 20 km southwest of Fairbanks, Alaska, USA (64°459N, 148°189W). Two sites (birch/aspen and white spruce) were in an upland, fire-dominated successional sequence, and the oth-ers (alder and white spruce) were in a floodplain succession along the Tanana River. The upland sites were on south-facing slopes at 400 – 450-m eleva-tion and are on well-drained soils with a silty, mi-caceous loess parent material. The floodplain sites experience episodic flooding, resulting in a layering of organic and mineral horizons. The floodplain alder site is the youngest (approximately 20 years) followed by upland birch/aspen (approximately 85 years), upland white spruce (approximately 220 years), and floodplain white spruce (approximately 250 years). The vegetation and successional devel-opment of these sites have been described else-where (Van Cleve and others 1991; Viereck and others 1993a).
sepa-rated into three main periods after snowmelt around the end of April (Yarie and others 1990; Viereck and others 1993b; US Weather Service data for Fairbanks). May is usually cool and dry (average air temperature of 9°C with 15 mm of rain). June and July are generally the hottest months of the year and are moderately dry (average temperature of 15–16°C with rainfall of 35– 45 mm per month). August and September are cooler and wetter (av-erage August temperature of 13°C and more than 50 mm of rain).
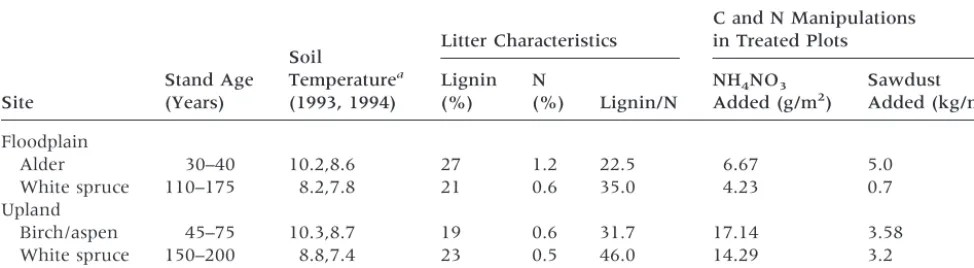
In each site, there is a set of long-term manipu-lation plots, including N fertilizer, sawdust, and, in the upland birch/aspen site, drought. The plots are 103 15 m in the alder and birch/aspen plots and 153 15 m in the white spruce plots. Fertilization levels were calculated to approximate the net an-nual mineralization, presumably doubling available N in the site. NH4NO3was applied by dry broadcast each June, beginning in 1990. Sawdust amendment was intended to adjust the C:N ratio of the forest floor to 50 and was applied once in 1989. To sim-ulate summer drought in the birch/aspen stand, a 10315–m rain shelter was set up each spring and taken down each fall beginning in 1990. Hence, the only precipitation this plot received was snowfall, which comprises approximately 35% of total an-nual precipitation (269 mm; Viereck and others 1993b). The sites and manipulations are described in Table 1 and in more detail by Yarie and Van Cleve (1996).
Rather than focusing on quantifying the gas fluxes across the taiga landscape, this study focused on characterizing the process controls on fluxes within specific sites. We felt it was important to examine a diversity of communities to understand the relationships between plant community, land-scape position, climatic parameters, and C-gas
fluxes. Hence, we chose to study one site in each ecosystem type intensively rather than attempting to replicate sites across the landscape. Although this approach does not stringently test the generality of our results for a given ecosystem type, previous work suggests that gas fluxes and their major eco-logical controls are generally consistent among sites with similar vegetation (Whalen and others 1991; Ruess and others 1996). Thus, although the site selection for this study may be considered to in-volve a case of “simple pseudoreplication” (Heffner and others 1996) for the purpose of estimating gas fluxes from different communities across the land-scape, we feel the approach is valid for evaluating the process controls in different taiga communities. The study ran from 1991 to 1994, but not all sites were sampled in all years. Measurements in the alder site were discontinued after 1992 because it had little CH4flux. Upland white spruce was added in 1993 to provide juxtaposition to the floodplain white spruce site, allowing plant community and landscape position to be compared as controls on C-gas flux. Measurements were discontinued in the floodplain white spruce after 1993 due to loss of personnel. All sites were examined for at least 2 years, and the floodplain spruce and upland birch/ aspen sites each were examined in 3 consecutive years.
Measurements
Flux Rates. Flux rates were measured using per-manently deployed static flux chambers similar to those of Whalen and Reeburgh (1988). Aluminum bases were placed in the forest floor by cutting them in several centimeters below the mineral soil sur-face to form a seal. The bases had a trough that was filled with water to make a seal with removable Plexiglas lids. The lids were fitted with rubber septa
Table 1. Characteristics of Study Sites and Manipulation Treatments
Site
Stand Age (Years)
Soil
Temperaturea
(1993, 1994)
Litter Characteristics
C and N Manipulations in Treated Plots
Lignin (%)
N
(%) Lignin/N
NH4NO3
Added (g/m2)
Sawdust Added (kg/m2)
Floodplain
Alder 30–40 10.2,8.6 27 1.2 22.5 6.67 5.0
White spruce 110–175 8.2,7.8 21 0.6 35.0 4.23 0.7 Upland
Birch/aspen 45–75 10.3,8.7 19 0.6 31.7 17.14 3.58 White spruce 150–200 8.8,7.4 23 0.5 46.0 14.29 3.2
for syringe sampling and were covered with alumi-num foil to make them opaque and eliminate CO2 fixation by plants in the chamber during measure-ments. Because feather mosses or Equisetum spp. often grew in the chambers, CO2 fluxes represent the sum of belowground respiration (root plus mi-crobial) and aboveground plant respiration. Three replicate chambers were placed randomly in the each of the control and treatment plots.
We measured gas fluxes approximately biweekly through the growing season (in 1992, we measured fluxes weekly in the birch/aspen site). The chamber headspace was sampled by syringe immediately af-ter sealing and at 15-minute inaf-tervals for 45 min-utes. Gas samples were taken with 10-mL glass syringes and stored in the sealed syringes for 1–3 days until analysis. Tests indicated no change in the concentrations of CO2or CH4during storage. Sam-ples were analyzed using a Shimadzu GC-14A gas chromatograph (Shimadzu Corp. Kyoto, Japan) with a stainless steel Porapak-N column (2 m, 3.2 mm outer diameter, 40°C) with thermal conductiv-ity (for CO2) and flame ionization (for CH4) detec-tors plumbed in series.
Ancillary Measurements. Starting in 1992, soil and air temperature and soil moisture measure-ments were made whenever flux measuremeasure-ments were taken. We measured soil temperatures at depths of 5 cm and 15 cm from the forest floor surface adjacent to each chamber and air tempera-ture in each site during chamber sampling. Forest floor moisture was determined from two fresh sam-ples taken adjacent to the control plot. These were returned to the lab and moisture content was de-termined by oven drying at 70°C overnight. We measured moisture on forest floor samples because this is where the highest concentrations of labile organic matter and fine roots are found, and thus where the bulk of activity should occur.
Calculations and Statistics. Flux rates from indi-vidual chambers were calculated using linear re-gression of concentration versus time. Slopes were typically linear (R2 . 0.9). Higher flux rates sometimes resulted in a decrease in the slope over time, in which case we excluded the last data point to approximate initial rates. Occasional anomalous measurements gave low concentrations, indicating syringe leakage, and were excluded. No fluxes were calculated from fewer than three points. Treatment effects on flux rates within sites were determined for each year and for all the years combined by two-way repeated measures analysis of variance (ANOVA) by using ranked data from a single year or all years combined. Data were ranked to
amelio-rate nonnormality and unequal variances (Conover and Iman 1981).
Effects of temperature and moisture across sites were analyzed by nonlinear regression in Systat for Windows 7.0 (SPSS Inc., Chicago, IL, USA). We modeled temperature as an exponential function (Davidson and others 1998).
Temperature-only model:flux5aebT
,
where T is soil temperature,ais the flux rate at 0°C, and b is a temperature response coefficient; both are estimated by the software. This model will be referred to as the T-O model. We tested the model by using temperature at both 5 cm and 15 cm. The 5-cm values consistently gave much higherR2 val-ues, which is consistent with the greatest activity occurring in the forest floor, and so all the analyses presented here use the 5-cm temperature.
To determine whether moisture had a significant effect on respiration rates, we compared the R2 values determined from the T-O analysis to those from models that incorporated moisture effects. We tested three different functional moisture re-sponses.
Linear model:flux5ae~bT!
p~3 zM!
Quadratic model:flux5ae~bT!2~
M2d!2
Asymptote model: flux5ae~bT!
p ~M/~M1ε!!.
In these models,a,b, and T are the same as in the T-O model, whereas M is soil moisture (g H2O/g dry soil), andx,d, andεare different moisture response constants. The quadratic model assumes an opti-mum moisture (represented byd) that allows max-imal activity. The asymptote model assumes that as moisture increases, respiration asymptotically ap-proaches some maximum rate (as allowed by other factors such as temperature), but that moisture does not directly alter the biota’s temperature sensitivity. The asymptote model shows a kinetic saturation response with increasing moisture, andεrepresents the moisture at which the respiration rate is half the maximum. Thus, a low value indicates a drought-adapted soil community. This model structure is comparable to the Monod model used to model resource limited microbial growth (Bottomley 1998).
gaveR2values only slightly lower than the asymp-tote model. However, less than 4% of the data points were above the estimated “optimum,” and these wet samples did not respire less than samples at the optimum moisture. Therefore, we judged it inappropriate to use a model that forced a decline in rates when there was no evidence for such a decline in the data. The asymptote model had neither of the problems encountered with the linear and qua-dratic models and gave the highestR2 values with-out requiring additional parameters. However, for several individual site/year combinations this model estimated ε values that were negative or greater than soil water holding capacity. In these cases, we ran the model with a minimum allowedε value of 0.1 and a maximum of 2.5 (these soils have a water holding capacity of roughly 5 g H2O/g soil, so 2.5 is a realistic estimate for the maximum pos-sible half-saturation constant). Using these limits gave overall fits that were not significantly different (at a 5 0.05) from the original estimates and did not substantially alterbestimates. For CH4 fluxes, we modeled moisture by using a linear function because the main effect of moisture in these sys-tems is to affect diffusion, in which case a linear function is the most reasonable because moisture contents never approached saturation.
Values of Q10(relative increase in flux rate for a 10°C increase in temperature) for soil respiration were calculated from the temperature response as:
Q105e10b
usingbvalues from the asymptote model. The error range on Q10estimates was determined by recalcu-lating the Q10withb 11 standard error (SE) and b 21 SE, in which SEs of the parameter estimate were provided by Systat. For estimating Q10within individual years, we used the asymptote model to minimize interference from variations in moisture.
R
ESULTSFloodplain Alder
CO2Fluxes. The alder site had high CO2 fluxes, averaging 3.44 (60.37) g CO2-C m
22
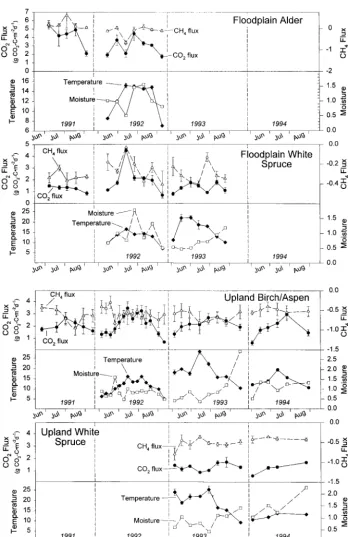
d21across the 2 years the site was sampled. There was a seasonal pattern, with low rates early and late in the season (Figure 1). This seasonality was associated with strong correlations of CO2flux with both tempera-ture and moistempera-ture. For example, the decrease in respiration in mid-July 1992 was associated with a dry period, whereas the very strong decrease in September was associated with dropping tempera-ture. The Q10determined by the asymptote model
from the 1992 data was 1.9 and the moisture half-saturation constant (ε) was 0.97 (Table 2). Adding the moisture effects in the asymptote model in-creased the overall model R2 from 0.25 to 0.51. Sawdust had no significant effect on CO2emissions in the alder site (Figure 2). N fertilization inhibited respiration by 37% over 1991 (P 5 0.045) but had no effect in 1992 (P 5 0.63).
CH4Fluxes. There was very little CH4flux in the alder site in either year of sampling (average 2-year flux rate 5 20.002 mg CH4-C m
22
d21). In 1991 there was occasional net CH4 production, but the rates were low (maximum of 0.6 mg CH4-C m22d21), compared with those seen in wetlands. In 1992, there were relatively consistent, but low rates of CH4consumption, except on July 14, 1992 when flux was20.67 mg CH4-C m
22
d21; this was com-parable to rates commonly seen in other sites. There was no significant seasonal pattern to CH4 fluxes, and no clear environmental control over them. Moisture showed a weak correlation with CH4 con-sumption in 1992 (R2 5 0.43, P 5 0.11). Saw-dust apparently prevented CH4production in 1991 (Figure 2, P 5 0.05) but had no effect on CH4 fluxes in 1992. In 1992, when there was some consumption, it was inhibited by N fertilization (P 5 0.045).
Floodplain White Spruce
CO2Fluxes. The fluxes of CO2in the floodplain spruce site were relatively low, averaging 1.57 (60.19) g CO2-C m
22
d21 across all years of sam-pling. There was limited seasonality to CO2 fluxes (Figure 1). Very early and very late in the season, fluxes were generally low, but during the rest of the year there was little clear variation. The exception was the extremely high flux measured on July 14, 1992 (4.5 g CO2-C m
22
d21), which was associated with a soil temperature of 17°C, the hottest re-corded that year.
Across years, both temperature and moisture in-fluenced respiration (Table 2). In 1992, there was a strong response of CO2 flux to soil temperature, with an estimated Q10of 11.7 (range 6.3–24;R
2
5 0.82), but no apparent moisture response. In 1993, there was a much weaker temperature response (Q1051.65; R
2
inhi-bitions of 24% and 21%,P 5 0.016 and 0.048, respectively). These effects were not observed in 1992.
CH4Fluxes. The floodplain spruce consistently
consumed CH4, with an average consumption rate of 0.29 (60.02) mg CH4-C m
22
d21 (Figure 1). Flux rates were consistent across time both within and between years, with the exception of
two dates that gave particularly low fluxes (July 14, 1992 when soil temperature was unusually high, and July 27, 1993). We did not observe any significant correlations with either soil moisture or soil temperature. Both N fertilization and saw-dust caused significant inhibition of CH4 flux (61% and 68% inhibition, respectively; P , 0.001 for both; Figure 2).
Upland Birch/Aspen
CO2Fluxes. CO2fluxes averaged 2.07 (60.12) g CO2-C m
22
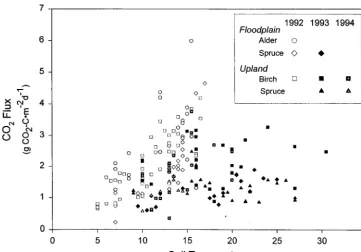
d21 over the 4 years sampled and showed a strong seasonal cycle, with the highest rates in midseason (Figure 1). Across all years, the overall temperature response had a Q10of only 1.45 (R2 5 0.23) and a moisture half-saturation con-stant (ε) of 0.37 g H2O/g dry soil. The low overall Q10, however, masked strong variation among years. Both 1992 and 1994 respiration showed strong responses to temperature (Figure 3), with a Q10in 1992 of 2.9 (R
2
5 0.66) and in 1994 of 2.0 (R2 5 0.38). In 1993, however, there was only a very weak response to temperature (Q10 5 1.4; R2 5 0.19), and fluxes were lower than would be predicted based on other years. This is the same interannual pattern observed in the floodplain white spruce site described above. At the extreme, when soil temperature was 29°C, the CO2flux was roughly 20% of what would be predicted from the temperature response curves from 1992 and 1994.
There were some indications that N manipula-tions and drought affected CO2 flux. Over the 4 years of sampling, the mean respiration rate was 39% higher in the sawdust-amended plot than in the control plot (Figure 2). This difference was not statistically significant overall (P . 0.1), but it was significant in 1992 (P 5 0.01) and 1993 (P 5 0.02) and borderline in 1991 (P 5 0.12) and 1994 (P 5 0.11). Overall, fertilization signifi-cantly increased CO2flux by 13% (P 5 0.04), but all the increase occurred during 1991 and the first half of 1992 (through July), during which period flux rates were 30% higher in the fertilized plot than in the control (significant atP , 0.01). After that, average flux in the fertilized plot was 98% of the control flux. In the drought treatment, the mean rate was 38% lower than in the control, but the decrease could not be demonstrated statistically (P . 0.1).
CH4 Fluxes. Methane consumption averaged
0.58 mg (60.03) CH4-C m 22
d21over the 4 years of Figure 2. Averages of CO2 (a) and CH4(b) flux rates across all 4 years in the con-trol and treatment plots. Table 2. Model Results from the Temperature-Only and Asymptote Models for Each Site
Site
Temperature-only model Asymptote model
b(Q10) R
2 a b(Q
10) ε R
2
Floodplain
Alder (1992 only) 0.063 (1.9) 0.25 1.21 0.062 (1.9) 0.97 0.51
White spruce (1992–93) 0.026 (1.3) 0.07 0.67 0.047 (1.6) 1.0 0.25
Upland
Birch/aspen (1992–94) 0.024 (1.3) 0.12 1.13 0.037 (1.5) 0.37 0.23
White spruce (1993–94) 20.002 (0.98) ,0.01 0.7 0.036 (1.4) 1.2 0.18
sampling (Figure 1). In 1992, there was a weak positive correlation with moisture (R2 5 0.23, P 5 0.08). In 1993, there was a negative correla-tion with moisture for much of the season, though this was not statistically significant overall (P . 0.1). In 1994, there was no correlation between CH4 consumption and moisture. Thus, there was little correlation between CH4 flux and moisture overall. No correlation between CH4 consumption and soil temperature was observed (R2 5 0.14, P 5 0.19). Over the duration of the study, fertil-ization, sawdust, and drought significantly inhib-ited CH4 consumption by 64%, 59%, and 48%, respectively (P , 0.05; Figure 2).
Upland White Spruce
CO2 Fluxes. Average CO2 fluxes were lower in this site than in the other three sites (1.3160.08 g CO2-C m
22
d21; Figure 1) but were most similar to fluxes in the floodplain white spruce site. Using the data from both years of sampling, we found that Q10was 1.4, and the moisture half-saturation con-stant (ε) was 1.2, although the overall R2 of the model was only 0.18 (Table 2). In 1993, there was a weak temperature response of Q1051.1 (R
2
5 0.07; Figure 3). In 1994, there was a strong positive response (Q105 3.4; range 1.2–9.0; R
2
5 0.82). There was no discernible relationship between CO2 flux and soil moisture in 1993, whereas in 1994, incorporating moisture improved the model R2 from 0.49 for the T-O model to 0.82 in the
asymp-tote model. There were no significant treatment effects on CO2 fluxes. There appeared to be some enhancement by fertilization in the first half of 1993 (30% increase, P 5 0.08), paralleling the enhancement of CO2flux in the first year and a half of measurements in the birch/aspen stand.
CH4Fluxes. The average CH4 consumption rate in this site was 0.50 (60.03) mg CH4-C m22d21 (Figure 1). This was slightly lower than the upland birch/aspen site (P 5 0.02) and substantially higher than the floodplain white spruce site (P , 0.001; Figure 2). There was no seasonal pattern to CH4 fluxes (Figure 1), and there were no correla-tions with soil moisture or temperature. There were no overall significant effects of either fertilizer or sawdust (Figure 2). Sawdust did, however, signifi-cantly enhance CH4consumption by 41% in 1993 (P 5 0.002), particularly late in the season (data not shown).
D
ISCUSSION Climatic PatternsOf the years we studied, 1992 was the closest to the 30-year average summer climate for the Fairbanks area with an average monthly air temperature 1.0°C higher than the long-term average and 0.11 cm/month less rain than average. The rest of 1992, however, was unusual, with an exceptionally late spring (snow in mid-May) and a very early winter
(snow in mid-September). The following year (1993) was hot and dry with summer temperatures 1.4°C above the long-term average and with 0.85 cm/month less rain. 1994 was intermediate, with a dry, hot period in mid-summer and cool, moist periods early and late in the season. Average tem-perature was 1.2°C above normal, whereas rainfall was 0.17 cm/month below average. The soil tem-perature (5-cm depth) and moisture values, as well as CO2 and CH4 fluxes from the control plots are shown in Figure 1.
By analyzing processes across this range of cli-matic conditions, it is possible to evaluate the effects of climate on process dynamics and predict likely effects of climate change on those processes (Whalen and Reeburgh 1988). Historically, there has been an inverse correlation between air tem-perature and rainfall in interior Alaska. If this pat-tern holds into a warmer future, then we would expect that the interior of Alaska would become warmer and drier, as predicted by Manabe and others (1992). Under this scenario, 1993 would likely provide a good model for future gas flux dynamics in interior Alaska. If, however, the cli-mate becomes warmer and wetter, as predicted by other general circulation models (Kattenberg and others 1996; Gordon and O’Farrell 1997), 1993 would be a poor model. Under this scenario, we would need to extrapolate based on the results from 1992 and 1994 when soils were moister.
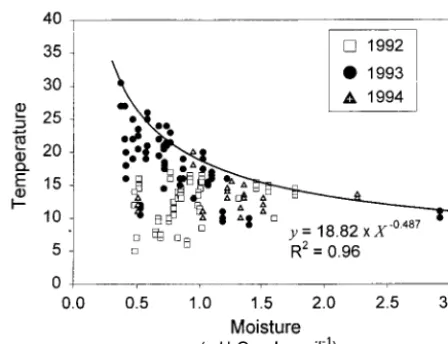
Although there was no overall correlation be-tween soil temperature and moisture across all sites and years (R2 5 0.07; Figure 4), soil temperature appeared to be constrained by soil moisture, such
that soil could only be very warm if it was very dry. The curve in Figure 4 describes the upper boundary of the soil moisture–temperature data cloud. Any value below the boundary is possible (for example, soils can be cold and wet at snowmelt, or cold and dry in the fall), but there may be climatological and physical constraints that make this line the limit of soil temperature at any given soil moisture. The limit on surface (5-cm depth) soil temperature is determined primarily by the temperature of rain-water and evaporative heat loss. Summer rain in interior Alaska is cool, and consequently soils are cool after a rainfall. When the weather gets hot and dry, latent heat loss limits how hot the soils can get. As long as soils are moist, evaporation can be rapid, cooling the soil. As soils dry, evaporation slows and more energy goes into heating the soil. The bound-ary on the soil moisture–temperature relationship is determined by soil texture and soil water content– water potential relationships (Hillel 1980). A fine-textured soil potentially could reach a higher tem-perature at a given water content than a coarse-textured soil; at a given water content, the fine textured soil has a lower water potential and so requires more energy to evaporate water. Given the uniform texture of the soils in this study, it is not surprising to see a uniform relationship across the sites. One question is whether the boundary on the soil moisture–temperature graph would change if the Alaskan climate warmed. If a warmer climate entailed hotter or longer sunny periods alternating with cool rainy periods, then the curve would be unchanged. Soils would merely spend more time at the hot, dry end of the graph. The boundary would only change if warming occurred during the wet periods. In this case, the right limb of the curve would rise to reflect higher rainwater temperatures. In dry periods, however, the thermodynamic prop-erties of the soil should prevail, and the boundary on the left limb of the curve likely would not change. Thus, we believe that this boundary on the relationship between soil temperature and moisture would remain similar to that in Figure 4 under the likely climate change scenarios forecast for interior Alaska. Hence, this relationship may be useful for incorporating temperature–moisture relationships into ecosystem models of soil CO2flux.
Comparison of Sites and Environmental Control of Flux Rates
Assuming a 135-day growing season, we would estimate growing season CO2 fluxes of 464, 212, 279, and 177 g CO2-C m
22
y21for floodplain alder, floodplain spruce, upland birch/aspen, and upland spruce, respectively. Ruess and others (1996) mea-Figure 4. Soil temperature versus soil moisture across
sured soil respiration in these same sites (over dif-ferent years than our measurements) by collecting CO2 on soda lime in 24-hour biweekly measure-ments. Compared with their results, our flux esti-mates are lower for the white spruce sites, higher for the alder site, and similar for the birch/aspen stand. These differences may result from the inher-ent errors of the soda lime technique, which over-estimates fluxes below 2.4 g CO2-C m
22
d21 (slight-ly higher than our estimate for the birch/aspen site), and underestimates fluxes above that value (Jensen and others 1996).
CO2 flux was related to the successional age of the site, with the greatest fluxes in the early suc-cessional alder stand, intermediate in the midsuc-cessional birch/aspen stand, and lowest in the late successional white spruce stands (Figures 1 and 2). This pattern also is seen in thea values from the asymptote model (equal to the moisture-unlimited respiration rate at 0°C; Table 2), which are also highest for alder, intermediate for birch/aspen, and lowest for spruce. Interestingly, the CO2fluxes and their response to temperature in the two white spruce sites were similar, suggesting a unity of con-trol over CO2fluxes between the sites: that is, the composition of the plant community was a more important control on CO2 flux than the landscape position.
The pattern of decreasing CO2 flux from alder and birch/aspen to white spruce parallels the mois-ture-unlimited temperature sensitivity of flux. Our estimates of the moisture-unlimited Q10was lowest for alder (1.9), moderate for birch/aspen (2.8), and highest for the white spruce sites (3.4 –12). We evaluated this using the wettest year available for a site (1994 for upland spruce, 1992 for the other sites), because when moisture is colimiting, esti-mated Q10values are reduced (Davidson and others 1998). We saw this effect in two ways. First, adding moisture corrections in the models (that is, going from the T-O to the aymptote model) increased estimated Q10values. Second, Q10values were al-ways higher in wet years than dry, even in the asymptote model that tried to account for moisture effects.
The reasons for these trends across sites are unclear and hard to decipher from our results. Not only is CO2 flux a combined result of root respiration, rhizosphere respiration, litter and root decomposition, and soil organic matter turnover, but a number of possible controlling factors covary with CO2fluxes. For exam-ple, temperature, aboveground production, litterfall, litter quality, and forest floor turnover rate all vary in parallel along the alder to spruce gradient (Table 1;
Flanagan and Van Cleve 1983; Ruess and others 1996).
One important factor that may drive differences in CO2 flux along the successional gradient is the contribution of roots to total soil respiration. Root1 rhizosphere respiration appears to be more temper-ature sensitive than bulk soil microbial respiration (Boone and others 1998), and thus the greater the fraction of respiration from roots, the greater the Q10is likely to be (Boone and others 1998). How-ever, a large root contribution seems unlikely to explain the high Q10 values in the spruce stands. First, root biomass and production are lower in the white spruce stands than either the alder or the birch/aspen stands (Ruess and others 1996). Sec-ond, if you assume steady state conditions, then root production should equal root 1 rhizosphere respiration as analyzed by Boone and others (1998), and litterfall should equal bulk soil respira-tion. Given those assumptions, then the higher the ratio of root production to litterfall, the higher the overall Q10for CO2 flux should be. However, the ratio of fine root production to litterfall was actually higher in upland birch than upland spruce (Ruess and others 1996), which is the opposite pattern than that observed for Q10. Thus, the high Q10 values in spruce may be more reflective of microbial respiration, perhaps following the pattern that colder soils exhibit higher Q10values for microbial respiration than do warmer soils (Kirschbaum 1995). Alternatively, this would follow soil organic matter quality patterns. The temperature sensitivity of biochemical processes depends on the activation energy of the rate-limiting step, and it is likely that recalcitrant substrates have higher activation en-ergy for their decomposition. Thus, one might ex-pect greater temperature sensitivity of microbial respiration in soils with lower-quality soil organic matter.
about the differing temperature responses across sites or across years from our data alone.
Soil moisture was significant in controlling CO2 fluxes, though it rarely explained much of the vari-ation in respirvari-ation rates. The averageR2 (average of the across-year site-based values) for the T-O model was only 0.11, whereas adding moisture ef-fects in the asymptote model increased the average R2to 0.29. A general linear model (site as category, temperature, and moisture as covariates) also showed that temperature and moisture were signif-icantly correlated to CO2 flux (P , 0.001 for each). Most models of soil moisture effects on mi-crobial respiration assume a reduction as soils be-come saturated (Linn and Doran 1984). However, in semiarid areas, a saturation-kinetics response is common within the naturally occurring range of soil moisture (Parton and others 1987), as we ob-served in this study. The water-holding capacities of forest floor samples from these sites are in the range of 3–5 g H2O/g dry soil, and the optimum moistures estimated by the quadratic model were 1.5–1.9. Thus, these soils never approached saturation (Fig-ure 1). When analyzing individual sites and years, moisture effects on CO2 flux were not always ap-parent. For example, in the upland birch/aspen stand in 1992,R2values for the T-O and asymptote models were identical (0.67). This is easily ex-plained by a saturation-kinetics response: when soil moisture remains above the half-saturation value (ε), sufficient water is available, and variation in moisture becomes unimportant in affecting overall CO2 flux, whereas other factors, such as tempera-ture, explain the variation in CO2 fluxes. In the birch/aspen site in 1992, the lowest soil moisture recorded was 0.48 g H2O/g dry soil, which is still above the ε value for the birch/aspen site (0.37). The lowεvalue in the birch/aspen site suggests that it is relatively drought tolerant. In the other sites,ε values were close to 1 g H2O/g dry soil, suggesting that those sites may be less drought tolerant. CO2 emission rates during drought stress (soil tempera-ture at 5-cm depth.17°C; Figure 3) were substan-tially higher in the birch/aspen site than the others, also suggesting greater drought tolerance in this site.
The changing balance between temperature and moisture effects accounts for the different patterns of respiration between 1992, 1993, and 1994. Whereas moisture was always adequate in 1992, and CO2 production generally fit an exponential function on temperature, in 1993 drought limited CO2 flux and temperature explained very little of the variation in CO2 fluxes. In 1994, there were suggestions of both patterns. The hottest days were
dry, and the CO2fluxes were lower than would be predicted by the temperature response curves (Fig-ure 3). Interestingly, whereas exponential relation-ships between CO2flux and temperature often held for temperatures below 17°C (Figure 3), flux rates at soil temperatures greater than 17°C were low and showed no relationship to temperature. This shift likely results from the relationship between maximum soil temperature and soil moisture dis-cussed above. At a soil temperature of 17°C, the maximum soil moisture possible according to Fig-ure 4 is approximately 1.2 g H2O/g dry soil, which is very close to theε values for most of the sites. Given the Alaskan climate and the properties of the soils in our sites, it is difficult for them to reach 17°C without becoming moisture limited.
The parameters in Table 2 represent the best fits of our data to the asymptote model across a range of climatic conditions. However, these parameters are not likely to be accurate for any given year, because the temperature response parameters (b) are un-derestimated for conditions when moisture is not limiting. Thus, in modeling on a large scale, inte-grating across a wide range of temperature and moisture conditions, these parameters should pro-vide an adequate description of CO2flux dynamics. However, for modeling at a finer scale, a model that handles the shifting temperature response with moisture limitation may work better. Such a model may require more mechanistic detail on the various factors that actually drive CO2fluxes.
The timing of rainfall is critical for predicting CO2 fluxes under altered climate, yet rainfall patterns are handled poorly by climate models. If a warmer climate scenario resembled 1993, with a hot dry early summer, then total soil CO2 flux would be relatively small and would be much lower than would be predicted based on temperature response curves derived from cooler, moister years, such as 1992 and 1994. These conditions also could lead to stand replacement through increased fire or tree death from drought or insect attack, further chang-ing biogeochemical relationships. If increased rain-fall occurred in June and July, however, CO2 flux would respond strongly to the elevated tempera-ture; the high CO2 fluxes of mid-July 1992 would then be an indication of the likely fluxes. Assuming a Q10 response, total CO2 release from taiga soils under a 3°C warming would increase by 20%–25% in the midsuccessional stands and as much as 100% in the white spruce stands.
CO2Fluxes–Treatment Effects
ap-parently in all years. There are several possible mechanisms for N inhibition of CO2 flux like this. First, when whole root systems are fertilized, some plants reduce their belowground C allocation (Gower and Vitousek 1989; Gower and others 1992; Reynolds and D’Antonio 1996). This would reduce both root and rhizosphere microbial respi-ration. Lignolytic activity in a number of fungi (though not all) is inhibited by high concentrations of NH4
1
(Kaal and others 1993), and reducing lig-nin degradation would reduce CO2fluxes from de-composers. Additionally, condensation of N-rich compounds with phenolics can make soil organic matter more recalcitrant, also reducing microbial respiration (Haider and others 1975). Finally, addi-tion of NH4
1
salts can inhibit microbial activity (Gulledge and others 1997). Which mechanism(s) accounts for the respiration reduction is unclear. Interestingly, neither upland site showed any evi-dence of respiration inhibition by N additions; rather, there were indications of the opposite. It is unclear why the upland and floodplain sites showed different responses to N additions. It may have to do with the interactions with other re-sources, such as water or P. Sawdust had no overall significant effects on CO2fluxes. Although sawdust is a potential C source to soil microorganisms, its substrate quality may be too low for it to have a large impact on respiration rates.
Methane Fluxes
In general, CH4consumption showed little response to climatic factors. With rare exception, fluxes var-ied within a narrow range in a given site, and there was no consistent correlation with either tempera-ture or moistempera-ture. Considering that CH4 consump-tion is controlled largely by CH4 diffusion into the soil (Do¨rr and others 1993; Schimel and others 1993; Striegl 1993), one might expect a relationship with moisture. The lack of such a relationship likely results from the fact that these soils occur in a semiarid climate and are rarely saturated, and that the CH4oxidizers in these soils are relatively insen-sitive to drought (Gulledge and Schimel 1998).
The CH4consumption rates were associated with landscape position, with higher rates in upland sites than in floodplain sites. Alder, with the lowest ele-vation, was the only site that emitted CH4 to the atmosphere, and only once in 2 years did it exhibit substantial CH4consumption. The floodplain white spruce, which is on a higher river terrace than the alder stand, consumed CH4 consistently but at a lower rate than either of the upland sites. This difference between upland and wetland may have resulted from differences in soil moisture. Although
we did not detect significant differences in forest floor moisture, moisture in the underlying mineral soil may be more important for controlling CH4 consumption rates because the zone of maximum activity lies 10 –20 cm deep in the mineral horizons (Gulledge and others 1997). In 1996, Billings and others (1998) observed significantly more moisture in the mineral soil of the floodplain spruce site than in the upland birch/aspen site. Thus, elevated mois-ture in the floodplain soils may restrict diffusion of CH4 into the soil and cause lower rates of atmo-spheric CH4consumption.
Methane consumption showed no consistent re-sponses to any of the manipulation treatments across sites. Nitrogen fertilization inhibited CH4 consumption in the upland birch/aspen and flood-plain spruce sites, but not in the upland white spruce site (Figure 2). Differing effects of N fertili-zation across sites are commonly observed but poorly understood. Gulledge and others (1997) and Gulledge and Schimel (1998) showed that the at-mospheric CH4oxidizers in the upland birch/aspen and spruce sites exhibit distinct physiological re-sponses to NH4
1
fertilization, CH4supply, elevated salt concentrations, and water stress. They con-cluded that the different responses of atmospheric CH4 consumption to NH4
1
fertilization resulted from the presence of physiologically distinct CH4 oxidizers in the two soils. The distribution of these populations does not appear to be related strictly to landscape position because one upland site and one floodplain site showed inhibition. It also did not seem related to plant community because the two spruce sites are similar in plant community compo-sition, climate, and CO2 fluxes, but only one of them showed inhibition of CH4consumption. Being able to predict which sites will show N inhibition is important if we are to model the large-scale effects of N cycling on CH4 consumption.
Sawdust strongly inhibited CH4 consumption in the birch/aspen and floodplain spruce sites. These are the same sites that were inhibited by N fertili-zation, suggesting that the mechanism of inhibition by sawdust also may be linked to the microbial population differences among sites. The specific mechanism, however, remains unclear.
C
ONCLUSIONSrespond to root respiration, substrate quality, and nutrient availability, whereas net CH4consumption is driven by soil diffusion characteristics and phys-iological and population-level changes in a small set of soil microorganisms representing a narrow range of physiologies (Schimel 1995; Schimel and Gulledge 1998). The flux of CO2showed an expo-nential response to temperature, with differing Q10 values among sites, but the moisture response was best estimated by a saturation response. Thus, when soil moisture remained above about 0.5–1 g H2O/g soil (depending on the site), variations in soil mois-ture did not appear to influence respiration. This work allows us to draw several conclusions about the effects of climate change on CH4 and CO2 fluxes. First, CH4consumption rates in the taiga are unlikely to change substantially with climate change because CH4 flux was insensitive to the climatic variation we observed. CO2 fluxes, how-ever, are likely to respond strongly, though in dif-ferent directions, depending on how climate change occurs. A warmer, wetter climate could cause CO2 fluxes from the taiga soil to increase substantially from current levels. If past climatic relationships hold, however, the taiga will become warmer and drier, in which case soil CO2 fluxes are likely to become uncoupled from temperature and decline due to drought stress.
A C K N O W L E D G M E N T S
We gratefully acknowledge Allen Doyle, Joy Clein, and Vicki Merchlewitz for help with field sampling and lab work. The project was supported by grants from the Athens Environmental Research Lab of the US Environmental Protection Agency and the National Science Foundation Long Term Ecological Research program.
R E F E R E N C E S
Billings SA, Richter DD, Yarie J (1998) Soil carbon dioxide fluxes and profile concentrations in two boreal forests. Can J For Res 28:1773–1783
Boone RD, Nadelhoffer KJ, Canary JD, Kaye JP (1998) Roots exert a strong influence on the temperature sensitivity of soil respiration. Nature 396:570 –572
Bottomley PJ (1998) Microbial ecology. In: Sylvia DM, Fuhr-mann JJ, Hartel PG, Zuberer DA, editors. Principles and appli-cations of soil microbiology. Upper Saddle River, NJ: Prentice Hall. p 149 –167
Castro MS, Melillo JM, Steudler PA, Chapman JW (1994) Soil moisture as a predictor of methane uptake by temperate forest soil, Can J For Res 24:1805–1810
Conover WJ, Iman RL (1981) Rank transformations as a bridge between parametric and nonparametric statistics. Am Stat 35: 124 –129
Davidson EA, Belk E, Boone RD (1998) Soil water content and
temperature as independent or confounded factors controlling soil respiration in a temperate mixed hardwood forest. Global Change Biol 4:217–227
Do¨rr H, Katruff L, Levin I (1993) Soil texture parameterization of the methane uptake in aerated soils. Chemosphere 26:697– 713
Dyrness CT, Viereck LA, Van Cleve K (1986) Fire in taiga com-munities of interior Alaska. In: K Van Cleve FS, Chapin PW III, Flanagan LA, Viereck, and Dyrness CT, editors. Forest ecosys-tems in the Alaskan Taiga. New York: Springer-Verlag, p 74 – 86.
Flanagan PW, Van Cleve K (1983) Nutrient cycling in relation to decomposition and organic-matter quality in taiga ecosystems. Can J For Res 13:795– 817
Gordon HB, O’Farrell SP (1997) Transient climate change in the CSIRO coupled model with dynamics sea ice. Monthly Weather Rev 125:875–907
Gower ST, Vitousek PM (1989) Effects of nutrient amendments on fine root biomass in a primary successional forest in Ha-waii. Oecologia 81:566 –568
Gower ST, Vogt KA, Grier CC (1992) Carbon dynamics of Rocky Mountain douglas-fir—influence of water and nutrient avail-ability. Ecol Monogr 62:43– 65
Gulledge J, Schimel JP (1998) Moisture control over
atmo-spheric CH4consumption and CO2production in physically
diverse soils. Soil Biol Biochem 30:1127–1132
Gulledge JM, Doyle AP, Schimel JP (1997) Different NH4
1
-Inhibition patterns of soil CH4consumption: a result of distinct
CH4oxidizer populations across sites? Soil Biol Biochem 29:
13–21
Haider K, Martin JP, Filip Z (1975) Humus biochemistry. In Paul EA, McLaren AD, editors. Soil biochemistry Volume 4. New York: Marcel Dekker Inc. p 195–244
Heffner RA, Butler MJ IV, Reilly CK (1996) Pseudoreplication revisisted. Ecology 77:2558 –2562
Hendricks JJ, Nadelhoffer KJ, Aber JD (1993) Assesing the role of fine roots in carbon and nutrient cycling. Trends in Ecol Evol 8:174 –178
Hillel D (1980) Fundamentals of soil physics. New York: Aca-demic Press
Jacoby GC, D’Arrigo RD (1995) Tree ring width and density evidence of climatic and potential forest change in alaska. Global Biogeochem Cycles 9:227–234
Jensen LS, Mueller T, Tate KR, Ross DJ, Magid J, Nielsen NE
(1996) Soil surface CO2flux as an index of soil respiration in
situ: a comparison of two chamber methods. Soil Biol Biochem 28:1297–1306
Kaal EEJ, de Jong E, Field JA (1993) Stimulation of lignolytic peroxidase activity by nitrogen nutrients in the white rot fungus Bjerkandera sp. strain BOS55. Appl Environ Microbiol 59:4031– 4036
Kattenberg A, Giorgi F, Grassl H, Meehl GA, Mitchell JFB, Stouffer RJ, Tokioka T, Weaver AJ, Wigley TML (1996) Cli-mate models—projections of future cliCli-mate. In Houghton JT, Meira Filho LG, Callander BA, Harris N, Kattenberg A, Maskell K, editors. Climate change 1995: the science of climate change. Cambridge, UK: Cambridge University Press, p 285– 357
Larcher W (1995) Physiological plant ecology. 3rd ed. Berlin: Springer-Verlag
Leith H (1975) Primary production of the major vegetation units of the world. In Leith H, Whittaker RH, editors. Primary pro-ductivity of the biosphere. New York: Springer-Verlag p 203– 215
Linn DM, Doran JW (1984) Effect of water-filled pore space on carbon dioxide and nitrous oxide production in tilled and nontilled soils. Soil Sci Soc Am J 48:1267–1272
Manabe S, Spelman MJ, Stouffer RJ (1992) Transient responses of a coupled ocean-atmosphere model to gradual changes of
atmospheric CO2: part II: seasonal response. J Clim 5:105–126
McGuire AD, Melillo JM, Kicklighter DW, Joyce LA (1995) Equilibrium responses of soil carbon to climate change: em-pirical and process-based estimates. J Biogeogr 22:785–796 Moore TR (1996) The carbon budget of boreal forests: reducing
the uncertainty. In: Breymeyer AI, Hall DO, Melillo JM, Ågren GI, editors. Global change: effects on coniferous forests and grasslands. Chichester, UK: John Wiley and Sons
Parton WJ, Schimel DS, Cole CV, Ojima DS (1987) Analysis of factors controlling soil organic matter levels in Great Plains grasslands. Soil Sci Soc Am J 51:1173–1179
Pastor J, Post WM (1988) Response of northern forests to CO2
-induced climate change. Nature 334:55–58
Reynolds HL, D’Antonio C (1996) The ecological significance of plasticity in root weight ratio in response to nitrogen: opinion. Plant Soil 185:75–97
Ruess RW, Van Cleve K, Yarie J, Viereck LA (1996) Contribu-tions of fine root production and turnover to the carbon and nitrogen cycling in taiga forests of the Alaskan interior. Can J For Res 26:1326 –1336
Schimel DS, Alves D, Enting I, Heimann M, Joos F, Raynaud D, Wigley T, Prather M, Derwent R, Ehhalt D, et al. (1996) Radiative forcing of climate change. In: Houghton JT, Meira Filho LG, Callander BA, Harris N, Kattenberg A, Maskell K, editors. Climate change 1995: the science of climate change. Cambridge, UK: Cambridge University Press. p 65–131 Schimel DS, Enting I, Heimann M, Wigley TML, Raynaud D,
Alves D, Siegenthaler U (1995) CO2and the carbon cycle. In:
Houghton JT, Meira Filho LG, Bruce J, Lee H, Callender BA, Haites E, Harriss N, Maskell K, editors. Climate change 1994: radiative forcing of climate change and an evaluation of the IPCC IS92 emission scenarios. Cambridge, UK: Cambridge University Press
Schimel JP (1995) Ecosystem consequences of microbial diver-sity and community structure. In: Chapin FS, Ko¨rner, editors. Arctic and Alpine Biodiversity. Berlin: Springer-Verlag. p 239 – 254
Schimel JP, Gulledge J (1998) Microbial community structure and global trace gases. Glob Change Biol 4:745–758
Schimel JP, Holland EA, Valentine D (1993) Controls on meth-ane flux from terrestrial systems. In Mosier AR, Duxbury J, Harper L, editors. Agroecosystem effects on radiatively active trace gasses and global climate change. Madison, WI: Ameri-can Society of Agronomy. p. 167–182
Shaver GR, Billings WD, Chapin FS III, Giblin AE, Nadelhoffer KJ, Oechel WC, Rastetter EB (1992) Global change and the carbon balance of Arctic ecosystems. BioScience 42:433– 441
Smith TM, Shugart HH, Bonan GB, Smith JB (1992) Modelling the potential response of vegetation to global climate change. Adv Ecol Res 21:93–116
So¨derstro¨m BE, Bååth E, Lundgren B (1983) Decrease in micro-bial activity and biomass owing to nitrogen amendment. Can J Microbiol 29:1500 –1506
Striegl RG (1993) Diffusional limits to the consumption of atmo-spheric methane by soils. Chemosphere 26:715–720 Van Cleve K, Chapin FS, Dyrness CT, Viereck LA (1991) Element
cycling in taiga forests—state-factor control. BioScience 41: 78 – 88
Vance ED, Chapin FS III (2000) Substrate-environment interac-tions: multiple limitations to microbial activity in taiga forest floors. Biogeochemistry. Forthcoming
Viereck LA, Dyrness CT, Foote MJ (1993a) An overview of the vegetation and soils of the floodplain ecosystems of the Tan-ana River, interior Alaska. Can J For Res 23:889 – 898
Viereck LA, Van Cleve K, Adams PC, Schlentner RE (1993b) Climate of the Tanana River floodplain near Fairbanks, Alaska. Can J For Res 23:899 –913
Whalen SC, Reeburgh WS (1996) Moisture and temperature
sensitivity of CH4oxidation in boreal soils. Soil Biol Biochem
28:1271–1281
Whalen SC, Reeburgh WS (1988. A methane flux time series for tundra environements. Glob Biogeochem Cycles 2:399 – 409 Whalen SC, Reeburgh WS. Kizer KS (1991) Methane
consumpi-ton and emission by taiga. Glob Biogeochem Cycles 5:261–273 Whalen SC, Reeburgh WS, Barber VA (1992) Oxidation of methane in boreal forest soils: a comparison of seven mea-sures. Biogeochemistry 16:181–211
Yarie J, Van Cleve K (1996) Effects of carbon, fertilizer, and drought on foliar chemistry of tree species in interior Alaska. Ecol Appl 6:815– 827