Transport of Carbon and Nitrogen
Between Litter and Soil Organic
Matter in a Northern Hardwood
Forest
Timothy J. Fahey,
1Joseph B. Yavitt,
1* Ruth E. Sherman,
1Peter M. Groffman,
2Melany C. Fisk,
3and John C. Maerz
41Department of Natural Resources, Cornell University, Ithaca, New York 14583, USA;2Cary Institute of Ecosystem Studies, Millbrook,
New York 12545, USA;3Department of Zoology, Miami University, Oxford, Ohio 45056, USA;4Warnell School of Forestry and Natural Resources, University of Georgia, Athens, Georgia 30602, USA
A
BSTRACTWe used sugar maple litter double-labeled with13C and15N to quantify fluxes of carbon (C) and nitro-gen (N) between litter and soil in a northern hard-wood forest and the retention of litter C and N in soil. Two cohorts of litter were compared, one in which the label was preferentially incorporated into non-structural tissue and the other structural tissue. Loss of 13C from this litter generally followed dry mass and total C loss whereas loss of15N (20–30% in 1 year) was accompanied by large increases of total N content of this decaying litter (26–32%). Enrich-ment of13C and15N was detected in soil down to 10– 15 cm depth. After 6 months of decay (November– May) 36–43% of the13C released from the litter was recovered in the soil, with no differences between
the structural and non-structural labeled litter. By October the percentage recovery of litter13C in soil was much lower (16%). The C released from litter and remaining in soil organic matter (SOM) after 1 year represented over 30 g C m-2y-1 of SOM accumulation. Recovery of litter 15N in soil was much higher than for C (over 90%) and in May15N was mostly in organic horizons whereas by October it was mostly in 0–10 cm mineral soil. A small pro-portion of this N was recovered as inorganic N (2– 6%). Recovery of 15N in microbial biomass was higher in May (13–15%) than in October (about 5%). The C:N ratio of the SOM and microbial bio-mass derived from the labeled litter was much higher for the structural than the non-structural litter and for the forest floor than mineral SOM, illustrating the interactive role of substrates and microbial activity in regulating the C:N stoichiom-etry of forest SOM formation. These results for a forest ecosystem long exposed to chronically high atmospheric N deposition (ca. 10 kg N ha-1y-1) suggest possible mechanisms of N retention in soil: increased organic N leaching from fresh litter and reduced fungal transport of N from soil to decaying litter may promote N stabilization in mineral SOM even at a relatively low C:N ratio.
Key words: carbon; forest soil; litter decay; nitrogen; sugar maple; isotope tracer.
Received 15 July 2010; accepted 10 December 2010; published online 3 February 2011
Author Contributions:Fahey coordinated project, primary responsi-bility for writing. Yavitt assisted in project coordination, data analysis and interpretation and writing. Sherman coordinated field data collection and data analysis. Groffman—project conceptualization and coordination and writing primarily for microbial aspects. Fisk—project conceptualization, field and laboratory analysis and writing. Maerz—project conceptualiza-tion, field and laboratory analysis.
*Corresponding author; e-mail:[email protected]
Ó2011 Springer Science+Business Media, LLC
I
NTRODUCTIONA principal source of carbon (C) and nitrogen (N) supply to forest soil is from transformation of aboveground litter, including dissolution and leaching of organic C and N, fragmentation and particle transport (either biotic or abiotic) and biological mineralization of N to inorganic soluble forms. Filamentous soil fungi promote N transport via extensive hyphal networks that connect litter and soil (Lindahl and others2001; Frey and others
2003). In many acidic forest soils litter accumulates on the soil surface because of limited invertebrate activities capable of fragmentation, particle trans-port and soil mixing. These processes are crucial to forest soil formation and fertility and may be al-tered by changes in soil biota (for example, invasive species such as earthworms; Alban and Berry1994) or environment (for example, N deposition, tem-perature, and so on). Although the process of leaf litter decay has been characterized in great detail over the years, the transport of C and N between litter and soil and its sensitivity to environmental change are not fully understood.
Atmospheric pollution associated with fossil fuel combustion and agriculture results in high levels of nitrogen deposition in downwind areas (Holland and others 1997) that could lead to an overabun-dance of N in soils and ecosystems, a condition known as N saturation (Aber and others 1989). In this condition availability of mineral N exceeds plant N demand, resulting in high rates of nitrifi-cation and consequent nitrate leaching and soil acidification. However, despite prolonged high N deposition, many forests in the northeastern US do not exhibit high nitrate leaching (Martin and oth-ers2000; Goodale and others2003), presumably in part because of a high capacity to retain N in soil organic matter (SOM). For example, it is well known that decaying leaf litter acts as a strong sink for N (Bocock1964) including N from atmospheric deposition (Micks and others 2004). Moreover, isotopic tracer experiments using 15N illustrate short-term immobilization of added N in microbial biomass and SOM (Zogg and others 2000). How-ever, the forms and mechanisms of N retention in forest SOM are not well understood. There is par-ticular uncertainty about how N retention interacts with the stabilization of soil C derived from plant detritus. According to the reasoning of Waksman and Starkey (1931) and elaborated in the Redfield ratio hypothesis (Redfield 1958), the C:N ratio of the soil medium should approach that of the soil microbial community as C is lost as CO2 but N is
retained. Although general patterns of soil and
microbial C:N support this hypothesis, the mecha-nistic underpinnings are not fully explored (Cleveland and Liptzin 2007). For example, how does variation in the biochemistry of detrital sub-strates affect the C:N ratio of stabilized SOM?
The objective of the present study was to quan-tify the co-transport of C and N between leaf litter and an acid forest soil. Using dual labeled (13C and
15
N) leaf litter, we traced C and N flux during the first-year of litter decay. Two types of litter were compared, one in which the 13C was incorporated preferentially into non-structural leaf tissue and the other structural components. We also quanti-fied N transport from older litter and soil to fresh leaf litter. We hypothesized that (1) the C:N ratio of organic matter derived from plant litter and accu-mulating in soil is lower than the C:N of the litter substrate because during stabilization in SOM C is lost as CO2 whereas N is conserved; (2) the 13C
from the non-structural label is more readily uti-lized by soil microbes than the structural label; and (3) fungal transport of N to fresh litter is supplied from older litter as well as mineral soil.
M
ETHODSStudy Site
The research was conducted at Cornell University’s Arnot Forest located in Tompkins County, central New York State (42°15¢N, 76°40¢W) and situated on
the northern Allegheny Plateau. For a detailed site description see Fain and others (1994). Briefly, the study plots were located at 600–620 m elevation in forests dominated by Acer saccharum Marsh. The stands are mature, 2nd-growth forests originating following clear-cut harvest in the 1870s. Basal area ranges from about 30 to 35 m2/ha and canopy height 23–25 m. Soils are acidic Dystrochrepts (pH 4.5–5.0) derived from glacial till overlying Upper Devonian shales. Clay content of the less-than-2-mm fraction ranges from 24–28% in the 0–10 cm soil and sand content from 13–17%. Soils are stony averaging 22% by volume coarse fraction (>2 mm)
in the 0–10 cm soil. Although invasive earthworms are common in the Arnot Forest (Bohlen and others
2004), the study plots were chosen in earthworm-free sites with a well-developed organic horizon (ca. 4 cm thick) overlying mineral soil. The climate is temperate continental with mean temperature of
-4°C in January and 22°C in July, and mean
Isotopic Labeling of Leaf Litter
Sugar maple leaf litter was labeled with13C and15N and applied to 0.5 m2 quadrats in the field study plots. The process for labeling leaf litter is described in detail in Horowitz and others (2009). Briefly, during summer 2006, seven 2.5 m tall93 m
diameter aluminum chambers were positioned over dense sapling stands of sugar maple that had been released by heavy overstory thinning in 2000. The litter layer (Oi) was removed from the soil
surface, and the root systems of the saplings inside the chambers were isolated by trenching to about 0.5 m. Saplings were labeled with15N by applying 0.25 g 15N m-2as 99 atom % enriched15NH4Cl to
each chamber soon after leaf expansion on 22 May 2006. To ensure even distribution the 15N was ap-plied in solution (8 l per chamber) immediately after a large rain event.
The saplings were labeled with13C after enclosing the chambers with polyethylene sheeting. Labeled
13
CO2 (40 atom % enriched) was added to each
chamber on 13 sunny days between 1 September and 20 September 2006. To ensure maximum uti-lization of the label, the procedure involved scrub-bing ambient CO2 (to ca. 50–60 ppm) after sealing
the chambers, injecting 13CO2 until chamber
con-centration reached about 500 ppm, and re-opening the chambers when CO2 concentrations were
re-duced to nearly constant levels (typically after 0.5–1 h). The procedure was successful in enriching foliage to d13C over 300 per mil (Horowitz and
others2009).
All fresh leaf litter was collected from each chamber in September and October 2006, returned to the laboratory, and air-dried to constant mois-ture content. Litter was thoroughly mixed and subsamples taken for chemical analysis. In addi-tion, litter was again collected from the chambers in September–October 2007. We expected the biochemical nature of the isotopic label to differ markedly between the two cohorts of litter: the13C should be primarily in non-structural components (polysaccharides) of the 2006 litter because the label was added at the end of the growing season, whereas in the 2007 leaves the13C primarily would be in structural components. The 2007 litter was processed in the same way as for 2006; however, the drying and storage period were brief as litter was added to the field plots about 1 month after the end of the litterfall period in the chambers.
To characterize the differences in the biochemi-cal distribution of the isotope labels between the structural and non-structural litter, a sequential extraction procedure was conducted on several
subsamples of the initial litter following McLeod and others (2007). Briefly, litter tissue was ex-tracted with 10% formic acid to remove loosely bound polysaccharides; with phosphate buffer to dissolve and remove loosely bound pectin; with cyclohexanediamine tetra acetic acid (CDTA) to remove calcium, which releases bound pectin; with urea to break hydrogen bonds and separate cellu-lose from hemicellucellu-loses; with sodium carbonate to remove remaining pectin; with sodium hydroxide to dissolve hemicelluloses; and finally with formic acid to remove all remaining non-structural sugars. A subsample of the residual solid phase was re-tained after each step for isotope analysis, as de-scribed below. Also, lignin concentration of structural and non-structural litter was analyzed by the standard detergent extraction method (Van Soest1963) by Dairy One, Inc. (Ithaca, NY).
Field Plot Establishment and Sampling
In each of three sugar maple-dominated stands 16 0.5 m2quadrats were established in fall 2007. Half of the quadrats were assigned randomly to the structural-litter treatment and half to the non-structural treatment. Fresh litter from 2007 was removed from each quadrat and a coarse-mesh nylon screen (hole size = 6 cm2) was positioned on the underlying forest floor and anchored at the corners. About 200 g (weighed to±0.01 g) of
iso-tope-labeled litter was added to each quadrat to roughly match leaf litterfall in the study area. A second coarse-mesh screen was positioned on the added litter and anchored to confine the litter and prevent subsequent addition of litterfall.
Fungal ingrowth bags were installed at approxi-mately 5 cm depth in the mineral soil in January 2008, to quantify incorporation of label into fungal hyphae. Bags were placed adjacent to 2 quadrats and inside 2 quadrats per litter type in each plot. Ingrowth bags were constructed of nylon mesh (50lm mesh size, ca. 5 cm diameter). Each bag
was filled with 27 g of acid-washed, autoclaved sand, and sealed with a solder iron. Ingrowth bags were collected in September 2008, and refrigerated prior to hyphal extraction.
The field quadrats were destructively sampled on 21 May and 10 October 2008. Two quadrats from each litter type treatment and each stand were chosen randomly for harvest on each date. First, the corner anchors on the screens were removed and all the litter remaining between the two screens was collected. Next, the underlying forest floor horizons (Oe+Oa) were collected by
soil. Finally, mineral soil was cored to 20 cm depth using 5 cm diameter, sharpened split-PVC corers. Soil samples from several cores (generally 6–8) were composited for each quadrat by 5 cm depth increment. All samples were returned to the labo-ratory for processing the same day as collected.
To quantify N transport from 1-year-old litter to fresh litter the remaining (unharvested) quadrats of each litter treatment type (structural and non-structural label) in each stand were used. In fall 2008, fresh sugar maple litter was collected in the stands and about 200 g m-2
of this unlabeled litter was added to each quadrat and secured in place with a third coarse-mesh screen, as above. In mid-July and mid-November 2009, subsamples of this leaf litter were collected from each plot taking great care to avoid any of the labeled older litter. These litter samples were processed for isotope analysis, as described below.
Lab Processing of Samples
Litter and forest floor samples were weighed moist and a subsample was taken for moisture determi-nation by re-weighing after oven-drying to con-stant mass at 70°C. The subsample was stored for
chemical analysis as described below. A second subsample of forest floor was taken for microbial biomass and related measurements and stored at about 2°C. For mineral soil cores, coarse fragments
(>1 cm) were removed and the rest of the bulk
sample was weighed moist. Subsamples were taken for moisture determinations, isotope analysis, and microbial biomass (and related) measurements. The subsamples were either stored at 2°C (for
microbial biomass) or dried to constant mass at 70°C (for moisture determination) and sieved to
remove the less-than-2 mm fraction.
Samples of litter, forest floor, and soil were finely ground and homogenized for isotope analysis. The elemental and isotopic (13C, 15N) composition of these samples was measured on a Finnigan isotope ratio mass spectrometer at the Cornell Stable Iso-tope Laboratory with appropriate standards for normalization correction, instrument linearity, and precision purposes. Samples were run in batches with expected similarity of isotope enrichment to avoid sample carryover errors.
For inorganic N and microbial biomass mea-surements some pooling of samples was conducted: mineral soil samples were pooled into 0–10 and 10– 20 cm depth increments and samples were pooled by litter type within plots. Inorganic N (NH4+and
NO3
-) was extracted from soil with 2 M KCl fol-lowed by colorimetric analysis on a flow injection
analyzer. Microbial biomass C and N content were measured using the chloroform fumigation-incu-bation method (Jenkinson and Powlson1976). The flush of carbon dioxide was measured by thermal conductivity gas chromatography, and a propor-tionality constant (0.45) was used to calculate biomass C from the CO2 flush. Inorganic N flush
data were not corrected with a proportionality constant. KCl-extracted samples were prepared for
15
N analysis by diffusing inorganic N onto acidified disks (Stark and Hart 1996) which were subse-quently analyzed at the University of California Davis Stable Isotope Lab on a Europa Integra iso-tope ratio mass spectrometer with an integral combustion unit. CO2flush samples were analyzed
for13C at the same facility.
Fungal hyphae were extracted from ingrowth bags by suspending sand from each bag in 100 ml deionized water and shaking for 5 min on a rotary shaker at 120 rpm. Hyphae floated out of the sand and were collected by filtration (25 mm IsoporeTM membranes, 0.22lm pore size). Successive
ali-quots of water were added until no more hyphae could be retrieved. Hyphae were rinsed from filter membranes, frozen and lyophilized. Organic C and N content, 13C, and 15N of fungal hyphae were quantified by mass spectroscopy at the University of California, Davis.
Reference Soils and Isotopes
Calculation of isotope pools and fluxes requires accurate and precise estimates of reference (pre-treatment) soil mass and bulk density, element contents, and isotope natural abundance (Nadelh-offer and Fry 1994). Soil mass, bulk density, and coarse fragment content were determined in each stand by the soil pit excavation method (Rowell
1994). Four soil pits (0.290.2 m) were excavated
to 20 cm depth in 5 cm depth increments at ran-dom locations in each stand. The fine (<2 mm)
fractions were stored and processed for elemental and isotope analysis, as described earlier.
Pools of 13C and 15N in litter on each plot were calculated at time zero and at the time of plot col-lection as the product of dry weight, carbon con-centration, and isotopic atom % (13C and15N). The release of the isotope from each plot during decay was estimated as the difference between initial and final isotope pools in litter; these values were used to estimate percentage of isotope recovered in underlying soil.
in samples from the four soil pits in each stand. (Note: The use of separate reference samples for the three stands proved to be necessary for detecting small quantities of the litter-derived isotopes in the mineral soil because of significant—though minis-cule—differences in isotope natural abundance among the three stands.) We calculated the initial total pool of13C and15N in each soil layer in each stand from the mean isotope natural abundance, mean element (C or N) concentration and dry weight (based on bulk density) of the fine soil fraction (<2 mm) for each depth. We calculated
the final isotope pool for each plot at the time of collection from isotope enrichment and element concentration and assuming bulk density and fine fraction content was equivalent to the stand-level values. Similarly, isotopic enrichment of microbial biomass and fungal hyphae was calculated in ref-erence to control samples collected within each plot. The differences between initial and final iso-topic pool estimates for each depth, component and quadrat were used to calculate % recovery of excess isotopes released from litter.
%recovery
¼ ðfinal soil isotope poolinitial soil isotope poolÞ initial litter isotope pool - final litter isotope pool
ð Þ
100
where
Soil isotope pool¼soil isotope atom% ½element soil mass
This approach assumes no changes over time in the natural abundance of 13C and 15N in the soil pools considered.
Because this percent recovery parameter accounts for between-plot variation in litter decay (that is,
13
C,15N changes) and litter treatment differences in isotope signatures, we used % recovery for statistical comparisons between plots, litter types, and depths. These data were not normally distributed, nor could they be normalized by transformation; hence, non-parametric Mann–Whitney and Kruskal Wallis tests were used to test for differences in percent recovery between litter types. For microbial biomass13C and
15
N wheren= 3 (due to sample pooling) a relaxed threshold of P= 0.10 was used to evaluate signifi-cant treatment effects. Finally, differences in dry weight,13C and15N loss from decaying litter were analyzed using Student’ststatistic.
Transport of15N from the isotopically labeled 1-year-old litter to overlying fresh litter in 2009–2010 was calculated on the assumption that overall dry
weight loss from the fresh litter followed the same time course as observed in 2008–2009 (Figure1). The increase in atom % 15N and total N concen-tration were used to estimate the transport from labeled litter, assuming that 15N from unlabeled sources (older litter, soil, atmospheric deposition) carried the same reference atom % 15N as unla-beled litter; this assumption would likely result in minor error as local atmospheric deposition (del
15
N = 0.86&, Goodale and others2009) and older litter are only very slightly higher in15N than fresh litter (del15N =-1.79&).
R
ESULTSReference Soils
Soils in the study area were very stony with coarse fraction volume of about 30% in the upper 20 cm. An organic horizon comprising about 1 kg dry weight/m2 covered the mineral soil surface (Table1). Bulk density of the less-than-2 mm fraction increased with depth in mineral soil from 0.51 to 0.77 g cm-3
. SOM content (and % C and % N) decreased sharply from the 0–5 to 5–10 cm layer. The C:N ratio declined with depth from 17 in forest floor to 13.5 at 0–20 cm depth. The natural
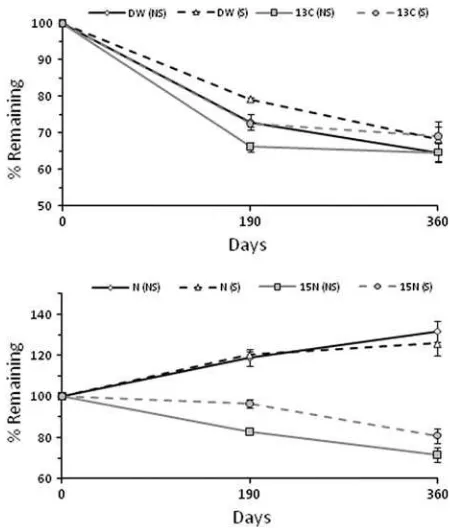
Figure 1. Decomposition of sugar maple litter, (upper) dry weight and13C loss and (lower) total N content and
15
abundance of 13C and 15N increased steadily with depth in soil and background variation was rela-tively low (Table1).
Litter Chemistry
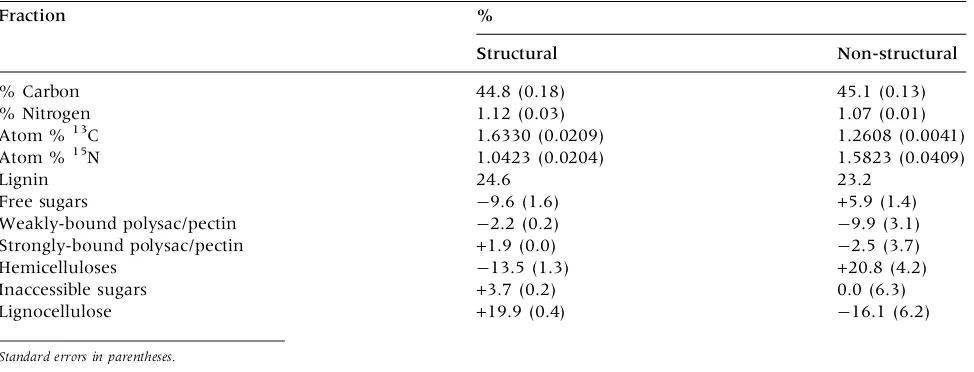
The isotopically labeled sugar maple leaf litter was strongly enriched in both 13C and 15N (Table2). Enrichment of13C was much greater in the structural (d 13C = 417.8&or ‘‘per mil’’) than the
non-struc-tural litter (d13C = 142.1&) whereas the reverse was
true for15N (d15N = 188.0 vs. 337.1&), so that the
13
C:15N ratio was higher in structural litter (62.5) than the non-structural litter (33.6), compared with total C:N of 40–42.
The distribution of 13C isotopes among the extractive biochemical fractions differed markedly between the ‘‘structural’’ and ‘‘non-structural’’ litter for several fractions. The isotope distributions are expressed as a percentage difference from the bulk label in Table2. Most notably, the 13C label was particularly high in the lignocellulose fraction
in the structural litter and low in this fraction in the non-structural litter. Conversely, the hemicellulose fraction was much more highly labeled in the non-structural litter. Surprisingly, the lignocellulose fraction was highly labeled in the non-structural litter even though the labeling was conducted only a few weeks before leaf abscission. The differences in 15N label distribution between litter types were relatively minor, and the label was relatively uni-formly distributed among the extractive fractions. The most notable15N enrichment was in the urea-soluble fraction (hemicellulose complexes) and the most notable 15N depletion was in the lignocellu-lose residue, which also had low total N concen-tration (0.35%N).
Weight Loss and Nitrogen Content
Changes in Decaying Litter
Litter decay followed a typical weak exponential pattern through the first-year of decay (Figure1). Over the first 6 months weight loss was
signifi-Table 1. Selected Physical and Chemical Properties of Soil (<2 mm fraction) from the Study Area in Arnot
Forest, Central New York
Soil layer Bulk density (g/cm3)
Mass/area (kg/m2)
% C %N C:N Per mil
d13C d15N
Forest floor – 0.945 37.91 (1.21) 2.23 (0.06) 17.0 -27.330 (0.174) 0.385 (0.133)
0–5 cm 0.51 (0.04) 20.8 9.308 (1.144) 0.584 (0.059) 15.9 -25.941 (0.128) 7.988 (0.567)
5–10 cm 0.66 (0.05) 24.6 3.246 (0.450) 0.231 (0.023) 14.1 -25.583 (0.107) 12.206 (0.815)
10–15 cm 0.77 (0.08) 27.8 2.684 (0.355) 0.186 (0.010) 14.4 -25.391 (0.091) 12.587 (0.558)
15–20 cm 0.76 (0.07) 28.5 2.199 (0.261) 0.163 (0.014) 13.5 -25.205 (0.168) 13.988 (0.677)
Standard errors in parentheses (n = 12).
Table 2. Chemistry of Isotope-labelled Sugar Maple Leaf Litter and Percent Enrichment (+) or Depletion (-)
of13C in Six Biochemical Extractive Fractions of Structural and Non-structural Litter Relative to the Bulk Litter
Fraction %
Structural Non-structural
% Carbon 44.8 (0.18) 45.1 (0.13)
% Nitrogen 1.12 (0.03) 1.07 (0.01)
Atom %13C 1.6330 (0.0209) 1.2608 (0.0041)
Atom %15N 1.0423 (0.0204) 1.5823 (0.0409)
Lignin 24.6 23.2
Free sugars -9.6 (1.6) +5.9 (1.4)
Weakly-bound polysac/pectin -2.2 (0.2) -9.9 (3.1)
Strongly-bound polysac/pectin +1.9 (0.0) -2.5 (3.7)
Hemicelluloses -13.5 (1.3) +20.8 (4.2)
Inaccessible sugars +3.7 (0.2) 0.0 (6.3)
Lignocellulose +19.9 (0.4) -16.1 (6.2)
cantly higher for the non-structural than the structural-labeled litter, but this difference was not significant after 1 year. Loss of C and13C generally tracked dry weight loss. In contrast, N concentration in leaf litter increased dramatically as decomposi-tion proceeded, nearly doubling over the 1-year period. As a result, the total N content of the litter increased to 26–32% of the initial over the first-year of decay (Figure1). No significant differences were observed between the structural and non-structural litter. Despite this apparent addition of N, significant release of15N occurred during the first-year of de-cay (Figure 1). The loss of 15N was significantly (P<0.01) higher for the non-structural litter than
the structural litter, and about 20–30% of the initial
15
N was lost over the first year. Release of15N was observed both during winter/spring (especially for non-structural litter) and during the growing sea-son (both litter types; Figure 1).
Fresh litter that was added to the unharvested quadrats in Fall 2008 increased significantly in both total N and d 15N by July 2009 and further
in-creased by November 2009 (Table3). No significant differences were observed between the structural and non-structural plots which were pooled for subsequent calculations. Because the only source of 15N enrichment of this unlabeled litter was the labeled litter from the previous year, we can esti-mate the proportion of N transport to first-year litter derived from second-year litter. This value averaged 11.6% by July and 17.7% (cumulative) by November. Presumably, the rest of the N accu-mulating in first-year litter (Figure1) is derived from atmospheric deposition, older litter, and SOM.
Isotope Recovery in Soil and Microbial
Biomass
In May 2008, 6 months after addition of labeled litter, we were able to detect13C enrichment of soil down to the 10–15 cm depth layer; no significant
13
C enrichment was observed at 15–20 cm depth for either the structural or non-structural litter
quadrats (Table4). Similarly, microbial biomass was significantly enriched in13C in forest floor and 0–10 cm mineral soil (Table5) but not in 10–20 cm soil. For purposes of comparison between litter types and depths, we analyzed the recovery of13C as a percentage of the measured13C released from the litter on each individual plot; this calculation utilizes stand-level measurements of reference13C and bulk density (<2 mm fraction mass per depth)
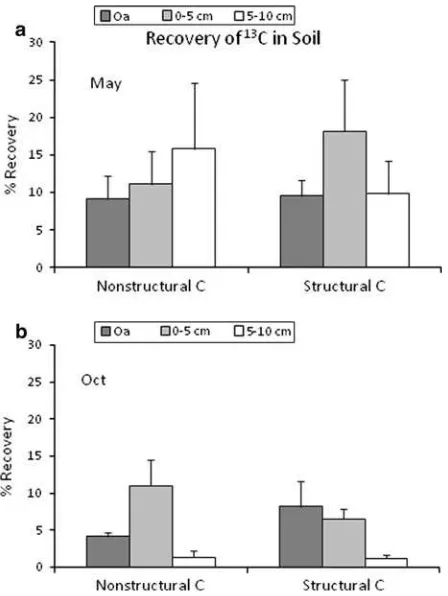
together with experimental quadrat-level mea-surements of litter mass and13C and soil % C. In May, we recovered about 43% of the13C released from the structural litter in soil, with the highest proportion of recovery in 0–5 cm in mineral soil (Figure2). The corresponding value for non-structural litter appeared to be lower (36%), but this difference was not significant (P = 0.25). A less distinct depth pattern was observed for the non-structural litter with no measurable recovery below 10 cm depth.
Percent recovery of 13C in microbial biomass ranged from 1.8% to 2.8% with roughly equal amounts recovered in forest floor and 0–10 cm mineral soil (Table5). Fungal hyphae collected on 1 September 2008 from bags in the upper mineral soil were enriched in 13C and enrichment was signifi-cantly higher in structural (9 ng 13C/g soil±3.3)
than non-structural (3 ng 13C/g soil±0.6)
quad-rats. The 13C in the respirable carbon pool in soil (10-day incubation) averaged about twice as large in the structural versus non-structural litter quadrats (Table6), but this difference was not statistically significant.
By October 2008 both the13C enrichment in soil (Table4) and the % recovery of13C released from litter (Figure2) were significantly lower than in May, and little enrichment was detected below 10 cm depth for either structural or non-structural litter. Percent recovery of 13C was similar for both litter types. Microbial biomass 13C was similar in October as in May but again % 13C recovery in microbial biomass was lower in October (Table5). The13C in the respirable13C pool also appeared to
Table 3. Estimated Translocation of Nitrogen from Decaying 1-Year-Old Sugar Maple Litter into Overlying Fresh Litter at Arnot Forest Plots, Based on Changes in N Concentration andd15N of Fresh Litter and
Assuming Decay Rates Observed in Figure1
Date % N d15N % N from old litter
November (initial) 1.157 -1.989 –
July 2.14 (0.13) +28.68 (5.03) 11.6%
November 2.27 (0.10) +44.48 (5.45) 17.7%
decline by October, especially for the non-struc-tural litter quadrats (Table6).
Not surprisingly, recovery of 15N was much higher than13C. On both collection dates over 90% of the15N released from litter was recovered in the upper 10 cm of soil. Significantly higher soil pool enrichment was observed in the non-structural than the structural litter plots; however, no differ-ences in % recovery were observed between structural and non-structural litter. No 15N enrichment was detected below 10 cm depth (Ta-ble4). The depth pattern of 15N recovery changed
between May and October as enrichment was ini-tially higher for the forest floor horizon and later for 0–5 cm mineral soil (Figure3). Most of the excess15N recovered was in organic form. In May, the proportion of inorganic 15N recovered ranged from about 2% to 6% of total N with significantly higher values in mineral soil than in forest floor horizons.
Microbial biomass also was enriched in15N in the forest floor and upper mineral soil (Table5). Average enrichment was higher (but not signifi-cantly) in the non-structural than the structural
Table 4. Mass Excess of 13C and 15N (Enrichment above Background) in Soils Collected from Quadrats Amended with13C and15N Labeled Leaf Litter in Arnot Forest, NY
Depth Excess13C mg/m2 Excess15N mg/m2
May 2008 Oct 2008 May 2008 Oct 2008
A. Structural
Oa 23.85 (5.46) 25.26 (9.39) 2.14 (0.30) 2.06 (0.62) 0–5 45.97 (17.89) 21.91 (5.73) 2.00 (1.18) 3.17 (0.68) 5–10 24.55 (11.19) 3.48 (1.41) 0.23 (0.09) 1.33 (0.38)
10–15 15.17 (4.94) 2.36 (0.71) 0 0
B. Non-structural
Oa 9.66 (2.11) 4.92 (0.72) 6.08 (0.99) 2.07 (0.22)
0–5 14.56 (4.57) 12.22 (2.80) 1.62 (0.39) 7.13 (1.05) 5–10 17.19 (8.80) 1.39 (0.83) 0.36 (0.14) 3.00 (0.21)
10–15 0 0 0 0
A. Structural label; B. non-structural label (standard errors in parentheses).
Table 5. Carbon and Nitrogen Content of Microbial Biomass, Excess 13C and 15N in Microbial Biomass in Forest Floor and 0-10 cm Mineral Soil, and % Recovery of Isotopes Released from Litter
Soil depth (cm)
Litter type
Microbial biomass (mg per g soil)
Isotopic enrichment of microbial biomass (lg per g soil)
% Recovery in microbial biomass
C N Microbial
C:N
13
C 15N 13C 15N
A. May
Forest floor S 11.31 (1.58) 0.899 (0.96) 12.6 2.87 (0.64) 0.177 (0.03) 0.99 (0.13) 9.9 (3.6) NS 11.14 (0.55) 0.953 (0.150) 11.7 2.16 (0.37) 0.498 (0.109) 1.57 (0.25) 5.7 (1.5) 0–10 S 0.66 (0.07) 0.108 (0.012) 6.1 0.046 (0.04) 0.002 (0.001) 0.81 (0.08) 08.9 (5.8) NS 0.63 (0.10) 0.121 (0.018) 5.2 0.031 (0.02) 0.002 (0.001) 1.23 (0.91) 4.1 (1.4) B. October
Forest floor S 12.63 (0.24) 1.018 (0.068) 12.4 3.59 (0.94) 0.158 (0.015) 0.56 (0.19) 1.39 (0.60) NS 11.94 (1.18) 0.844 (0.035) 14.1 1.45 (0.30) 0.207 (0.029) 0.51 (0.22) 0.71 (0.38) 0–10 S 0.86 (0.23) 0.096 (0.016) 9.0 0.034 (0.020) 0.005 (0.001) 0.53 (0.23) 3.47 (0.48) NS 1.25 (0.23) 0.131 (0.008) 9.5 0.028 (0.022) 0.014 (0.003) 1.11 (0.87) 4.55 (0.81)
Sugar maple litter labeled with13 C and15
litter plots in May but values were more similar by October. Percent recovery of 15N in microbial bio-mass (10–20 % in May) was much higher than for
13
C and generally higher in May than October (about 5%), especially for the forest floor horizons
(Table5). Fungal hyphae in the upper mineral soil also were significantly enriched in15N (2 ng15N/g soil) with no difference between structural and non-structural quadrats.
The ratio of13C:15N in the SOM formed from the decaying litter was generally much lower than for
Figure 2. Recovery of 13C from decaying sugar maple
litter in three soil depth layers, expressed as a percentage of 13C lost from structural and non-structural labeled litter in May 2008 and October 2008.Error barsindicate standard errors.
Table 6. Respirable Carbon in Soil (10 Day Aerobic Incubation), Excess Respirable 13C (Relative to Refer-ence13C) and the Ratio of Microbial C to Soil C for Total C and Excess13C in Structural (S) and Non-structural (NS) Litter Plots at Arnot Forest
Depth Litter type Respirable
13C (lg/g day)
Excess respirable
13C (ng/g day)
Microbial C:
Soil C
Microbial13C:
Soil13C
A. May
Forest floor S 879 (70) 213 (50) 2.98% 10.2%
NS 791 (68) 121 (27) 2.94% 17.7%
0–10 S 25.3 (5.8) 3.59 (1.27) 1.05% 2.9%
NS 39.8 (3.7) 1.80 (0.55) 1.00% 4.4%
B. October
Forest floor S 816 (52) 173 (61) 3.33% 6.6%
NS 472 (125) 36 (13) 3.15% 8.3%
0–10 S 21.8 (3.6) 2.56 (0.66) 1.37% 5.7%
NS 44.0 (1.9) 1.16 (0.69) 1.99% 8.6%
A. May 2008 and B. October 2008.
Figure 3. Recovery of 15N from decaying sugar maple litter in three soil depth layers, expressed as a percentage of 15N lost from structural and non-structural labeled
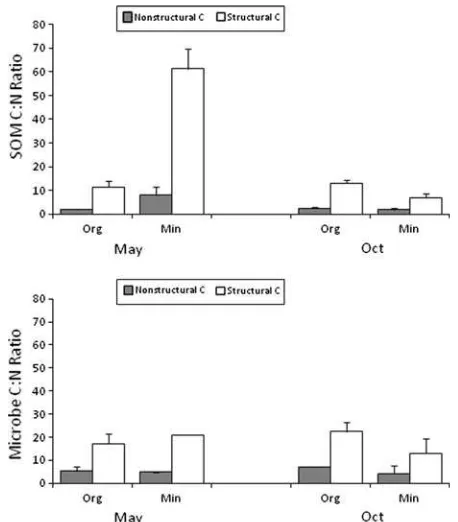
the litter itself (2–12 vs. 34–63), and significant (P<0.01) differences between structural and
non-structural litter plots reflected the higher
13
C:15N in the former litter type (Figure4). Patterns of differences among litter types and soil depths in the13C:15N ratio of new SOM consistently reflected those of the soil microbial biomass (Figure 4). The
13
C:15N ratio of microbial biomass was consistently much lower in the non-structural than the struc-tural litter and this difference was statistically sig-nificant (P <0.10) in the forest floor on both
collection dates (Figure4). Similarly, the 13C:15N ratio in new fungal hyphae was significantly lower in the non-structural (1.4±0.3) than the
struc-tural litter quadrats (4.4±0.5).
D
ISCUSSIONLeaf litter is a principal source of organic matter in forest soils. In many cold and acidic forest soils where physical mixing of litter into soil is minimal because of limited soil macroinvertebrate commu-nities, a thick organic horizon develops on the soil surface, and transport of organic matter to mineral soil occurs primarily by leaching (Park and Matzner
2003). We double labeled sugar maple litter with
13
C and 15N and traced these isotopes to soil. We
compared isotope movement between litter cohorts in which either structural or non-structural tissue components were preferentially labeled. Our overall goal was to better understand this key process of soil formation and nutrient recycling and to provide insights into the role and mechanisms of anthropogenic N deposition in altering this pro-cessing.
Structural versus Non-Structural
13C
Labeling
We observed large differences in the preferential
13
C enrichment of litter tissue fractions between the structural and non-structural litter, especially for lignocellulose, hemicellulose-pectin complexes, and free sugars (Table2). The labeling of the non-structural litter was conducted immediately before leaf abscission and senescence and considerable retranslocation of13C was observed within 1 week of the end of the labeling period (Horowitz and others2009). The structural litter acquired its label almost entirely from the 13C stored in perennial tissues the previous fall and remobilized during leaf expansion and shoot elongation (Horowitz and others 2009); hence, growing cell walls were strongly labeled. The non-structural litter was especially strongly labeled in the hemicellulose fraction (urea extractable; McLeod and others
2007), 21% stronger labeling than for the bulk litter tissue (Table2). This hemi-cellulose fraction is associated with pectins and not with lignin (Popper and Fry2005). Therefore, in late summer the labeled sugars apparently coalesced quickly into hemi-cellulose (Hoch 2007) and pectins that bind to hemicelluloses. Presumably this fraction is more labile than the lignocellulose in the cell walls (Cosgrove2005) that dominated the labeling in the structural litter (20% stronger label than bulk litter, Table2). Not surprisingly, the free sugar fraction was also much more strongly labeled in the non-structural than the non-structural litter.
Litter and Dissolved Organic Carbon
It has long been known especially from studies of stream ecosystems that a considerable proportion of initial leaf litter weight loss is associated with leaching by water (Meyers and Tate 1983). The same is true for terrestrial litter; for example, King and others (2001) noted that over 111 days of laboratory incubation, 78% of weight loss from
Populus litter was by DOC versus only 22% from microbial respiration. Not only soluble and labile sugars but also more recalcitrant tannins are
ched from decomposing leaf litter (Tiarks and oth-ers1992). Hence, much of the weight loss observed from November to May in the present study (Fig-ure 1) probably resulted from leaching of soluble organic matter. We observed differences in over-winter weight loss between ‘‘structural’’ and ‘‘non-structural’’ litter (Figure1), likely due to the fact that the non-structural litter was stored for a year before use. However, after 1 year, weight loss and
13
C release from litter were not significantly dif-ferent between the litter types, and the rate of weight loss was comparable to previous observa-tions for sugar maple in northern hardwood forests (Gosz and others1973).
The proportion of 13C released from litter be-tween November and May that was recovered in soil was surprisingly high (36–43%, Figure 2), indicating that much of the organic matter was not rapidly utilized by soil microorganisms. Using a similar approach, Rubino and others (2010) ob-served that about two-thirds of C released from litter was recovered in soil, the rest being released as CO2. Qualls and Haines (1992) demonstrated
that only a small proportion of DOC in forest soils was likely utilized by microbes during the leaching process with most DOC removal by adsorption to the soil solid phase. Hence, we suspect that much of the overall 13C loss occurred after DOC was deposited in the underlying soil.
Recovery of litter 13C in soil in May was slightly higher for structural than non-structural litter (Figure2), perhaps reflecting the higher lability of the label in the non-structural litter. Don and Kalbitz (2005) argued that the most labile organic matter (for example, soluble sugars) is released first followed by an increasing proportion of more re-calcitrant DOM as microbial activity generates additional soluble compounds in the decaying lit-ter. Hence, a sequence in which an increasing proportion of the DOC released from litter is sta-bilized in SOM could be hypothesized. However, we observed decreasing recovery of13C in soil from May to November even though some additional leaching of DOC from litter undoubtedly occurred. Apparently, the DOC that was added to soil from litter between November and May was subse-quently utilized by microbes at a much higher rate during the summer (probably in part because of higher soil temperature) than any additional litter organic matter that was added to soil by summer leaching. Hence, the seasonal dynamics of C stor-age in temperate forest soils are influenced by seasonality in the supply from litter, its lability, and microbial activity. A moderately large proportion (<16%, Figure2) of the C lost from litter during
the first-year of decay remained in SOM, and this process could contribute significantly to the accu-mulation of C in forest soils. For example, given leaf litterfall C flux at Arnot Forest (200 g C m-2y-1; Bohlen and others 2004), this process could add about 32 g C m-2y-1to the SOM pool, including 15–20 g C m-2y-1 in mineral soil. The process of stabilization of soil C is reflected by the fact that the ratio of microbial biomass13C:soil13C was sev-eral-fold higher than microbial biomass C:soil C (Table5). Additional processing of 13C in SOM by microbes would be expected to cause a reduction in the former ratio, but that was not clearly evident over the first-year of litter decay.
Interactions of Carbon and Nitrogen
Carbon and nitrogen are intimately related in both the leaching of organic matter from plant litter and the decomposition and mineralization of litter (McGill and Cole1981). In general, the C:N ratio of forest SOM decreases with depth (Table1), but the evolution of soil C:N is not completely understood and undoubtedly involves both differential supply and removal processes. For example, Schoenau and Bettany (1983) attributed declining C:N with depth to preferential leaching of N-rich DOM, whereas Qualls and Haines (1992) noted the role of hydro-lysis of DON linked to mineralization of DOC, ra-ther than selective adsorption of DON, in evolution of forest soil C:N. Microbial processes clearly play a key role in soil organic N retention; for example, Perakis and Hedin (2001) observed rapid transfor-mation of inorganic N into SOM in unpolluted, old-growth forest. Our dual labeling of litter with13C and15N provided further insights into the interac-tions of these elements in SOM formation.It has long been known that decaying litter of high initial C:N can be a strong sink for N (Bocock
forests. Several potential sources of this exogenous N transport to decaying litter have been identified, including atmospheric deposition (Micks and oth-ers 2004), asymbiotic N fixation in litter (Russell and Vitousek 1997), and fungal transport from older litter and soil (Fahey and others 1985; Hart and Firestone1991). We were able to estimate that the previous cohort of litter apparently supplies about 18% of this N, with the remainder from these other potential sources.
Presumably, most of the 15N was leached from decaying litter in the form DON because the immobilization potential for inorganic N in litter apparently is very high (Micks and others 2004). This N was strongly retained in the forest floor and upper 5 cm of soil over the winter/spring. Our double labeling of the litter allowed us to estimate the C:N ratio of the litter-derived organic matter that was retained in soil (Figure4). This ratio was much lower for non-structural than structural litter plots and in spring it was much lower in mineral soil than forest floor. The lower value in the non-structural litter plots could result in part from the lower 13C/15N ratio in the litter itself (33.6 vs. 62.5); however, the difference in the 13C:15N ratio of SOM derived from the non-structural versus structural litter was much greater (four to eight-fold) than the less than two-fold difference in the litter itself (Figure4). Hence, the more labile C from the non-structural litter was probably utilized to a greater extent and perhaps accompanied by more effective microbial N immobilization.
The idea that non-structural material is more labile than structural material is further supported by the observation that soil 13C:15N and microbial
13
C:15N showed similar patterns, with much lower ratios in the non-structural than structural litter plots (Figure 4). A similar pattern also was ob-served in fungal hyphae collected in soil bags (C:N = 1.4 vs. 4.4). These low13C:15N ratios should not be mistaken as reflecting the C:N of the new microbial tissue but rather the C:N of what was assimilated from the labeled litter; most of the C and N in the new microbial tissues would be de-rived from unlabeled sources. The patterns in Fig-ure 4 support a strict Redfield ratio interpretation of the C:N stoichiometry of SOM: the DOM derived from litter and adsorbed to soil presumably had a much higher C:N ratio than what was eventually assimilated by the microbial community, and the SOM that accumulated in soil after 1 year carried the C:N signature of that assimilated organic mat-ter.
One possible explanation for the relatively high lability of the non-structural material is that the
depolymerization of pectins and hemicelluloses may produce high amounts of simple carbohydrates. If N availability is limiting to microbial growth as these substrates are being utilized, they may be respired to CO2with little growth and conservation of biomass,
in so-called overflow metabolism (Schimel and Weintraub 2003). An alternative but less likely explanation is that breakdown of products of non-structural C are preferentially allocated to respira-tory pathways whereas those of structural C are allocated to biosynthesis. In any case, the similarity in soil and microbial13C:15N supports the idea that stabilized SOM reflects (is derived from) microbial organic matter (Six and others2004; Jastrow and others 2007; Simpson and others 2007) and emphasizes the importance of microbial processing to soil N storage.
The increasing C:N values of litter-derived, re-tained SOM with increasing soil depth for both litter types could represent either/both processes of dissolved organic matter adsorption or its sub-sequent mineralization. For example, lower C:N compounds could be preferentially adsorbed in surface horizons leaving DOM of higher C:N to be transported more deeply; however, previous observations suggest the reverse should be true, at least for mineral soil horizons (Qualls and Haines
1992; Kaizer and others1996), because of a higher affinity of hydrophobic DOC with lower N con-centration for adsorption to mineral surfaces. Notably, the behavior of surface organic horizons is poorly understood because they are both a sink and source of DOC (Kalbitz and others2000).
The C:N of retained SOM derived from 1 year of the structural label litter decay (7 to 13) was somewhat lower than the overall average SOM (14 to 17) but it exhibited the same pattern of decrease from forest floor to mineral soil (Table 1; Figure4). This litter-derived organic matter is probably a significant source of stabilized forest SOM and eventually provides a small supply of N for sub-sequent biological cycling in the ecosystem. Other sources of forest SOM include particulate material from the aboveground detrital–microbial complex, and root-derived organic matter including rhizo-deposition and root turnover. The relative impor-tance of these sources is not well constrained although root C often appears to have a longer residence time in soil than shoot C (Rasse and others 2005).
Our observations provide the basis for elaborat-ing upon the mechanisms contributelaborat-ing to contin-uing forest soil N retention despite high atmospheric N deposition (Aber and others 1998,
2003; Martin and others 2000; Goodale and others
2003). Experimental studies suggest that most of this N retention is associated with stabilized SOM (Magill and others2004). Our results indicate that a substantial amount of organic N leached from decaying litter is stabilized (at least temporarily) in mineral SOM (Figure3) with significant move-ment of15N into the mineral soil after 1 year.
Differences in d 15N of different pools provide
insight into how N retention remains high in the face of persistent N deposition. We observed much lower d 15N of surface organic horizons than
underlying mineral soil (over 7&, Table1). Together with the low d15N of fresh leaf litter
(-1.79&) and the apparent accumulation of
litter-derived DON in mineral soil during the growing season, this suggests relatively tight recycling of N within and between forest floor and vegetation. Nitrogen accumulation in fresh decaying litter is supplied from three principal sources: 1-year-old litter (apparently about 18% in present study, Table 3), older SOM and atmospheric deposition. A substantial proportion of this N supply to decaying litter is now derived from the latter source because inorganic N in rainfall appears to be efficiently immobilized in Oi litter (Zogg and others 2000;
Micks and others 2004; Raciti and others 2008). The d15N of bulk precipitation in the study region
averages about-0.86&(Goodale and others2009)
which would reinforce the low d15N values
ob-served in forest floor organic matter. Under pristine (low N deposition) conditions a higher proportion of N supply to decaying litter must have been de-rived from older SOM because little would come
from atmospheric deposition. Moreover, presumed higher C:N of fresh litter under pristine conditions would favor higher microbial demand for N and higher flux into first-year litter (Frey and others
2000). Hence, it seems likely that decreased de-mand for fungal translocation to first-year litter could contribute to continuing N retention in soil under high N deposition. Forest floor and mineral soil horizons exhibit highly contrasting behavior and presumably mechanisms of DOC and DON dynamics (Figure4). Mineral soil appears to pro-vide a less transient sink for organic N derived from leaf litter, and perhaps this N retention process has been affected by reduced fungal N demand. Clearly, additional detailed study of the dynamics of DON adsorption and retention in forest floor and mineral soil will be needed to better understand the future capacity of cold temperate forest soils to retain anthropogenic N.
A C K N O W L E D G E M E N T S
For their assistance in various aspects of this re-search the authors wish to thank Patrick Bohlen, Fusheng Chen, Mark Dempsey, Ted Feldpausch, Lisa Martel, Joe Milanovich, Leo Stoscheck, Robin Schmidt and David Lewis. This research was sup-ported by a grant from the National Science Foundation (DEB-0542065).
R E F E R E N C E S
Alban DH, Berry EC. 1994. Effects of earthworm invasion on morphology, carbon, and nitrogen of a forest soil. Appl Soil Ecol 1:243–9.
Aber JD, Nadelhoffer KJ, Stendler P, Melillo JM. 1989. Nitrogen saturation in northern forest ecosystems. Bioscience 39:378–86. Aber JD, McDowell W, Nadelhoffer K, Magill A, Bernston G, Kamakea M, McNulty S, Currie W, Rustad L, Fernandez I. 1998. Nitrogen saturation in temperate forest ecosystems: hypotheses revisited. Bioscience 48:921–34.
Aber JD, Goodale CL, Ollinger SV, Smith M-L, Magill AH, Martin ME, Hallett RA, Stoddard JL. 2003. Is nitrogen depo-sition altering the nitrogen status of northeastern forests? Bioscience 53:375–89.
Blair JM, Crossley DA, Callaham LC. 1992. Effects of litter quality and microarthropods on N dynamics and retention of exogenous15N in decomposing litter. Biol Fertil Soils 12:241–
52.
Bocock KL. 1964. Changes in the amounts of dry matter, nitrogen, carbon and energy in decomposing woodland leaf litter in relation to the activities of the soil fauna. J Ecol 52:273–84.
Bohlen PJ, Groffman PM, Fahey TJ, Fisk MC. 2004. Ecosystem consequences of exotic earthworm invasion of north tem-perate forests. Ecosystems 7:1–12.
Cosgrove DJ. 2005. Growth of the plant cell wall. Nat Rev Mol Cell Biol 6:850–61.
Don A, Kalbitz K. 2005. Amounts and degradability of dissolved organic carbon from foliar litter at different decomposition stages. Soil Biol Biochem 37:2171–9.
Fahey TJ, Yavitt JB, Knight DH, Pearson JA. 1985. The nitrogen cycle in lodgepole pine forest ecosystems, southeastern Wyoming, USA. Biogeochemistry 1:257–75.
Fahey TJ, Williams CJ, Rooney-Varga JN, Cleveland CC, Postek KM, Smith SD, Bouldin DR. 1999. Nitrogen deposition in and around an intensive agricultural district in central New York. J Environ Qual 28:1585–600.
Fain JJ, Volk TA, Fahey TJ. 1994. Fifty years of change in an upland forest in south-central New York: general patterns. Bull Torrey Bot Club 121:130–9.
Frey SD, Elliott ET, Paustian K, Peterson GA. 2000. Fungal translocation as a mechanism for soil nitrogen inputs to sur-face residue decomposition in a no-tillage agroecosystem. Soil Biol Biochem 32:689–98.
Frey SD, Six J, Elliott ET. 2003. Reciprocal transfer of carbon and nitrogen by decomposer fungi at the soil-litter interface. Soil Biol Biochem 35:1001–4.
Goodale CL, Aber JD, Vitousek PM. 2003. An unexpected nitrate decline in New Hampshire streams. Ecosystems 6:75–86. Goodale CL, Thomas SA, Fredericksen G, Elliott EM, Flinn KM,
Butler TJ, Walter MT. 2009. Unusual seasonal patterns and inferred processes of nitrogen retention in forested headwa-ters of the Upper Susquehanna River. Biogeochemistry 93:197–218.
Gosz JR, Likens GE, Bormann FH. 1973. Nutrient release from decomposing leaf and branch litter in the Hubbard Brook Forest, New Hampshire. Ecol Monogr 43:173–91.
Hart SC, Firestone MK. 1991. Forest floor-mineral soil interac-tions in the internal nitrogen cycle of an old-growth forest. Biogeochemistry 12:73–97.
Hoch G. 2007. Cell wall hemicelluloses as mobile carbon stores in non-reproductive plant tissues. Funct Ecol 21:823–34. Holland EA, and others. 1997. Variations in the predicted spatial
distribution of atmospheric nitrogen deposition and their impact on carbon uptake by terrestrial ecosystems. J Geophys Res 102(D13):15849–66.
Horowitz ME, Fahey TJ, Yavitt JB, Feldpausch TR, Sherman RE. 2009. Patterns of late-season photosynthate movement in sugar maple (Acer saccharumMarsh) saplings. Can J For Res 39:2294–8.
Jastrow JD, Amonette JE, Bailey VL. 2007. Mechanisms con-trolling soil carbon turnover and their potential application for enhancing carbon sequestration. Clim Change 80:5–23. Jenkinson DS, Powlson DS. 1976. The effects of biocidal
treat-ments on metabolism in soil V. A method for measuring soil biomass. Soil Biol Biochem 8:209–13.
Kaiser K, Guggenberger G, Zeck W. 1996. Sorption of DOM and DOM fractions to forest soils. Geoderma 74:283–303. Kalbitz K, Solinger S, Park J-H, Michalzik B, Matzner E. 2000.
Controls on the dynamics of dissolved organic matter in soils: a review. Soil Sci 165:277–304.
King JS, Pregitzer KS, Zak DR, Kubiske ME, Holmes WE. 2001. Correlation of foliage and litter chemistry of sugar maple,Acer saccharum, as affected by elevated CO2and varying N
avail-ability and effects on decomposition. Oikos 94:403–16. Lindahl B, Finlay R, Olsson S. 2001. Simultaneous, bi-directional
translocation of32P and33P between wood blocks connected
by mycelical cords of Hypholoma fasciculare. New Phytol 150:189–94.
Magill AH, Aber JD, Currie WS, Nadelhoffer KJ, Martin ME, McDowell WH, Melillo JM, Steudler P. 2004. Ecosystem re-sponse to 15 years of chronic nitrogen additions at the Har-vard Forest LTER, Massachusetts, USA. For Ecol Manag 196:7–28.
Martin CW, Driscoll CT, Fahey TJ. 2000. Changes in stream-water chemistry after 20 years from forested stream-watersheds in New Hampshire, USA. Can J For Res 30:1206–13.
McGill WB, Cole CV. 1981. Comparative aspects of cycling of organic C, N, S and P through soil organic matter. Geoderma 26:267–86.
McLeod AR, Newsham KK, Fry SC. 2007. Elevated UV-B radi-ation modifies the extractability of carbohydrates from leaf litter ofQuercus robur. Soil Biol Biochem 39:116–26. Meyers JL, Tate CM. 1983. The effects of watershed disturbance
on dissolved organic carbon dynamics of a stream. Ecology 64:33–44.
Micks P, Downs MR, Magill AH, Nadelhoffer KJ, Aber JD. 2004. Decomposing litter was a sink for15N-enriched additions to an
oak forest and a red pine plantation. For Ecol Manag 196:71– 87.
Nadelhoffer KJ, Fry B. 1994. Nitrogen isotope studies in forest ecosystems. In: Lajtha K, Michener RH, Eds. Stable isotopes in ecology and environmental science. Oxford, UK: Blackwell. p 22–44.
Park J-H, Matzner E. 2003. Controls on the release of dissolved organic carbon and nitrogen from a deciduous forest floor investigated by manipulation of aboveground litter inputs and water flux. Biogeochemistry 66:265–86.
Perakis SS, Hedin LO. 2001. Fluxes and fates of nitrogen in soil of an unpolluted old-growth temperate forest, southern Chile. Ecology 82:2248–60.
Popper ZA, Fry SC. 2005. Widespread occurrence of a covalent linkage between xyloglucan and acidic polysaccharides in suspension-cultured angiosperm cells. Ann Bot 96:91–6. Qualls RG, Haines BL. 1992. Biodegradability of dissolved
or-ganic matter in forest throughfall, soil solution, and stream water. Soil Sci Soc Am J 56:578–86.
Raciti SM, Groffman PM, Fahey TJ. 2008. Nitrogen retention in urban lawns and forests. Ecol Appl 18(7):1615–1626. Rasse DP, Rumpel C, Dignac M-F. 2005. Is soil carbon mostly
root carbon? Mechanisms for a specific stabilization. Plant Soil 269:341–56.
Redfield A. 1958. The biological control of chemical factors in the environment. Am Sci 46:205–21.
Rowell DL. 1994. Soil science: methods and applications. Lon-don, UK: Longman.
Rubino M, Dungait JAJ, Evershed RP, Bertolini T, De Angelis P, D’Onofrio A, Lagomarsino A, Lubritto C, Merola A, Terrasi F, Cotrufo MF. 2010. Carbon input belowground is the major C flux contributing to leaf litter mass loss: evidences from a13C labeled-leaf litter experiment. Soil Biol Biochem 42:1009–16. Russell AE, Vitousek PM. 1997. Decomposition and potential nitrogen fixation inDicranopteris linearislitter on Mauna Loa, HI. J Trop Ecol 13:579–94.
Schimel JP, Weintraub MN. 2003. The implications of exoen-zyme activity on microbial carbon and nitrogen limitation in soil: a theoretical model. Soil Biol Biochem 35:549–63. Schoenau JJ, Bettany JR. 1983. Organic matter leaching as a
in a forest, grassland, and gleyed soil. Soil Sci Soc Am J 61:646–51.
Simpson AJ, Simpson MJ, Smith E, Kelleher BP. 2007. Micro-bially derived inputs to soil organic matter: are current esti-mates too low? Environ Sci Technol 41:8070–6.
Six J, Bossuyt H, Degryze S, Denef K. 2004. A history of research on the link between (micro) aggregates, soil biota and soil organic matter dynamics. Soil Tillage Res 79:7–31.
Stark JM, Hart SC. 1996. Diffusion technique for preparing salt solutions, Kjeldahl digests, and persulfate digests for nitrogen-15 analysis. Soil Sci Soc Am J 60:1846–55.
Tiarks AE, Meier CE, Flagler RB, Steynberg EC. 1992. Sequential extraction of condensed tannins from pine litter at different stages of decomposition. In: Hemmingway RW, Laks PE, Eds. Plant polyphenolics: synthesis, properties, significance. NY: Plenum Press. p 597–608.
van Soest PJ. 1963. Use of detergents in the analysis of fibrous feeds: a rapid method for the determination of fiber and lig-nin. J Assoc Agric Chem 46:829–35.
Waksman S, Starkey R. 1931. The soil and the microbe. London: Wiley.
Wesse´n B, Berg B. 1986. Long-term decomposition of barley straw: chemical changes and ingrowth of fungal mycelium. Soil Biol Biochem 18:53–9.
Zeller B, Colin-Belgrand M, Dambrine E, Martin F, Bottner P. 2000. Decomposition of15N-labelled beech litter and fate of
nitrogen derived from litter in a beech forest. Oecologia 123:550–9.