AUTHORS
Indonesia Climate Change Sectoral Roadmap – ICCSR
Waste Sector
Adviser
Prof. Armida S. Alisjahbana, Minister of National Development Planning/Head of Bappenas
Editor in Chief
U. Hayati Triastuti, Deputy Minister for Natural Resources and Environment, Bappenas
ICCSR Coordinator
Edi Effendi Tedjakusuma, Director of Environmental Affairs, Bappenas
Editors
Irving Mintzer, Syamsidar Thamrin, Heiner von Luepke, Dieter Brulez
Synthesis Report
Coordinating Author for Mitigations: Hardiv Haris Situmeang
Waste Sector Report
Authors: Asep Sofyan, Enri Damanhuri, Oman Abdurrahman
Technical Supporting Team
Chandra Panjiwibowo, Indra Ni Tua, Edi Riawan, Hendra Julianto
Administrative Team
ACKNOWLEDGMENTS
The Indonesia Climate Change Sectoral Roadmap (ICCSR) is meant to provide inputs for the next ive
year Medium-term Development Plan (RPJM) 2010-2014, and also for the subsequent RPJMN until 2030, laying particular emphasis on the challenges emerging in the forestry, energy, industry, agriculture, transportation, coastal area, water, waste and health sectors. It is Bappenas’ policy to address these challenges and opportunities through effective development planning and coordination of the work of all line ministries, departments and agencies of the Government of Indonesia (GoI). It is a dynamic document and it will be improved based on the needs and challenges to cope with climate change in the future. Changes and adjustments to this document would be carried out through participative consultation among stakeholders.
High appreciation goes to Mrs. Armida S. Alisyahbana as Minister of National Development Planning /Head of the National Development Planning Agency (Bappenas) for the support and encouragement. Besides, Mr. Paskah Suzetta as the Previous Minister of National Development Planning/ Head of Bappenas who initiated and supported the development of the ICCSR, and Deputy Minister for Natural Resources and Environment, Ministry of National Development Planning /Bappenas, who initiates and coordinates the development of the ICCSR.
To the following steering committee, working groups, and stakeholders, who provide valuable comments and inputs in the development of the ICCSR Waste Sector document, their contributions are highly appreciated and acknowledged:
Steering Committee (SC)
Deputy of International Cooperation, Coordinating Ministry for Economy; Secretary of Minister, Coordinating Ministry for Public Welfare; Secretary General, Ministry of Public Works; Deputy of Economy, Deputy of Infrastructures, Deputy of Development Funding, Deputy of Human Resources and Culture, Deputy of Regional Development and Local Autonomy, National Development Planning Agency; and Chief of Secretariat of the National Council for Climate Change.
Working Group
Ministry of Environment
Sulistyowati, Haneda Sri Mulyanto, Dadang Hilman, Upik S. Aslia, Agus Gunawan, Yulia Suryanti
Ministry of Public Works
Djoko Murjanto, Mochammad Amron, Susmono, A. Hasanudin, Djoko Mursito, Handy Legowo, Setya
National Development Planning Agency
Sriyanti, Yahya R. Hidayat, Bambang Prihartono, Mesdin Kornelis Simarmata, Arum Atmawikarta, Montty Girianna, Wahyuningsih Darajati, Basah Hernowo, M. Donny Azdan, Budi Hidayat, Anwar Sunari, Hanan Nugroho, Jadhie Ardajat, Hadiat, Arif Haryana, Tommy Hermawan, Suwarno, Erik Amundito, Rizal Primana, Nur H. Rahayu, Pungki Widiaryanto, Maraita, Wijaya Wardhana, Rachmat Mulyanda, Andiyanto Haryoko, Petrus Sumarsono, Maliki
Universities and Professionals
ITB: Saut Lubis, Retno Gumilang; Asia Carbon: Architrandi Priambodo, Susy Simarangkir
Grateful thanks to all staff of the Deputy Minister for Natural Resources and Environment, Ministry of National Development Planning/ Bappenas, who were always ready to assist the technical facilitation as
well as in administrative matters for the inalization process of this document.
Remarks from Minister of National
Development Planning/Head of bappenas
We have seen that with its far reaching impact on the world’s ecosystems as well as human security and development, climate change has emerged as one of the most intensely critical issues that deserve the attention of the world’s policy makers. The main theme is to avoid an increase
in global average temperature that exceeds 2˚C, i.e. to reduce annual
worldwide emissions more than half from the present level in 2050. We believe that this effort of course requires concerted international
response – collective actions to address potential conl icting national
and international policy initiatives. As the world economy is now facing
a recovery and developing countries are struggling to fuli ll basic needs
for their population, climate change exposes the world population to exacerbated life. It is necessary, therefore, to incorporate measures to address climate change as a core concern and mainstream in sustainable development policy agenda. We are aware that climate change has been researched and discussed the world over. Solutions have been proffered, programs funded and partnerships embraced. Despite this, carbon emissions continue to increase in both developed and developing countries. Due to its geographical location, Indonesia’s
vulnerability to climate change cannot be underplayed. We stand to experience signii cant losses. We will face – indeed we are seeing the impact of some these issues right now- prolonged droughts, l ooding and
increased frequency of extreme weather events. Our rich biodiversity is at risk as well.
Those who would seek to silence debate on this issue or delay in engagement to solve it are now marginalized to the edges of what science would tell us. Decades of research, analysis and emerging environmental evidence tell us that far from being merely just an environmental issue, climate change will touch every aspect of our life as a nation and as individuals.
Regrettably, we cannot prevent or escape some negative impacts of climate change. We and in particular the developed world, have been warming the world for too long. We have to prepare therefore to adapt to the changes we will face and also ready, with our full energy, to mitigate against further change. We
have ratii ed the Kyoto Protocol early and guided and contributed to world debate, through hosting
the 13th Convention of the Parties to the United Nations Framework Convention on Climate Change
planning and priority setting.
I am delighted therefore to deliver Indonesia Climate Change Sectoral Roadmap, or I call it ICCSR, with the aim at mainstreaming climate change into our national medium-term development plan.
The ICCSR outlines our strategic vision that places particular emphasis on the challenges emerging in the forestry, energy, industry, transport, agriculture, coastal areas, water, waste and health sectors. The content of the roadmap has been formulated through a rigorius analysis. We have undertaken vulnerability assessments, prioritized actions including capacity-building and response strategies, completed by
associated inancial assessments and sought to develop a coherent plan that could be supported by line
Ministries and relevant strategic partners and donors.
I launched ICCSR to you and I invite for your commitment support and partnership in joining us in realising priorities for climate-resilient sustainable development while protecting our population from further vulnerability.
Minister for National Development Planning/ Head of National Development Planning Agency
Remarks from Deputy Minister for Natural
Resources and Environment, bappenas
To be a part of the solution to global climate change, the government of Indonesia has endorsed a commitment to reduce the country’s GHG emission by 26%, within ten years and with national resources, benchmarked to the emission level from a business as usual and, up to 41% emission reductions can be achieved with international support to our mitigation efforts. The top two sectors that contribute to the country’s emissions are forestry and energy sector, mainly emissions from deforestation and by power plants, which is in part due to the fuel used, i.e., oil and coal, and part of our high energy intensity.
With a unique set of geographical location, among countries on the Earth we are at most vulnerable to the negative impacts of climate
change. Measures are needed to protect our people from the adverse effect of sea level rise, l ood,
greater variability of rainfall, and other predicted impacts. Unless adaptive measures are taken, prediction tells us that a large fraction of Indonesia could experience freshwater scarcity, declining crop yields, and vanishing habitats for coastal communities and ecosystem.
National actions are needed both to mitigate the global climate change and to identify climate change adaptation measures. This is the ultimate objective of the Indonesia Climate Change Sectoral Roadmap, ICCSR. A set of highest priorities of the actions are to be integrated into our system of national development planning. We have therefore been working to build national concensus and understanding of climate change response options. The Indonesia Climate Change Sectoral Roadmap (ICCSR) represents our long-term commitment to emission reduction and adaptation measures and it shows our ongoing, inovative climate mitigation and adaptation programs for the decades to come.
Deputy Minister for Natural Resources and Environment National Development Planning Agency
TAbLE Of CONTENT
AUTHORS i
ACKNOWLEDGMENTS ii
Remarks from Minister of National Development Planning/Head of Bappenas iv
Remarks from Deputy Minister for Natural Resources and Environment, Bappenas vi
Table of Content vii
List of Table ix
List of Figure x
List of Acronyms, Abbreviations, and Units vii
1 INTRODUCTION 1
1.1 Background and Objective 1
1.2 Reporting Methodology 2
1.2.1 Analysis 2
1.2.2 Stakeholders’ Participation Process 3
1.2.3 Reporting Systematics 3
2 CURRENT CONDITION AND FUTURE CHALLENGES 5
2.1 Municipal Solid Waste Source Condition 6
2.2 Transportation Condition 9
2.3 Waste Processing Condition 10
2.4 Reduce, Reuse, Recycle (3R) Condition 13
2.5 Policies and Laws 14
2.6 Future Challenges of Waste Management 15
3 MITIGATION POTENTIAL IN WASTE SECTOR 17
3.1 Calculation Method 17
4 POTENTIAL MITIGATION SCENARIO AND STRATEGIC ISSUES
OF CLIMATE CHANGE IN WASTE SECTOR 22
4.1 Greenhouse Gas Mitigation Scenario of Waste Sector 22
4.2 Greenhouse Gas Mitigation Scenario in Urban Area 23
4.3 Greenhouse Gas Mitigation Scenario in Rural Area 30
4.4 Calculation Result of GHGs Scenario for Mitigation on Waste Sector 33
4.5 Calculation of Abatement Cost 43
5 INTEGRATION OF MITIGATION POLICIES
INTO WASTE SECTOR PLANNING 47
5.1 Alternative Formulation of Mitigation Policies based on the Funding difference 47
5.2 Strategic Issues of Climate Change in Waste Sector 67
5.2.1 Data Inventory and Planning Group 68
5.2.2 Regulationand Policy Group 68
5.2.3 Implementation Group 69
5.2.4 Capacity Building Group 70
REFERENCES 71
LiST Of TAbLE
Table 2.1 Waste Management Condition in Indonesia in 2005 11
Table 3.1 Emission Factor for Each Activity of Waste Management 18
Table 3.2 Cost for Each Activity of Waste Management 19
Table 4.1 Comparison Matrix of GHG Emission Mitigation Scenario
from Waste Sector in Indonesia for Urban Areas. 39
Table 4.2 Comparison Matrix of GHGs Emission Mitigation Scenario from
Waste Sector in Indonesia for Rural Areas. 42
Table 5.1 Assumptions used in Alternative 1 (BAU) 49
Table 5.2 Assumptions recapitulation in Alternative 1 (BAU) 49
Table 5.3 Assumptions used in alternative 2 (Law-Based, Maximum funding) 50
Table 5.4 Assumptions recapitulation in Alternative 2 (Law-Based, Maximum Funding) 51
Table 5.5 Assumptions used in alternative 3 (Optimistic) 52
Table 5.6 Assumptions recapitulation in Alternative 3 (Optimistic Funding) 53
Table 5.7 Assumptions used in Policy Alternative 4 (Moderate funding) 54
Table 5.8 Assumptions recapitulation in Alternative 4 (Moderate Funding) 55
Table 5.9 Assumptions used in alternative 5 (Pessimistic funding) 56
Table 5.10 Assumptions recapitulation in Alternative 5 (Pessimistic Funding) 56
Table 5.11 Mitigation Action Matrix of Alternative Policies (based on the difference
LiST Of fiGURE
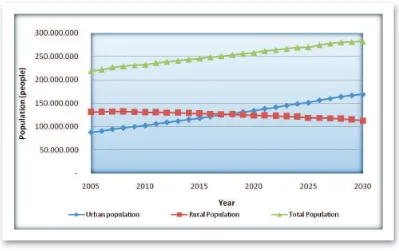
Figure 2.1 Prediction of urban and rural population in Indonesia until 2030 6
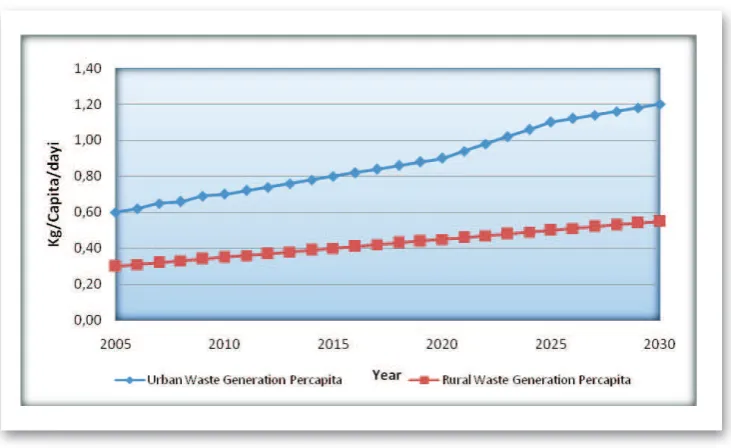
Figure 2.2 Prediction of solid waste generation percapita until 2030 6
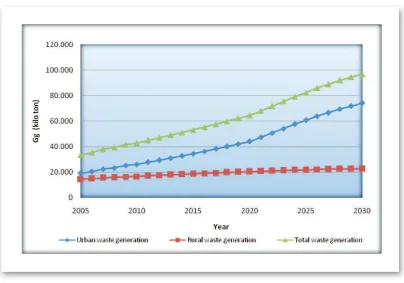
Figure 2.3 Prediction of solid waste generation until 2030 7
Figure 2.4 Distribution map of waste generation in Indonesia in 2010 8
Figure 2.5 Distribution map of waste generation in Indonesia in 2030 8
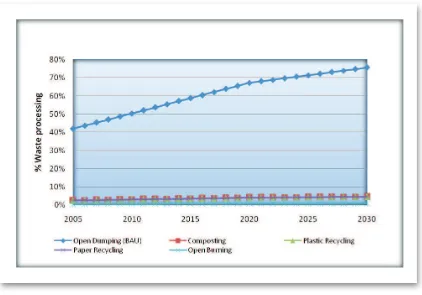
Figure 2.6 Solid waste management condition in Indonesia in 2005 9
Figure 2.7 Prediction of solid waste that is collected and transported by local government 10
Figure 2.8 Solid waste processing in urban and rural in Indonesia in 2005 12
Figure 2.9 Solid waste processing that is managed by community in 2005 12
Figure 4.1 Urban waste generation per capita in Source Reduction Scenario 24
Figure 4.2 Waste generation in Source Reduction Scenario compared with BAU 25
Figure 4.3 Projection of % waste processing by Local Government in 3R and
Composting Scenario in Urban areas 26
Figure 4.4 Projection of % waste processing by Local Community in 3R and
Composting Scenario in Urban areas 26
Figure 4.5 Projection of % waste processing by Local Government in SL+CL
Scenario in Urban areas 27
Figure 4.6 Projection of % waste processing by Local Community in SL+CL
Scenario in Urban areas 28
Figure 4.7 Projection of % waste processing by Local Government in SL+LFG
Scenario in Urban areas 29
Figure 4.8 Projection of % waste processing by Local Community in SL+LFG
Scenario in Urban areas 29
Figure 4.10 Projection of % waste processing by Local Community in BAU Scenario in Rural 31
Figure 4.11 Projection of waste generation percapita in Source Reduction Scenario
in Rural compared with BAU 32
Figure 4.12 Projection of waste generation in Source Reduction Scenario in Rural
compared with BAU 32
Figure 4.13 GHG emissions (in Gg CO2 eq) in urban areas for every scenario 34
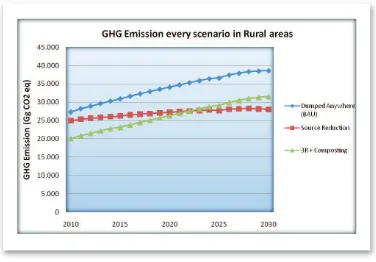
Figure 4.14 GHG emissions (in Gg CO2 eq) in rural areas for every scenario 35
Figure 4.15 GHG emission reduction (in Gg CO2 eq) in urban areas for every scenario 36
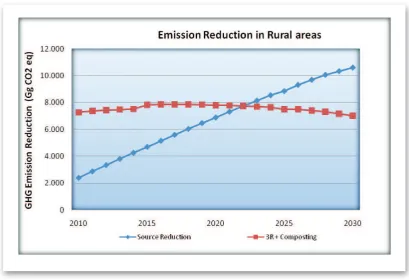
Figure 4.16 GHG emission reduction (in Gg CO2 eq) in rural areas for every scenario 36
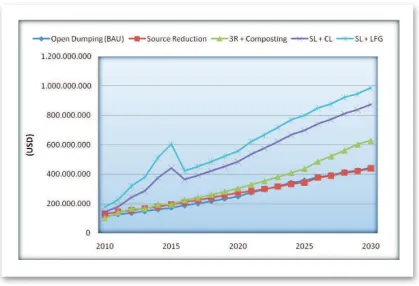
Figure 4.17 Waste Management cost in urban areas for every scenario 37
Figure 4.18 Mitigation cost (Scenario Cost - BAU Cost) in urban areas for every scenario 37
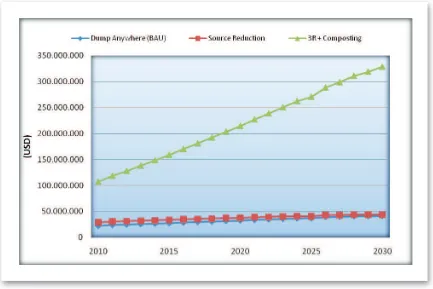
Figure 4.19 Waste Management cost in rural areas for every scenario 38
Figure 4.20 Mitigation cost (Scenario Cost - BAU Cost) in rural areas for every scenario 38
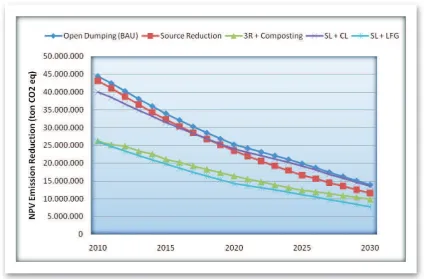
Figure 4.21 Calculation of NPV for Emision Reductions (in tons CO2 eq) for each
scenario in urban areas 43
Figure 4.22 Calculation of NPV for Emision Reductions (in tons CO2 eq) for each
scenario in rural areas 44
Figure 4.23 Calculation of NPV for Mitigation Costs (in USD) for each scenario in urban areas 44
Figure 4.24 Calculation of NPV for Mitigation Costs (in USD) for each scenario in rural areas 45
Figure 4.25 Abatement Costs for each scenario in urban areas (in USD/ton) 45
Figure 4.26 Abatement Costs for each scenario in rural areas (in USD/ton) 46
Figure 5.1 GHG emissions (in tons CO2 eq) for each alternative compared to Alternative 1 (BAU) 58
Figure 5.2 GHG emission reductions (in tons CO2 eq) compared to Alternative 1 (BAU) 59
LiST Of ACRONyMS, AbbREviATiONS, AND UNiTS
BL Baseline scenario
cap capita
CDM clean development mechanism
CER certiied emission reduction
CH4 methane
CL controlled landill
CO carbon monoxide
CO2 carbon dioxide
CO2 eq carbon dioxide equivalent DOC degradable organic carbon
DOCF degradable organic carbon dissimilated EF emission factor
eq equivalent
g gram
Gg gigagram
GHG greenhouse gas
Gt gigatonne
H2 hydrogen
H2O water
ha hectare
IPCC Intergovernmental Panel on Climate Change k methane generation rate constant
kWh kilowatt-hour
L litre
L0 methane generation potential
LFG landill gas
m metre
m3 cubic metre
MCF methane conversion factor
Mt megatonnes
MSW municipal solid waste
Mt megatonne
mV millivolt
MW megawatt
N nitrogen
N2 nitrogen gas
NA not applicable N/A not available N2O nitrous oxide
O2 oxygen
OD open dumping
OECD Organisation for Economic Co-operation and Development ppb part per billion
ppbv part per billion by volume ppm part per million
SL sanitary landill
t tonne
t-km tonne-kilometre TWh terrawatt-hour
iNTRODUCTiON
1.1 Background and Objective
As efforts to climate change mitigation on national level, Indonesia has implemented the following steps:
• Government of Indonesia has ratiied United Nations Framework of Climate Change Convention
(UNFCCC) through Act No. 6, in1994
• Government of Indonesia has ratiied Kyoto Protocol through Act No. 17, in 2004.
• On November 26th 2007, the Ministry of Environment has compiled Rencana Aksi Nasional Perubahan
Iklim (RAN-PI) as a commitment to greenhouse gas and climate change mitigation.
• Indonesia was the host of UN’s 13th Conference of Parties (COP) in Global Warming in Bali on
December 3rd-14th 2007.
• According to the speech of President Susilo Bambang Yudhoyono, the Government of Indonesia has committed to reduce greenhouse gases targeting a reduction of 26% in 2020 (including Landuse, Landuse Change and Forestry). With the right mixture of domestic policies and international
support, the Government of Indonesia is conident that greenhouse gas emissions can be reduced
by as much as 41% [SBY, 2009]. A presidential decree, stipulating this commitment, had been prepared in January 2010.
• In September 2009, the National Development Planning Agency (Bappenas) has launched
Indonesia’s Climate Change Trust Fund [ICCTF, 2009], as a inancing mechanism to bridge international architecture for climate change in an eficient, transparent, and accountable manner.
In general greenhouse gas (GHG) emissions from waste occur during the incineration and open burning of waste, wastewater treatment and discharge, biological treatment of solid waste and from solid waste disposal. In Indonesia the major source of greenhouse gas emissions among the mentioned sources is the disposal and open burning of solid waste. Approximately 42.76 megatonnes of solid waste will be produced in Indonesia in 2010 and hence a signicant amount of GHG equivalents, especially methane
(CH4) emitted. CH4 emissions occur in managed and unmanaged landills from anaerobic degradation of organic material. They cannot be controlled, because inal waste disposal technology has not been applied yet and open dumping is still common practice. Currently there are about 400 landills (open dumping)
in Indonesia, which are managed by the local governments. At national level the local governments are supported by the Ministry of Public Works with technical assistant, regulation and quality control of solid waste management, while environmental aspects are supported and controlled by the Ministry of Environment.
purpose is to give direction for the mitigation of GHG emissions from domestic solid waste disposal and open burning, as well as integrating these mitigation measures into development planning to build up a sustainable national waste sector management.
In this Waste Sector Roadmap, mitigation options will be discussed for GHG emissions from domestic solid waste only, because (1) they are the major source of GHG emissions from the waste sector, and (2) the management of solid waste seems to be more advanced than the management of wastewater etc. and yet ready to implement GHG emissions mitigation measures in both short and long term. The detailed objectives of this Waste Sector Roadmap are:
• To estimate Indonesia’s potential GHG emissions resulting from domestic solid waste to year 2030;
• To estimate the size of GHG emissions mitigation potential from domestic solid waste as a contribution to Indonesia’s national commitments to reduce GHG emissions;
• To incorporate the waste sector’s emissions reduction efforts into the national economic development plans;
• To position solid waste management as a priority for action in the short and medium-terms; and • To identify technologies and programs required to support activities that can reduce GHG emissions
from solid waste disposal and open burning.
1.2 Reporting Methodology
1.2.1 Analysis
Analysis in the formulation of the Climate Change Sectoral Roadmap for the waste sector was conducted in the following way:
a) Collect and review documents related to the Indonsian waste sector from the Ministry of Public Works, the State Ministry of Environment, the National Development Planning Agency and the Agency for the Assessment and Application of Technology (BPPT) such as Synthesis Report for Indonesia’s Technology Need Assessment on Climate Change Mitigation (Agency for the Assessment and Application of Technology - GTZ, March 2009).
b) Conduct a literature review and a scientiic basis study of the impact of domestic waste on climate
change, e.g. by reviewing the document of 2006 IPCC Guideline.
d) Build GHG emissions scenarios for different GHG emissions mitigation options.
e) On the base of these GHG emissions scenarios develop a mitigation program for the Indonesian waste sector within the mentioned boundaries.
1.2.2 Stakeholders’ Participation Process
Participation of stakeholders during the process of preparing this Waste Sector Roadmap could be achieved in several ways, including:
• Consultation and discussion conducted with the oficials, researchers, and experts in the relevant
agencies, especially the National Development Planning Agency, Ministry of Public Works, and Ministry of Environment.
• Implementation of Forum Group Discussion (FGD), Pre-FGD, and coordination meeting with the Ministry of Public Works and related agencies, which have been conducted both in Bappenas and in the Ministry of Public Works. This FGD also discussed cross-sectoral issues.
1.2.3 Reporting Systematics
This Waste Sector Roadmap is divided into 5 chapters with the following systematics: • Chapter 1 discusses background and objective of the Waste Sector Roadmap • Chapter 2 discusses the condition of waste management in Indonesia
• Chapter 3 discusses the calculation methodology of greenhouse gases from landills and its
potential in Indonesia, as well as various assumptions used in the calculation.
• Chapter 4 discusses various scenarios for the mitigation of GHG emissions from landills. In
order to elucidate the most effective and eficient scenario, the abatement costs of the scenarios
are compared.
CURRENT CONDiTiON
AND fUTURE
CHALLENGES
Post-consumer waste is one of the contributors to global greenhouse gas (GHG) emissions with the largest amount of waste generated methane (CH4) originationg from landi lls. There are about 400
landi lls in Indonesia, which are all open dump sites. Solid waste management services in Indonesia are authorized by local governments to encompass collection, transportation, treatment and i nal disposal of waste. Eventhough currently the dominant i nal disposal option is still open dumping, which causes many
environmental and social problem, most of the local governments have attempted to improve their waste management in an environmentally and socially satisfactory manner using the most economical means available. Solid waste management follows Act No. 18 of 2008 on Waste Management.
Setting a baseline for GHG emissions from domestic solid waste is an essential step for assessing potential GHG emissions mitigation scenarios and actions. A baseline serves as the reference period, which the future change in the amount GHG emissions under different scenarios is estimated from. The choice of the baseline period often depends on the availability of required data. This Waste Sector Roadmap uses the year 2005 as the baseline year, because the available dataset for this year is more comprehensive than for other years.
The baseline condition of waste management in Indonesia in 2005 can be divided into (1) waste source condition, (2) waste transportation condition, (3) waste processing condition, (4) reduce, reuse, recycle (3R) condition, and (5) policies and laws.
2.1 Municipal Solid Waste Source Condition
In 2005 Indonesia’s population counted 218.8 million inhabitants (BPS, 2006). The level of waste generation was estimated to be around 0.6 kg/capita/day for urban areas and 0.3 kg/capita/day for rural
areas, resulting in a total amunt of 33.5 Mt of solid waste in 2005. As described in i gure 2.2, solid waste
generation in Indonesia will continue to increase in such way, that in 2030 it will reach a level of 1,2 kg/ capita/day for urban areas and 0.55 kg/capita/day for urban area.
Figure 2.2 Prediction of solid waste generation percapita until 2030
Figure 2.3 Prediction of solid waste generation until 2030
Figure 2.4 and 2.5 show distribution maps of predicted waste generation in Indonesia in 2010 and 2030.
Figure 2.4 Distribution map of waste generation in Indonesia in 2010
Figure 2.5 Distribution map of waste generation in Indonesia in 2030
2.2 Transportation Condition
In Indonesia solid waste originates to approximately 50% in urban areas and 20% in rural areas. It is transported collectively by the Department of Local Solid Waste Management or other appropriate
institutions, which are obligated by the local government (i gure 2.6). Solid waste, which is not transported
by the government, has to be self-managed by the community.
Figure 2.6 Solid waste management condition in Indonesia in 2005
According to the governments’ work plans, solid waste transportation is predicted to increase continuously
is to collect solid waste from the polling station to the landi ll, while urban communities organize the
waste collection from the source (house) to the polling station independently. Such solid waste collection system has many weaknesses, since a large amount of solid waste is not collected and instead thrown away into the drainage channels or rivers. In addition, there are still technical problems associated with equipments and supplies in waste management. Generally, cities and regencies in Indonesia are short of vehicles for collecting and transporting solid waste.
Another important aspect is the source of i nance of domestic solid waste management. In most Indonesian cities i nance originates from the governments’ development budget, in some cases from
offshore loans or from solid waste retribution charged to the waste generator. Since the economic crisis, the income through retribution in the city has been decreasing along with the slackening economic capacity of society/community. It is indeed hard to raise the retribution, considering the still limited economic capacity of society/community.
2.3 Waste Processing Condition
The solid waste transported collectively by the local government is not entirely processed in landi lls as
described in Figure 2.8. The conditions of waste management in Indonesia are represented in Table 2-1 in detail. Based on the research data of the area of Bandung Raya and other secondary information from several places in Indonesia in 2005 (see Tabel 2-1), we found that 1 (a) 3% of anorganic solid waste
was recovered, (b) 1% of organic solid waste was composted, (c) 0.5% of solid waste was burned at the
polling stations and landi lls; 45% ended up in covering open dumping; and 0.5% in covering landi ll
equipped with a sanitary biogas capture.
Some waste are managed by the community themselves with a composition of anorganic solid waste-recovery of 3%, organic solid waste composting of 1%, solid waste burning of 5%, and waste disposal into river channels and open dumping anywhere were 1% and 40%, respectively. Only around 20% of solid waste in rural areas were transported collectively by Governmental organizations, while the remaining 80% were managed by the community.
Table 2.1 Waste Management Condition in Indonesia in 2005
Year 2005 Unit Urban Rural
Waste generated kg/capita/day 0.6 0.3
Increase of waste generated per year % 2.5 1
Waste transported collectively (Ofi ce) % 50 20
Increase of collectively transported waste per year % 2.5 1
Waste managed collectively in 2005:
• Inorganic recovered % 3 0.5
• Organic composted % 1 5.5
• Burned at polling stations and landi lls % 0.5 10
• Covering open dumping % 45 4
• Covering sanitary landi ll + biogas capture % 0.5 0
Total % 50 20
Waste managed by community in 2005:
Inorganic recovered % 3 5
Organic composted % 1 40
Burned % 5 20
Discharged into river channels % 1 5
Hide anywhere % 40 10
Total % 50 80
Source: Damanhuri, 2008
Figure 2.8 shows that of the 50% of solid waste collected and transported in the urban areas, 45% were processed in open dump sites, and the rest were recovered, composted, burned, and processed at
the sanitary landi lls. In addition, from the total of 20% of solid waste collected and transported in rural areas, 10% were burned at the polling stations and landi lls and some were covered at open dump sites,
composted, etc.,
Figure 2.8 Solid waste processing in urban and rural in Indonesia in 2005
Untransported solid waste is self-managed by the community. Figure 2.9 shows the solid waste management activity by urban and rural community.
the sanitary landills. In addition, from the total of 20% of solid waste collected and transported in rural areas, 10% were burned at the polling stations and landills and some were covered at open dump sites,
The system of domestic solid waste management in Indonesia largely depends on the existence of landills. Landills are becoming one of the important issues in handling solid waste due to limited number of landills in Indonesia, which are correctly maintained. Most of the solid waste transported to the landill
is processed through open dumping, and it was estimated that only 10% is processed through a better
system, such as controlled landill. There is only a little protection or monitoring of ground water, so that alkali from waste can contaminate groundwater or the river. In addition, landill foundations are usually
rocky, gravel, or swamp areas, which are very sensitive to water pollution (Damanhuri, 2008). Other
problems are, the refusal of community/society to change their land into landills.
The main reason that open dumping continues to be applied in Indonesia is due to the limited operational
budget. It is very dificult to cover areas with a layer of soil and compact the waste layer by layer with such limited operational budgets. Open dumping causes many problems such as smoke, odor and lies. In many cases, industrial waste and hospital pathogens waste are also found in the landill, although in 1995 the GoI set the 3B criteria for waste landills. Because of the mixing of the waste from various different criterias, the danger posed by landill is growing.
Another serious problem solid waste management using landills is, that landills are still being used when they are already “full”. Attention is only risen, when the landill began to fall or in case of operation
interferences.
2.4 Reduce, Reuse, Recycle (3R) Condition
In general, Solid Waste Management (SWM) in Indonesia is very dependent on the presence of landills/
TPA. Community treatment centers (3R – reduce, reuse, recycle) were formed as a solution to reduce the amount of solid waste. Conditions of reduction, reuse and recycling in 2005 are described in Figure 2.8, Figure 2.9, and Table 2.1 Through the method of 3R, a number of big cities such as Jakarta, Bandung, Surabaya, Medan, Semarang and Yogyakarta began to develop a mid-level processing by composting
and recycling anorganic waste to reduce the amount of solid waste disposed at the landill.. Mid-level processing was built as an attempt to reduce the amount of solid waste disposed to the landill. Until now,
there are only a few mid-level processings, which are professionally managed in Indonesia. One problem was the high price of compost produced compared to the price of inorganic fertilizer, approximately Rp 300 - 400/kg. Indonesia’s anorganic waste is usually recycled by a scavenger. From the economic aspect
of this sector, it provides signiicant economical beneit.
components are usually collected by the informal sector such as a junkman or a scavenger and could be sold to the waste trader/ junk storage.
Other important aspects of domestic solid waste management are recycling and the role of the informal
sector. In Indonesia, there are two main recycle lows. First, the collectors (informal sector), who collect
recycleable material from the generators of the solid waste. Second, these collected materials are separated and recycled by the municipality after the MSW collection. The describes cycle involves housewives, cleaning service, and scavangers.
In developing countries, the level of recycling of anorganic waste is high enough to have a positive impact on the economy of the community. Although the methods employed for sorting and separating solid waste in these countries are still considered inappropriate, the existing methods do not only provide an income stream to hundreds of thousand of people involved in the informal sector, but also ensure that a far greater amount of solid waste is recycled.
2.5 Policies and Laws
Waste management is implemented to improve public health, prevent environmental pollution, and protect clean water resources as stated in Act No. 32/2009 on Environmental Management. Waste management
is speciically regulated in Act No. 18/2008 of Waste Management. Prior to the issue of Act No.18/2008,
the Government Regulation (PP) No.16/2005 has determined the protection of water resources due to
pollution from landill as one of the subjects to focus on. PP No. 16/2005 is a regulation under the Law
of Water Resources (Act No.7/2004).
Act No.18/2008 of Waste Management outlined that solid waste management has to support the (a) reduction and (b) waste handling approach. Solid waste reduction is based on the principle of (a)
restriction (reduce), reuse, and recycle of waste, which is known as the 3R approach. It can be deined as
upstream waste management starting from the effort of how to generate only a minimum amount of waste (reduce) in daily activities. An example for such effort is the change of industrial employment patterns and product packaging, which aims to produce and use environment-friendly packaging with as little volume as possible so that its waste can easily be recycled and handled further. They also outlined to not remain hands-off on the packaging, namely in the form of extended producers responsibility (EPR). To achieve a full implementatin of the 3R approach the involvement of all stakeholders is needed. Solid Waste or the remaining residue has to be further treated professionally through placement, collection, removal, transportation and processing. Residues of these activities must be removed from the environment safely.
Therefore, Act No. 18/2008 outlined that within the irst 5 years after its issuing, open dumping has to be replaced by a better method, such as controlled landill and sanitary landill. Furthermore, the law
Government’s eagerness to promote the 3R approach has signiicantly advanced in Regulation 21/PRT/
M/2006 of the Minister of Public Works. The regulation focuses on 3R as the national strategy and outlines that until 2014, solid waste should be reduced up to 20%2. Targets of the national strategy on
waste management sector are as follows:
1. Support the achievement of service level of solid waste up to 60% in 2010. 2. Support the reduction of solid waste through 3R method up to 20% in 2014.
3. Improve the quality of landill:
- Controlled Landill (CLF) for small and medium-sized cities.
- Sanitary Landill (SLF) for large and metropolitan cities.
- Termination of Open Dumping.
4. Support implementation at institutional level and regional cooperation.
Currently, the implementation of domestic solid waste management at the regional level is conducted by local government regulation, which affects the organization of domestic solid waste management,
retribution fee and transportation cost of solid waste from the source to the landill. The biggest obstacle
lies in the lack of legal power that causes weak implementation of these regulations.
2.6 Future Challenges of Waste Management
Population and economic growth will increase the amount of solid waste volume. The projections of generated domestic solid waste for urban and rural areas from 2005 to 2030 are shown in Figure 2-1. This increasing amount of waste volume will become a serious environmental problem if not well handled. Thus, a good municipal waste management is a must.
Domestic Waste Management (Municipal Solid Waste/MSW) in Indonesia still faces many problems, such as:
• The majority of cities does not have a consistent plan (master plan) in handling solid waste because the Domestic Solid Waste Management still has not formalized;
• Domestic Waste Management has not been given suficient priority in local government regulation,
which limits the budget for solid waste management;
• Facilities for collecting, transportating, and storing the solid waste are limited;
• Most of the landills (TPA) are open dump sites, which cause water pollution, air pollution, and odor.
To solve the mentioned problems, (regency) district/city government as the head of waste management in the (regency) district/city level should increase their waste management revitalitation program. This includes the perfection of waste management institutions, related laws, waste management technical
issues, supporting infrastructure, inancing and investment alternatives, along with increasing the society’s
awareness, culture, and knowledge on better waste management.
In addition, two main policies had at least to be implemented for future waste management. The irst
policy states, that domestic solid waste should be reduced (reduce) as much as possible, used again (reuse),
and recycled (recycle) (3R) before transported to the landill. The second policy outlined, that domestic
waste management should involve public participation. These two policies are used as the basic principles of solid waste management as described in the laws of solid waste. Meanwhile, the active participation of community in the 3R solid waste program starts from the household level by changing the habit of society to be cleaner and healthier. Industrial participation will be achieved by implemented EPR (Extended Producer Responsibility) as the principle for waste producers and hazardous waste importers.
Future waste management must start to calculate waste conversion to energy resources. In addition,
waste management must be integrated in climate change mitigation activities thus creating a co-beneit.
MiTiGATiON
POTENTiAL iN WASTE
SECTOR
3.1 Calculation Method
Greenhouse gases from the waste sector are generally emitted in the form of methane (CH4), produced
from landill and Carbondioxide (CO2) generated from open burning. Emissions from open burning are
more dificult to control than emission from landills. In addition, the burning and recycling of paper
and plastic causes nitrous oxide (N2O) emissions, which equal the 310fold of the impact of the same amount of CO2.
Based on the descriptions in chapter 2, in Indonesia waste is mostly composted, burned, thrown into
rivers, covered, disposed in landills, etc. The amount of greenhouse gases produced varies depending,
which of the mentioned methods is applied. For open burning and natural decomposition, the proportion of waste that can be broken down biologically in Indonesia is higher than in other countries. In the combustion process an aerobic reaction occurs, which produces CO2 without the release of greenhouse gases into the air. CH4 emissions from landills are the result of anaerobic decomposition of organic
components in waste. Waste in landills decomposes slowly and decomposition can last a few decades.
Prior to the development of mitigation strategies for the waste sector, CH4 emissions generated from the
waste need to be calculated. Basically, emissions from landills are calculated using the IPCC First Order
Decay (FOD) model (IPCC, 2006) with the basic equation for estimating CH4 emissions are as follows:
CH4 year t (Gg/year) = ∑x [A ● k ● MSW(t) (x) ● MSW(F) (x) ● Lo (x)) ●e-k(t-x)]
Where
CH4 = CH4 generated in year t, Gg/year
t = year of inventory
x = years for which input data should be added
A = (1-e-k)/k ; normalisation factor which corrects the summation
MSWT(x) = Total municipal solid waste (MSW) generated in year x (Gg/yr) MSWF(x) = Fraction of MSW disposed at SWDS in year x
Lo(x) = Methane generation potential (Gg CH4/Gg waste)
Table 3.1 Emission Factor for Each Activity of Waste Management
Activity Emission Factor Note
1. Waste Transportation
Source: Alisan Smith et al, 2001: Waste management options and climate change, AEA Techno-Environment
0.71 kg CO2/km
The average trip to the landi ll = 50 km per 2.5 ton of waste
2. Waste Degradation in Landi ll
(Calculated based on waste condition in Indonesia: water content, organic carbon level, etc.)
75 kg CH4/ton of waste Emission of good sanitary landi ll can be
captured until 90%.
Plastic 2237 kg CO2/ton
0.05 N2O/ton
6. Other waste management
Waste dumped
To calculate the cost of mitigation, a unit price has to be assumed for operating and waste management unit maintenance as shown in Table 3.2. Emission reduction means the difference between the GHG
emissions generated under the BAU (Business as usual) scenario and a specii c GHG emission reduction
scenario. GHG emissions are presented in units of CO2 equivalent (CO2 eq). The formulas for calculating the emission reduction in CO2 eq are as follows:
The calculation formula of GHG Emissions Reduction (in CO2 eq): Emissions Reduction (in CO2 eq) = BAU emission – ERS emission
BAU = Business as Usual
Table 3.2 Cost for Each Activity of Waste Management
Activity Operating and maintenance cost per Ton Waste
(Indonesia Rupiah) (Approx. in USD Dollar)
1. Transportation 50,000.00 – 60,000.00 5 – 6
2. Sanitary Landi ll 60,000.00 – 100,000.00 6 – 10
3. Open Dumping 10,000.00 – 20,000.00 1 – 2
4. Controlled Landi ll 30,000.00 – 50,000.00 3 – 5
5. Composting 15,000.00 – 20,000.00 1.5 – 2
Source: Damanhuri, 2008
The development of mitigation strategies of greenhouse gas emissions can take place after the process of identifying the amount of emissions and its source is completed. In general, mitigation of greenhouse gas emission can be achieved easiest in a place where the solid waste is accumulated (collected) in high
volume and under anaerobic condition. For solid waste, landi ll is the source of the most signii cant
greenhouse gas release. In addition, GHG emissions are also produced from the transportation of solid
waste to the landi ll, plastic and paper combustion, as well as composting.
In 2015, referring to the MDG’s target, 80% of solid waste in urban areas and 50% in rural areas should
be transported to the landi ll. This can only be achieved via a realistic management plan, which has to be
implemented in the future.
Mitigation costs are calculated based on investment costs and operational/maintenance costs. The interest rate used is 12%/ year. ACERS (Emissions Reduction Scenario Abatement Costs) are calculated based on (Situmeang, 2009):
ACERS =
ACERS = Abatement Costs of the Emissions Reduction Scenario
NPV = Net Present Value
3.2 Utilization of CH4 from Landill into Electrical Energy
In developed countries, landills have become a promising source of electrical energy through the
utilization of CH4 that is emitted. The potential to capture CH₄ and utilize it for electricity generation has never been exploited in Indonesia. However, research has been done within the CDM framework showing that the main obstacle to the implementation of these types of projects is the associated investment cost,
which deems them not proitable.
The selling price of electricity from landills is regulated by the Ministry of Energy and Mineral Resources Regulation No. 31 of 2009, speciically determining the ‘Power Purchase Price by PT PLN (Persero)
from Power Plants Using Small and Medium Scale Renewable Energy or Excess Power’. According to the regulation, PT PLN (Persero) must purchase electricity from power plants using small and medium scale renewable energy technologies with a capacity of up to 10 MW of electricity or excess power from state owned enterprises, local owned enterprises, private enterprises, cooperatives, and governmental organizations to strengthen the system of local electricity supply.
The power purchase price is determined as follows:
a. USD 656/kWh x F, if interconnected on High Voltage; b. USD 1.004/kWh x F, if interconnected on Low Voltage.
F is the location-incentive factor in accordance with the purchase of electricity by PT PLN (Persero) with the following scale:
a. Java and Bali region, F = 1;
b. Sumatra and Sulawesi region, F = 1.2;
c. Kalimantan, West Nusa Tenggara and East Nusa Tenggara region, F = 1.3; d. Maluku and Papua region, F = 1.5.
This Waste Sector Roadmap states that sanitary landill can be supported by laring facilities, while
Table 3.3Landfi ll planing assumptions, fl arring installation, and power generation
Parameter Assumptions
Landfi ll:
1 unit of Landi ll capacity
1 unit of Sanitary Landi ll investment cost 1 unit of Controlled Landi ll investment cost 1 unit of Open Dumping investment cost
Flaring and Power:
CH4 efi ciency Electricity efi ciency
Generated Electricity (per Unit Sanitary Landi ll) Flaring and Electricity facilities investment cost
300 Gg/year 4.000.000 USD 3.000.000 USD 2.000.000 USD
POTENTiAL
MiTiGATiON SCENARiO
AND STRATEGiC iSSUES
Of CLiMATE CHANGE iN
WASTE SECTOR
4.1 Greenhouse Gas Mitigation Scenario of Waste Sector
Potential mitigation scenario projections of the waste sector were made based on Waste Management Act No. 18/2008. As stated in the Act, the efforts to reduce greenhouse gas emissions in the waste sector
are to consist of LFG (landlill gas) recovery either from open dumping land which is to be converted to sanitary landill, or from making new sanitary landills. Efforts to terminate open dumping and build sanitary landill sites with LFG recovery technology in its place are in agreement with the Act, which states
that all open dumping sites should be closed by 2015. Other actions to reduce greenhouse gas emissions are to consist of efforts to reduce solid waste at its source (household), TPS (Polling station), or TPA
(-Landill) using 3R (reduce, reuse, recycle) techniques. The inal proccesing of solid waste in urban and rural areas in Indonesia is to differ. The emphasis in urban areas will be on landill technology (open dumping, controlled landill, sanitary landill), while rural areas will predominantly rely on composting
technology. The 3R method can be applied in both urban and rural areas.
The greenhouse gas mitigation scenarios based on Act No. 18/2008, are as follows:
Urban Area:
1) Open Dumping scenario
This scenario is the closest description to the current situation, which is the use of open dumping as the
inal proccessing method of solid waste in urban areas.
2) Waste Reduction at the source scenario
This scenario applies waste reduction efforts at the source, such as conduct campaigns and capacity building aimed at the reduction of plastic, paper, packaging, etc.
3) 3R and Composting scenario
This scenario applies 3R (reduce, reuse, recycle) in TPS and TPA, and also does composting.
4) Conversion to Sanitary Landill without LFG installation scenario
This scenario converts open dumping to sanitary and controlled landill without the use of CH4 gas from
landill for electricity generation.
5) Conversion to Sanitary Landill and the installation of LFG scenario
This scenario converts open dumping to sanitary landills and makes use of CH 4 gas from landill for
electricity generation.
Rural Area:
being burned and dumped anywhere.
2) Waste reduction at the source scenario
This scenario applies reducing the amount of solid waste at the source. 3) 3R and Composting scenario
This scenario makes use of a combination of composting technology and 3R.
4.2 Greenhouse Gas Mitigation Scenario in Urban Area
The assumptions made for the projection of GHG mitigation scenarios in urban areas are as follows: 1) Business as Usual (BAU) or Open Dumping scenario
This is the projected BAU condition in accordance with population and economic growth. As explained in chapter 2, the open dumping scenario is the current situation in Indonesia. The assumptions made are the following:
• Transportation of solid waste by the government had a 50% service level in 2005. The level of service is expected to increase 1 - 2% per year from 2005 to 80% in 2020, and to 90% in 2030. • Solid waste burning (combustion) in urban areas is collectively transported and is expected
to increase from 0.5% in 2005 to 0.8% in 2020, and 0.9% in 2030. Self-managed solid waste burning on the other hand, is expected to decrease from 24% in 2005 to 4.8% in 2030. • The proportion of solid waste generation that is self-managed by the community and dumped
anywhere was 25% in 2005 and is expected to decrease to 5% in 2030. Solid waste dumped in rivers was 1% in 2005 and is expected to decrease to 0.2% in 2030.
• The proportion of solid waste that is openly dumped in urban areas was about 49.5% in 2005, and is expected to increase to 89.10% in 2030.
2) Waste Reduction at the Source Scenario
• The assumptions made in relation to the transportation of solid waste are similar to those made for the BAU scenario: service levels were at 50% in 2005 and are expected to increase 1 – 2% per year from 2005 to 2020, reaching 80% in 2020 and 90% in 2030.
• Solid waste generation of urban areas increased from 0.6 kg/ person/ day in 2005 to 1.1 kg/person/day in 2030. Increases in solid waste generation can be minimized by reducing domestic solid waste at its source so that solid waste generation per capita decreases by
Figure 4.1 Urban waste generation per capita in Source Reduction Scenario
3) 3R and Composing scenario
• The assumptions made in relation to the transportation of solid waste are similar to those made for the BAU scenario: service levels were at 50% in 2005 and are expected to increase 1 – 2% per year from 2005 to 2020, reaching 80% in 2020 and 90% in 2030.
• The proportion of solid waste which is collectively transported (by government) for composting was 2.5% in the year 2005 and is expected to increase to 4.5% in 2030. The proportion of self-managed (by local community) composted solid waste on the other hand was 5% in 2005, and is expected to decrease to 1% in 2030.
• Collectively transported recycled plastic waste is expected to increase from 2.5% in 2005 to 4% in 2020, reaching 4.5% in 2030. The proportion of self-managed recycled plastic waste was 5% in 2005 and is expected to decrease to 1% in 2030.
• Collectively transported recycled paper waste is expected to increase from 2.5% in 2005 to 4.5% in 2030, while self-managed recycled paper waste is expected to decrease from 5% in 2005 to 1% in 2030.
Figure 4.4 Projection of % waste processing by Local Community in 3R and Composting Scenario in Urban areas
4) Sanitary Landi ll without LFG installation
• The assumptions made in relation to the transportation of solid waste are similar to those made for the BAU scenario: service levels were at 50% in 2005 and are expected to increase 1 – 2% per year from 2005 to 2020, reaching 80% in 2020 and 90% in 2030.
• The conversion of open dumping to sanitary landi ll is expected to increase the proportion of solid waste that is brought to sanitary landi lls from 0.5% in 2005 to 2.4% in 2010,
reaching 56% in 2020 and 63% in 2030.
• The proportion of waste processed in controlled landi ll was 4% in 2005 and is expected
Figure 4.5 Projection of % waste processing by Local Government in SL+CL Scenario in Urban areas
5) Sanitary Landi ll with LFG Installation Scenario
• The assumptions made in relation to the transportation of solid waste are similar to those made for BAU scenario,: service level s were at 50% in 2005 and are expected to increase 1 – 2% per year from 2005 to 2020, reaching 80% in 2020 and 90% in 2030.
• The conversion of open dumping to sanitary landi ll is expected to increase the proportion of solid waste brought to sanitary landi lls from 4.5% in 2005, to 79.2% in 2020 and 89.10%
in 2030.
• Sanitary landi lls are equipped with LFG (Landi ll Gas) capture technologies, so an estimate
on the potential revenue for each kWh generated has been made.
Figure 4.8 Projection of % waste processing by Local Community in SL+LFG Scenario in Urban areas
4.3 Greenhouse Gas Mitigation Scenario in Rural Area
1) Open Dumping and Open Burning Everywhere Scenario
• Solid waste burning (combustion) in urban areas that has been collectively transported is expected to increase from 12% in 2005 to 19.5% in 2030, while the proportion of self-managed solid waste burning (combustion) is expected to decrease from 40% in 2005 to 33.75% in 2030.
Figure 4.9 Projection of % waste processing by Local Government in BAU Scenario in Rural
2) Source Reduction Scenario
• The assumptions made in relation to transportation are similar to those made for the burning and dumping anywhere scenario: solid waste burning (combustion) in urban areas which is collectively transported is expected to increase from 12% in 2005 to 19.5% in 2030. The proportion of self-managed solid waste burning (combustion) is expected to decrease from 40% in 2005 to 33.75% in 2030
• Rural waste generation per capita is expected to increase from 0.3 kg/capita/day in 2005 to 0.5 kg/capita/day in 2030.
Figure 4.10Projection of % waste processing by Local Community in BAU Scenario in Rural
Figure 4.12 Projection of waste generation in Source Reduction Scenario in Rural compared with BAU
3) 3R and Composting
• The assumptions made for transportiation are similar to those made in the burning and dumping anywhere scenario: solid waste burning (combustion) in urban areas which is collectively transported is expected to increase from 12% in 2005 to 19.5% in 2030. The proportion of self-managed solid waste burning (combustion) is expected to decrease from 40% in 2005 to 33.75% in 2030.
• The proportion ofsolid waste generation that is collectively transported for composting was 5.5% in the year 2005 and is expected to increase to 19.3% in 2030, while self-managed composted solid waste was 28% in 2005 and is expected to decrease to 10.5% in 2030. • The proportion of collectively transported recycled plastic waste is expected to increase
from 1% in 2005 to 3.5% in 2030, while self managed recycled plastic waste was 4% in 2005 and is expected to decrease to 1.5% in 2030.
4.4 Calculation Result of GHGs Scenario for Mitigation on Waste Sector
Figure 4.13 shows the results of the calculation of GHG emissions from the waste sector. The largest proportion of emissions are generated by the BAU (open dumping) scenario, followed by the other
scenarios. The reduction at the source scenario does not decrease GHG emissions signii cantly due to
the limited campaign activities and capacity building that are included. Economic progress might trigger the society to continue to increase the amount of solid waste. Reduction at the source scenario can be successful if it is supported by policies and legislation that follow up with sanctions.
The SL + CL (conversion from open dumping to a Sanitary Landi ll and Controlled Landi ll) scenario
results in higher GHG emissions than the 3R (reduce, reuse, recycle) and composting scenario due to the fact that processing of solid waste in SL and CL increases the anaerobic process that is responsible for CH4 generation; nevertheless, its emissions are not as high as that of the open dumping scenario. The process of aerobically composting solid waste does not produce CH4, however 3R activities, such as processing and recycling of plastic, do produce emissions in the form of CO2 from the combustion process associated with recycling. The SL + LFG scenario has the smallest proportion of emissions due
to the l aring (combustion) of CH4 into CO2 and H2O, and its use of CH4 for electricity generation.
Figure 4.13 GHG emissions (in Gg CO2 eq) in urban areas for every scenario
suitable for composting, (2) composting activities in rural areas will grow rapidly because land is still widely available, (3) a market is available, as the main users of compost is the agricultural sector and plantation farmers, (4) compost can improve soil quality, (5) composting technology is relatively simple, so it is easy to carry out by villagers. The biggest obstacles to using organic fertiliziser are perceived problems associated with farmers’ practice of using chemical fertilizers. Thus, it is necessary to make farmers aware of the detrimental effect that the use of chemical fertilizers have on the quality of the soil in the long run. Another problem is that organic fertilizer requires a relatively long time to be produced. This problem can be tackled by developing a special bacteria to speed up the associated process. Hence, the development of biotechnology related to composting should be developed in line with efforts to increase the uptake of of organic fertilizer use.
Figure 4.14 GHG emissions (in Gg CO2 eq) in rural areas for every scenario
Figure 4.15 and 4.16 shows GHG emission reductions from each scenario. Emission reduction is calculated by the following formula:
Emissions Reduction = BAU’s Emissions- Scenarios’ Emissions
Figure 4.15 GHG emission reduction (in Gg CO2 eq) in urban areas for every scenario
Figure 4.17 shows the cost of waste management. Figure 4.18 shows the cost of mitigation, namely a certain waste management costs reduced by BAU’s scenario costs.
Figure 4.19 Waste Managementcost in rural areas for every scenario
Table 4.1 Comparison Matrix of GHG Emission Mitigation Scenario from Waste Sector in Indonesia for Urban Areas. development policies of source reduction regulation in solid waste, supported by applied technology research and development with an environmental perspective.
2010 – 2030 45.14 0.13 2.90 11.30%
3R +
Composting 2010 – 2020 143.56 0.16 1.14 37.32% (1) Carry out an inventory study of GHG from the waste sector which is comprehensive and reliable, accompanied by a systematic GHG reduction plan. (2) Develop and implement environmental policies that support the principle of 3R (reduce, reuse, recycle) and composting in waste management. (3) Develop and establish a 3R and composting center in every city/regency in Indonesia.
2010 – 2030 211.17 0.33 1.57 35.58%
SL + CL 2010 – 2020 28.94 0.96 33.34 7.07%
(1) Carry out an inventory study of GHG from the waste sector, which is comprehensive and reliable, accompanied by a systematic GHG reduction plan. (2) Apply infrastructure
development policies of conversion of open dumping to sanitary and controlled landi ll,
supported by applied technology research and development with an environmental
perspective. (3) Apply waste management in the TPA (i nal disposal) from open dumping to controlled landi lls in small and medium-sized cities; and sanitary landi lls in large and
metropolitan cities.
(1) Carry out an inventory study of GHG from the waste sector, which is comprehensive and reliable, accompanied by a systematic GHG reduction plan. (2) Apply infrastructure
development policies of conversion from open dumping to sanitary landi ll, and install LFG
electricity generators, supported by applied technology research and development with an environmental perspective. (3) Waste management in the TPA from open dumping to sanitary
landi lls (4) Improved methods of waste gas management (landi ll gas - LFG) through
collection and combustion, as well as the application of energy to electricity
2010 – 2030 243.67 2.27 9.33 43.46%
ICCSR -
WaSte SeCtoR
Table 4.2 Comparison Matrix of GHGs Emission Mitigation Scenario from Waste Sector in Indonesia for Rural Areas.
Scenarios Period
Emission Reduction Accumulation
(Mt CO2)
Total Cost of Mitigation (billion USD)
Abatement Cost (USD/
t CO2)
Emission Reduction Compared
to BAU (%)
Policies Required
Source Reduction 2010 – 2020 27.81 0.04 1.56 15.15% (1) Carry out an inventory study of GHG from the waste sector which is comprehensive
and reliable, accompanied by a systematic GHG reduction plan. (2) Apply infrastructure development policies related to source reductions in the waste sector, supported by applied technology research and development with an environmental perspective, (3) Apply source reduction policy
2010 – 2030 43.66 0.05 1.17 20.02%
3R + Composting
2010 – 2020
2010 – 2030
50.40
64.14
0.81
1.23
16.10
19.23
24.76%
22.41%
(1) Carry out an inventory study of GHG from the waste sector, which is comprehensive and reliable, accompanied by a systematic GHG reduction plan. (2) Apply infrastructure development policies of 3R and composting regulation, supported by applied technology research and development with an environmental perspective. (3) Implement the 3R principle (reduce, reuse, recycle) in waste management. (4) Develop and establish a 3R and composting center in every city/regency in Indonesia.
ICCSR -
WaSte SeCtoR
4.5 Calculation of Abatement Cost
Mitigation costs are calculated based on investment costs and operational/maintenance costs. The interest rate here is 12% / year. ACERS (Emissions Reduction Scenario Abatement Costs ) are calculated based on (Situmeang, 2009):
ACERS =
ACERS = Emissions Reduction Scenario Abatement Costs
NPV = Net Present Value
ERS = Emission Reduction Scenario
To calculate Abatement Costs, both Mitigation Costs and Emission Reductions arecalculated according to the NPV method; the results of the calculation are as follows:
Figure 4.22 Calculation ofNPV for Emision Reductions (in tons CO2 eq) for each scenario in rural areas
Figure 4.24 Calculation ofNPV for Mitigation Costs (in USD) for each scenario in rural areas