AUTHORS
Indonesia Climate Change Sectoral Roadmap - ICCSR Water Resources Sector Report
Adviser
Prof. Armida S. Alisjahbana, Minister of National Development Planning/Head of Bappenas
Editor in Chief
U. Hayati Triastuti, Deputy Minister for Natural Resources and Environment, Bappenas
ICCSR Coordinator
Edi Effendi Tedjakusuma, Director of Environmental Affairs, Bappenas
Editors
Irving Mintzer, Syamsidar Thamrin, Heiner von Luepke
Synthesis Report
Coordinating Author for Adaptation: Djoko Santoso Abi Suroso
Water Resources Sector Report
Authors: Oman Abdurrahman, Budhi Setiawan
Technical Supporting Team
Chandra Panjiwibowo, Edi Riawan, Hendra Julianto, Ursula Flossmann-Kraus
Administrative Team
ACKNOWLEDGMENTS
The Indonesia Climate Change Sectoral Roadmap (ICCSR) is meant to provide inputs for the next ive
year Medium-term Development Plan (RPJM) 2010-2014, and also for the subsequent RPJMN until 2030, laying particular emphasis on the challenges emerging in the forestry, energy, industry, agriculture, transportation, coastal area, water, waste and health sectors. It is Bappenas’ policy to address these challenges and opportunities through effective development planning and coordination of the work of all line ministries, departments and agencies of the Government of Indonesia (GoI). It is a dynamic document and it will be improved based on the needs and challenges to cope with climate change in the future. Changes and adjustments to this document would be carried out through participative consultation among stakeholders.
High appreciation goes to Mrs. Armida S. Alisyahbana as Minister of National Development Planning /Head of the National Development Planning Agency (Bappenas) for the support and encouragement. Besides, Mr. Paskah Suzetta as the Previous Minister of National Development Planning/ Head of Bappenas who initiated and supported the development of the ICCSR, and Deputy Minister for Natural Resources and Environment, Ministry of National Development Planning /Bappenas, who initiates and coordinates the development of the ICCSR.
To the following steering committee, working groups, and stakeholders, who provide valuable comments and inputs in the development of the ICCSR Water Resources Sector document, their contributions are highly appreciated and acknowledged:
Steering Committee (SC)
Deputy of International Cooperation, Coordinating Ministry for Economy; Secretary of Minister, Coordinating Ministry for Public Welfare; Deputy of Demography, Health, and Environment, Coordinating Ministry of Public Welfare; Secretary General, Ministry of Public Works; Deputy of Economy, Deputy of Infrastructures, Deputy of Development Funding, Deputy of Human Resources and Culture, Deputy of Regional Development and Local Autonomy, National Development Planning Agency; and Chief of Secretariat of the National Council for Climate Change.
Working Group
Ministry of Environment
Sulistyowati, Haneda Sri Mulyanto, Dadang Hilman, Upik S. Aslia, Agus Gunawan, Yulia Suryanti
Ministry of Public Works
Djoko Murjanto, Mochammad Amron, Susmono, A. Hasanudin, Djoko Mursito, Handy Legowo, Setya
Rindy Farrah, Yuke Ratnawulan, Zubaidah. K, Savitri. R
National Development Planning Agency
Sriyanti, Yahya R. Hidayat, Bambang Prihartono, Mesdin Kornelis Simarmata, Arum Atmawikarta, Montty Girianna, Wahyuningsih Darajati, Basah Hernowo, M. Donny Azdan, Budi Hidayat, Anwar Sunari, Hanan Nugroho, Jadhie Ardajat, Hadiat, Arif Haryana, Tommy Hermawan, Suwarno, Erik Amundito, Rizal Primana, Nur H. Rahayu, Pungki Widiaryanto, Maraita, Wijaya Wardhana, Rachmat Mulyanda, Andiyanto Haryoko, Petrus Sumarsono, Maliki
Grateful thanks to all staff of the Deputy Minister for Natural Resources and Environment, Ministry of National Development Planning/ Bappenas, who were always ready to assist the technical facilitation as
well as in administrative matters for the inalization process of this document.
Remarks from Minister of National
Development Planning/Head of bappenas
We have seen that with its far reaching impact on the world’s ecosystems as well as human security and development, climate change has emerged as one of the most intensely critical issues that deserve the attention of the world’s policy makers. The main theme is to avoid an increase
in global average temperature that exceeds 2˚C, i.e. to reduce annual
worldwide emissions more than half from the present level in 2050. We believe that this effort of course requires concerted international
response – collective actions to address potential conl icting national
and international policy initiatives. As the world economy is now facing
a recovery and developing countries are struggling to fuli ll basic needs
for their population, climate change exposes the world population to exacerbated life. It is necessary, therefore, to incorporate measures to address climate change as a core concern and mainstream in sustainable development policy agenda.
We are aware that climate change has been researched and discussed the world over. Solutions have been proffered, programs funded and partnerships embraced. Despite this, carbon emissions continue to increase in both developed and developing countries. Due to its geographical location, Indonesia’s
vulnerability to climate change cannot be underplayed. We stand to experience signii cant losses. We will face – indeed we are seeing the impact of some these issues right now- prolonged droughts, l ooding and
increased frequency of extreme weather events. Our rich biodiversity is at risk as well.
Those who would seek to silence debate on this issue or delay in engagement to solve it are now marginalized to the edges of what science would tell us. Decades of research, analysis and emerging environmental evidence tell us that far from being merely just an environmental issue, climate change will touch every aspect of our life as a nation and as individuals.
Regrettably, we cannot prevent or escape some negative impacts of climate change. We and in particular the developed world, have been warming the world for too long. We have to prepare therefore to adapt to the changes we will face and also ready, with our full energy, to mitigate against further change. We
have ratii ed the Kyoto Protocol early and guided and contributed to world debate, through hosting
planning and priority setting.
I am delighted therefore to deliver Indonesia Climate Change Sectoral Roadmap, or I call it ICCSR, with the aim at mainstreaming climate change into our national medium-term development plan.
The ICCSR outlines our strategic vision that places particular emphasis on the challenges emerging in the forestry, energy, industry, transport, agriculture, coastal areas, water, waste and health sectors. The content of the roadmap has been formulated through a rigorius analysis. We have undertaken vulnerability assessments, prioritized actions including capacity-building and response strategies, completed by
associated inancial assessments and sought to develop a coherent plan that could be supported by line
Ministries and relevant strategic partners and donors.
I launched ICCSR to you and I invite for your commitment support and partnership in joining us in realising priorities for climate-resilient sustainable development while protecting our population from further vulnerability.
Minister for National Development Planning/ Head of National Development Planning Agency
Remarks from Deputy Minister for Natural
Resources and Environment, bappenas
To be a part of the solution to global climate change, the government of Indonesia has endorsed a commitment to reduce the country’s GHG emission by 26%, within ten years and with national resources, benchmarked to the emission level from a business as usual and, up to 41% emission reductions can be achieved with international support to our mitigation efforts. The top two sectors that contribute to the country’s emissions are forestry and energy sector, mainly emissions from deforestation and by power plants, which is in part due to the fuel used, i.e., oil and coal, and part of our high energy intensity.
With a unique set of geographical location, among countries on the Earth we are at most vulnerable to the negative impacts of climate
change. Measures are needed to protect our people from the adverse effect of sea level rise, l ood,
greater variability of rainfall, and other predicted impacts. Unless adaptive measures are taken, prediction tells us that a large fraction of Indonesia could experience freshwater scarcity, declining crop yields, and vanishing habitats for coastal communities and ecosystem.
National actions are needed both to mitigate the global climate change and to identify climate change adaptation measures. This is the ultimate objective of the Indonesia Climate Change Sectoral Roadmap, ICCSR. A set of highest priorities of the actions are to be integrated into our system of national development planning. We have therefore been working to build national concensus and understanding of climate change response options. The Indonesia Climate Change Sectoral Roadmap (ICCSR) represents our long-term commitment to emission reduction and adaptation measures and it shows our ongoing, inovative climate mitigation and adaptation programs for the decades to come.
Deputy Minister for Natural Resources and Environment National Development Planning Agency
TAbLE Of CONTENTS
Table of Contents vii
List of Figures x
List of Tables xii
List of Abbreviations xiii
1. Introduction 1
1.1 Background 1
1.2 Objectives 2
1.3 Approach 3
1.3.1 The Scientiic Basis of the Roadmap 3
1.3.2 Stakeholder consultation process 5
1.4 Summary 6
2. Conditions, Problems, and Challenges in the Water Resource Sector 8
2.1 Current Conditions and Challenges in Water Resource Sector 8
2.1.1 Supply, Demand Distribution and Time of Water Resource 8
2.1.2 Water Quality 10
2.1.3 Flood 10
2.1.4 Drought 11
2.1.5 Other conditions and problems related to water resources 11
2.2 Current Capacities 12
2.2.1 Response to Climate Change 12
2.2.2 Policies in connection with climate change 13
2.3 Speciic Challenges to the Water Resource Sector in relation to Climate Change 13
2.3.1 Direct Impacts of Climate Change 13
2.3.3 Strategic Issues for the Water Resources Sector in Relation with Climate Change 23
2.4 Concluding Remarks 25
3. Vulnerability of Water Sector against Climate Change 28
3.1 Identify the Vulnerability Components 28
3.2 Overview of Water Sector Vulnerability 30
3.2.1 Vulnerability due to data resource and research 31
3.2.2 Vulnerability to Shortage of Water Supply 31
3.2.3 Vulnerability to Floods 33
3.2.4 Vulnerability to Drought 35
3.2.5 Vulnerability to Landslides 37
3.2.6 Vulnerability to Seawater Intrusion 38
3.3 Unassessed Important Vulnerability Components 39
3.4 Reliability Level of Vulnerability Study 39
3.4.1 Sumatera Region 40
3.4.2 Java-Bali 41
3.4.3 Kalimantan Region 42
3.4.4 Sulawesi 42
3.4.5 Nusa Tenggara Islands 43
3.4.6 Mollucas Islands 44
3.4.7 Papua Region 44
3.5 Cross-cutting Vulnerability Issues 44
3.5.1 Cross-cutting Information 44
3.5.2 Future research is needed 45
3.6 Concluding Remark 45
4. Potential Climate Change Impact on the Water Resource Sector 49
4.1.1 Water Supply Shortage Risk 49
4.1.2 Flood risk 51
4.1.3 Drought Risk 52
4.1.4 Landslide risk 54
4.1.5 Seawater Intrusion risk 55
4.2 Climate Change Risk by Region 55
4.2.1 Sumatra Region 55
4.2.2 Java-Bali Region 57
4.2.3 Kalimantan Region 58
4.2.4 Sulawesi Region 59
4.2.5 Nusa Tenggara Islands Region 59
4.2.6 Maluku Island Region 60
4.2.7 Papua Region 61
4.3 Concluding Remark 61
5. Mainstreaming Climate Change into the National
Development Programme: Policies for the Water Sector 65
5.1 Long-term National Development Planning in the Water Resource Sector 2010-2030 65
5.1.1 Policy Recommendations for Adaptation for the period 2010 - 2030 67
5.2 Medium National Development Planning in water resource sector 69
5.2.1 Stage I (2010-2015) 69
5.2.2 Stage II (2015-2020) 70
5.2.3 Stage III (2021-2025) 70
5.2.4 Stage IV (2026-2030) 70
5.3 Summary 71
References 73
LiST Of fiGURES
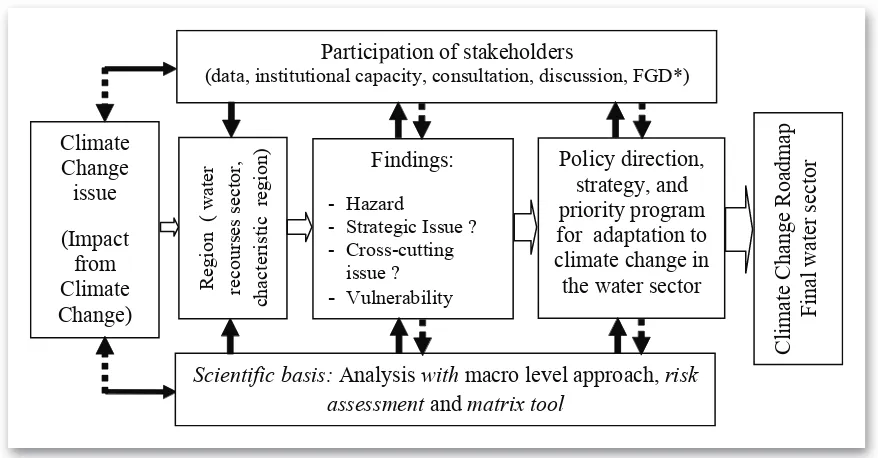
Figure 1.1 Framework on building a Roadmap on Climate Change, involving
scientiic basis analysis, regional diversity and cross-cutting issues. 2
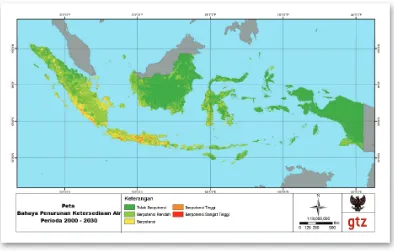
Figure 2.1 Water supply shortage hazards, SRA2 2000-2030 period 15
Figure 2.2 Model of rainfall change during normal condition in 30 years at Maluku region
(left) and North Sumatera and Northern Middle (right) 15
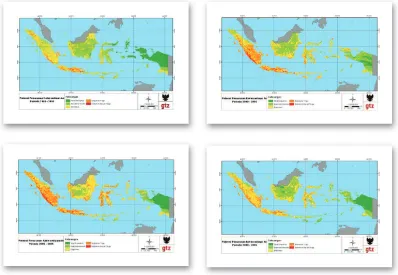
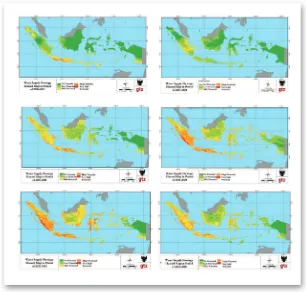
Figure 2.3 Water supply shortage risk, SRA2, from top left clockwise: 2010-2015 period,
2015-2020, 2020-2025, and 2025-2030 16
Figure 2.4 Flood hazard, SRA2 2000-2030 period 17
Figure 2.5 Model of rainfall change during above normal condition in 30 yearly periods for
Java-Bali (upper left), Kalimantan (upper right), Papua (lower right)
and Sumatera (lower left) 18
Figure 2.6 Flood risk, SRA2, from top left clockwise: 2010-2015 period, 2015-2020,
2020-2025, and 2025-2030 18
Figure 2.7 drought hazard, SRA2 2000-2030 period 19
Figure 2.8 Model of rainfall change (left) and temperature change (right) under
normal for 30 years in Sumatera (upper), Java-Bali (middle) and Nusa Tenggara (lower) 20
Figure 2.9 Drought risk, SRA2, from top left clockwise: 2010-2015 period,
2015-2020, 2020-2025, and 2025-2030 21
Figure 2.10 Landslide hazard, SRA2 2000-2030 period 21
Figure 2.11 Model rainfall change during above normal condition in 30 years for
Sumatera (upper left), Java-Bali (upper right), Sulawesi (lower right) and Papua (lower left) 22
Figure 2.12 Landslide risk, SRA2, from top left clockwise: 2010-2015 period,
Figure 3.1 Map of vulnerability to water supply shortage, from left clockwise:
2010-2015 period, 2015-2020, 2020-2025, and 2025-2030 32
Figure 3.2 Map of vulnerability to loods ,from left clockwise: 2010-2015 period,
2015-2020, 2020-2025, and 2025-2030 34
Figure 3.3 Map of vulnerability to drought, from left clockwise: 2010-2015 period,
2015-2020, 2020-2025, and 2025-2030 36
Figure 3.4 Map of vulnerability to landslide, from left clockwise: 2010-2015 period,
2015-2020, 2020-2025, and 2025-2030 37
Figure 4.1 Water supply shortage risk, SRA2, from top left clockwise:
2010-2015 period, 2015-2020, 2020-2025, and 2025-2030 50
Figure 4.2 Water supply (left) and water demand (right) per area 51
Figure 4.3 Flood risk, SRA2, from top left clockwise: 2010-2015 period,
2015-2020, 2020-2025, and 2025-2030 52
Figure 4.4 Drought risk, SRA2, from top left clockwise: 2010-2015 period,
2015-2020, 2020-2025, and 2025-2030 53
Figure 4.5 Landslide risk, SRA2, from top left clockwise: 2010-2015 period,
LiST Of TAbLES
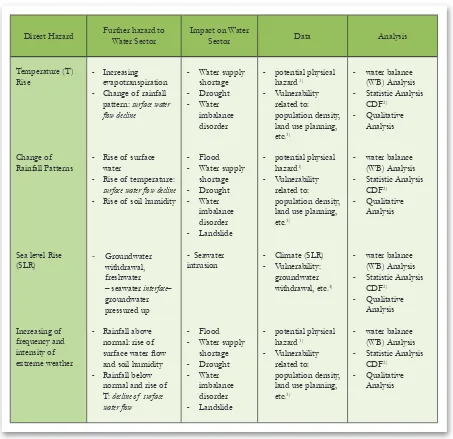
Table 1.1 Matrix containing risks and impacts of climate change on the water sector 4
LiST Of AbbREviATiONS
AC Adaptive Capacity
ANI Indonesian National Atlas
Bappenas National Development Planning Agency
Bakosurtanal National Coordinating Agency for Surveys and Mapping
BMKG Meteorology, Climatology, and Geophysics Agency
BWS River Basin Agency
CAT Conined Aquifer
CH Rainfall Pattern
CDF Commulative Frequency Distribution
DAS Water Source Area
Depkes Ministry of Health
DESDM Ministry of Enegy and Mineral Resources
DRO Direct Run Off
EE Extreme Event
DPU Ministry of Public Work
FGD Forum Group Discussion
GIS Geography Information System
GHG Grenhouse Gasses
GNRHL National Action on Forest and Land Rehabilitation
GTZ Germany Deutsche Gesellschaft für Technische Zusammenarbeit
IPCC Intergovernmental Panel on Climate Change
IPCC AR4 Intergovernmental Panel on Climate Change The Fourth Assessment Report
MPW Ministry of Public Work
NOAA National Oceanic and Atmospheric Administration
PD Population Density
PKA Water Supply Shortage
PLG Centre for Geological Environment
Prokasih Clean River Program
RPI Roadmap for Climate Change
RPJP Long-Term Development Plan
RPJPN National Long-Term Development Plan
RPJPD Local Long-Term Development Plan
RPJMN National Medium-Term Development Plan
RPJMD Local Medium-Term Development Plan
RTRN National Spatial Planning
RTRD Local Spatial Planning
SDA Water Resources
SLR Sea Level Rise
SRES Special Report on Emissions Scenarios
SST Sea Surface Temperature
SWS Water Capture Area
TRO Total Run-off
UNFCCC United Nation Framework Convention on Climate Change
iNTRODUCTiON
1.1 Background
As stated in the Long-Term Development Plan (RPJP) 2005-2025, sustainability of development will face challenges of climate change. To elaborate this vision, there is an urgent need to develop a roadmap for mainstreaming climate change into Indonesia’s national development plan (hereinafter referred to as “Roadmap on Climate Change” or simply “the Roadmap”). The Roadmap looks out over a time frame of 20 years (2010-2029). Priority activities proposed in the Roadmap are outlined in four phases of RPJMN. Hence, it is timely well suited to integrate activities of the Roadmap into the RPJMN 2010-2014. Subsequently, the Roadmap will be considered in formulating the strategic plans of each ministry and agency.
The Roadmap recognizes that, because of its diversity along physical, economic, political, and cultural dimensions, regional approaches are essential for development planning in Indonesia. The proposed
policy response to climate change has been tailored to the speciic characteristics of the main regions:
Sumatra, Jamali (Jawa, Madura, Bali), Kalimantan, Sulawesi, Nusa Tenggara, Maluku, and Papua.
Following the international convention, responses to climate change in the Roadmap consist of two groups of measures (i.e. mitigation and adaption) that can be implemented in Indonesia. Mitigation involves taking action to reduce greenhouse gas emissions and to enhance carbon sinks so as to reduce the risks of future global warming. Adaptation refers to the deployment of technology and institutional responses in Indonesia that can reduce the damages due to impacts of climate change by raising awareness and increasing the resilience of Indonesian society at both the national and local level .
The water sector is one of the most important sectors of Indonesian society and needs to be taken into account in creating the Roadmap on Climate Change. Most responses to climate change in the water sector are considered as part of the portfolio of adaptive responses. However, some activities and programs in the water sector could also contribute to mitigation; other activities and programs are
recommended as cross-cutting initiatives. This Roadmap is built on the foundation of scientiic analysis
Figure 1.1 Framework on building a Roadmap on Climate Change, involving scientii c basis analysis,
regional diversity and cross-cutting issues.
Notes : analysis, : feedback ; : output ; *FGD : focus group discussion
1.2 Objectives
The objectives of formulating a Roadmap on Climate Change for the water sector are as follows:
1. To identify current condition and problems as well as future challenge in the water sector in connection with climate change;
2. To identify the vulnerabilities in the water sector against climate change based on the identii ed
threats.
3. To identify impacts or risks on water resource after its vulnerability has been identii ed and develop
strategic issues, including cross-sectoral issues such as water and health, water and foresty, etc.
4. To identify and formulate policies and measures to integrate the adaptation in water resource sector foward climate change. The purpose consists of: a) a 20 years of long-term policy (2010-2030), b) to integrate the policy and programs into the National Medium Term Development Planning, c) Cross-cutting issues; and
5. To identify other necessary and signii cant aspects such as uncertainty factors, information validity
level, and need for further research.
Climate
1.3 Approach
1.3.1 The Scientiic Basis of the Roadmap
The steps used in building the roadmap are as follows:
1. Identiication of the problem, existing capacities and future challenges, including what kind of analytic approach to be used, the exploration of speciic conditions and problems, authorities’
and current institutional capacities for adaptive responses in the water sector, as well as future challenges;
2. Identiication of relevant climate impacts, including direct threats such as increase of temperature,
change of rainfall patterns, increasing frequency and intensity of extreme weather events and sea level rise. Focus on additional threats and impacts to the water sector such as: water supply shortage,
loods, droughts, landslides, and seawater intrusion;
3. Identiication of key vulnerabilites in the water sector. Vulnerability is deined as a function of
the character, magnitude, and rate of climate change as well as the degree of variation to which a system is exposed, its sensitivity, and its adaptive capacity (Affeltranger, et al, 2006 as quoted in Suroso, D.S, 2008);
4. Analysis and evaluation of risks and impacts. Risk is determined by analyzing threats and vulnerability
quantitatively as well as qualitatively. Strategic issues are important to indings of the study as the
primary basis of political decision making .
5. Finding a sound adaptation strategy and mainstreaming of such strategy into the national development plan through the implementation of priority policies and programs.
An ideal scientiic study should be based on the risk assessment framework, which can be described in
the following notation: R = H x V; and V = (E x S)/AC (Affeltranger, et al, 2006 as quoted in Suroso, D.S., 2008).
In this notation, R represents risks, H represents hazards V represents vulnerability. E represents exposure, S represents sensitivity, and AC is adaptive capacity for coping with the hazard or risks. But as this study
has been conducted at the macro level with signiicant time and data constraints, the risk assessment
framework is applied only in principle. For the next analysis, a matrix with detailed regional mapping of threats, vulnerabilities, risks or impacts, and detailed recommendations for adaptation strategy and program recommendation (Attachment 1-2) will be used.
Table 1.1 Matrix containing risks and impacts of climate change on the water sector
Notes:1)potential physical hazard, among others: temperature and rainfall; land-use planning data related to hazard; 2)CFD : cumulative frequency distribution; 3) see Attachment 1-2.
Furthermore, for each hazard vulnerability assessment is undertaken prior to the impact identii cation
(Chapter 3 and Attachment 1-2).
1.3.2 Stakeholder consultation process
Klimatologi, Meteorologi dan Geoisika/ (BKMG);and others. The participatory process of stakeholder
engagement in building the roadmap involved various activities and programs, including among others:
1. Early Consultation and introduction session for all Adaptation programs, with task-force led by Bappenas (Bappenas, Jakarta, 11 January 2009);
2. Kick-off meeting, attended by all representatives of National Council for Climate Change (Hotel Borobudur, Jakarta, 27 January 2009);
3. FGD for climate sector (Hotel Parklane, Jakarta; 4 February 2009);,
4. Consultation Pre-FGD I (Water Sector and Waste Management); preparatory for FGD’s material and technical implementation in collaboration with discussant, Mr. Mochammad Amron, from Ministry of Public Works (DPU (Ministry of Public Works), Jakarta, 7-8 February 2009);
5. FGD I on Water and Waste Management sector, with discussants from Ministry of Public Works, Climatology, Meteorology and Geophysics Body, Ministry of Forestry, and other participants from related sectors (Bappenas, Jakarta, 24 February 2009);
6. Participation in FGD I on Agriculture sector (Ministry of Agriculture, Jakarta);
7. Participation in FGD I on Health sector (Bappenas, Jakarta);
8. Participation in FGD I on Industrial sector (Hotel Borobudur Jakarta);
9. In collaboration with Dr. Irving Mintzer, an unstructured in-depth interview with DPU (Ministry of Public Works) was conducted in Jakarta, 20 March 2009).
10. Pre-FGD II on Water and Waste Management sector; discussion and consultation for FGD II (Ministry of Public Works), Jakarta, 6 April 2009);
11. Discussion with Directorate General of River Basin, Ministry of Forestry (Ministry of Forestry, Jakarta, 16 April 2009);
12. Preparatory conference for FGD III on Health sector (Ministry of Public Works), Jakarta, 29 April – 1 May 2009;
13. Participation in FGD III on Health sector (Ministry of Health, Jakarta, 1 May 2009):
14. FGD II on Water and Waste Management sector, clariication on roadmap of climate change in
water and waste management sector matrix(Ministry of Public Works; Jakarta, 6 May 2009);
15. Personal communication with experts on ground water from PLG and landslide, Geological Body (Geological Body, Bandung, April 2009).:
17. FGD evaluation by Bappenas and sector (Bappenas, Jakarta, 25 May 2009);
18. Inter-sectoral FGD, (Hotel Niko, Jakarta, 17 June 2009);
19. Water resources meeting with Planning Bureau of DPU (Ministry of Public Works, Jakarta 14 September 2009):
20. Review roadmap water sector and waste (Hotel Borobudur, Jakarta, 20 October 2009).
1.4 Summary
The Roadmap on Mainstreaming Climate Change into National Development Planning ( also referred to as: “Climate Change Roadmap”) for the water sector a follow-up of the RPJPN 2004-2025 that is related to climate change and the water sector. The contents of the climate change roadmap generally are adaptation strategies. However, several of them evolved into a combination of adaption strategies and mitigation strategies and can be a solution for issues of the cross-cutting issues. The objectives of building a Roadmap on climate change for the water sector are as : 1) To identify current condition and
problems as well as the future challenge in water sector in connection with climate change; 2) To ind the vulnerabilities in the water sector against climate change based on the identiied threats. 3) To identify impacts or risks on water resources after their vulnerability has been identiied and developed strategic
issues, including cross-sectoral issues. 4) To identify and build sector policies and measures to integrate
adaptation in the water resource sector against climate change; and 5) Others necessary and signiicant
aspects such as uncertainty factors, information validity level, and need of further research or lack of research.
The Roadmap is based on a scientiic basis (i.e. climate projection and sea level rise modeling) using vulnerability assessment at a macro level. This means a simpliication of the risk assessment approach
due to availability of data, time, and depth or scope of study. The further analysis is carried out to identify policies, strategies, and programs. This analysis uses the matrix tool to map hazards, vulnerability, the potential of impact or risk, recommendations on an adaptation strategy and a priority adaptation program of climate change in the water sector.
The risk assessment of climate change include the identiication of hazards, vulnerability of the sector
the water sector to climate change and includes: reduction in water availability, l oods, droughts, and
landslides. Vulnerability (V) and risk (R) climate change obtained by reference to the formula V = (E x S) / AC and R = H x V, where E is exposure, S is sensitivity, AC is a adaptive capacity.
Conditions and problems in the water resource sector include aspects of water use and its destructive force. Water use includes water supply, water distribution and water quality. Destructive force of water
includes l oods, droughts, landslide, and seawater intrusion. The current capacity building challenge to be
Conditions, Problems,
and Challenges in the
Water Resource Sector
2.1 Current Conditions and Challenges in Water Resource Sector 2.1.1 Supply, Demand Distribution and Time of Water Resource
The condition of water resources in Indonesia generally depends on rainfall and on external surface conditions including aspects of the local geology, prevailing humidity, evapotranspiration, and evaporation rates. Besides rainfall, water resources in Indonesia include surface waters such as rivers, lakes, swamps; and ground water. Fluctuations in water quality are mostly affected by surrounding vegetation and
pollution. Rivers that have vegetation in better condition also tend to have a low river low luctuation between dry season and wet season, thus minimizing lood threat during both dry season and wet season
in the surrounding area.
The supply of surface water and ground water across Indonesia varies widely across islands in both quantity and quality. Water use depends also on the local communities’ demand and the characteristics of local economic activity, such as agriculture or industry. The results of water availability calculation are as follows: total surface water of 2,746,564 x106 m3/year and groundwater of 4,700 x 106 m3/years, total water supply is 2,751.264 x 106 m3/years or total water measured is 691,341 x 106 m3/year and average water supply per capita is 3,138.6. Details and criteria of water supply are provided in Appendix 2.1.1.
The demand for freshwater in Indonesia is constantly increasing due to the growth of population and the increased economic activity in urban and rural areas. In this study, the total water needs are calculated to include household use, agricultural demands, and industrial use, applying the criteria and analysis referred to in Appendix 2.1.1. The total amount of water demand in Indonesia is 175,179.29 x106 m3/year which consists of household use of 6,431 x106 m3/year, agricultural use of .141, 005 x106 m3/year, and
industrial use of 27,741 x106 m3/year. More than 50% of water demand is supplied from ground water. Water resources in urban areas are in general groundwater, processed surface water and spring water, whereas in rural areas usually springs, groundwater and surface water are used.
Based on water supply, water demand and current conditions, we can create a Water Balance in Indonesia (at present 2009, as referred to Table 2.1. and detailed one in Appendix 2.1.2. From Table 2.1). The water
balance in Java-Bali region shows deicits; in Nusa Tenggara, Sulawesi, Maluku and Sumatra it is critical
Table 2.1 Indonesia’s current Water Balance (2009)
1. Sumatera 111,077.65 37,805.55 73,272.10 near critical
2. Java-Bali 31,636.50 100,917.77 -69,281.27 dei cit
3. Kalimantan 140,005.55 11,982.78 128,022.77 surplus
4. Sulawesi 34,787.55 21,493.34 13,294.21 near critical
5. Nusa Tenggara 7,759.70 2,054.04 5,705.66 critical
6. Mollucas 15,457.10 540.23 14,916.87 near critical
7. Papua 350,589.65 385.58 350,204.07 surplus
Indonesia 691,313.70 175,179.29 516,134.41
As illustrated in Table 2.1, the water balance in Java-Bali and Sumatera is in critical condition, and current water supply is almost equal to current water demand.
Besides water supply and demand problem, another issue with which Indonesia has to deal now is water distribution. Water distribution includes distribution of water quantity, quality and demand. Table 2.1 and Appendix 2.1.2 show that water supply and demand is not evenly distributed across Indonesia. Papua and Kalimantan show the highest water availability and water needs with the lowest population growth; agriculture and industry levels are also low. Meanwhile, Java-Bali shows the availability of natural resources, but also very high levels of demand and population and industrial growth is also high. Distribution of resources in Indonesia should be considered in development policy. This data shows that there is an imbalance between water supply and demand as well as an uneven distribution of water across regions and islands in Indonesia.
Another important factor to consider in assessing the availability of water is time or season. Supply and
demand are really inl uenced by time, which is closely related to climate. The impact of climate change has occurred among others in the form of crop failure due to drought or l ood, or a shift in the maximum
rainfall intensity. This situation must be taken into consideration in the government’s future development policies and programs.
2.1.2 Water Quality
The use of water depends not only on quantity but also on water quality. That is why in the assessment of water resources, water quality needs to be taken into account. Generally speaking, the topic of water quality has not been given enough attention and comprehensive study. In particular, the problem of water
quality is related to signii cant losses in public health, in particular in urban areas with large populations,
Information on water quality in Indonesia is hard to come by and usually only available in cities and towns in the western part of Indonesia, particularly in Java. The following institutions provide information on water quality across Indonesia: DPU, DESDM, Depkes, and KLH (Appendix 2.1.3 for details). The general conditions and problems of water quality in Indonesia are as follows: 1) Java-Bali areas are highly polluted, in particular in cities, town and their surrounding in Java; 2) non Java-Bali areas still have relatively good water quality. Appendix 2.1.4 below includes some case study information on water quality.
2.1.3 Flood
Almost all parts of Indonesia are vulnerable to lood hazard. According to the Indonesian National Atlas (ANI, Bakosurtanal), Sumatera and Java-Bali region have the largest vulnerable areas. Situ Gintung lood, Banten, in March 2009 and the Samarinda lood, in November 2008 were the most recent cases of lood, with different causes. Sometimes loods are triggered by landslides or occur together with landslides, which is known as lash lood, as occurred in Sinjai, South Sulawesi in July 2006,which caused many
casualties.
Major factors contributing to loods are the extreme rainfall of up to 400/mm/month (as per BMKG);
overloaded surface waters or water reservoirs, such as rivers, ponds, dams, etc; and land characteristics and
conditions in upper reaches of the catchment area. Analyses of historical causes of loods in Indonesia
are provided in Appendix 2.1.5.
2.1.4 Drought
Drought has recently hit Indonesia and became a usual phenomenon in the dry season. Drought makes
it dificult for people to ind freshwater, reduces surface water in reservoirs; and limits the yield of crops,
particularly rice or puso. Cases of drought in Indonesia are provided in Appendix 2.1.6.
Drought can be deined in many ways such as meteorologically, hydrologically, agriculturally, and otherwise
(Appendix 2.1.6). The eastern part of Indonesia is vulnerable to meteorological drought. Drought risk is particularly high in areas with high population like Java-Bali. Although drought can cause a disaster, it can
also create economic opportunity in sea-ishery sector.
2.1.5 Other conditions and problems related to water resources
Landslides, land subsidence, and seawater intrusion are some of the water resource problems that need to be taken into consideration by the Government in terms of planning for measures against the impacts of climate change. The following is a brief description of related problems in the water resource sector (Appendix 2.1.7):
1) Landslides frequently hit Indonesia causing loss of life and property. For example, in the period of 2003-2005 Indonesia suffered from 103 landslides across seven provinces with a huge amount of loss. Landslides must be taken into account in any comprehensive water-related study, considering that water is often a trigger in landslide occurrences. There are at least 918 landslide zone, with Central Java having the most landslide zone (327 location), West Java (276 locations), West Sumatera (100 locations).
2) The decline in groundwater occurs in many large cities such as Jakarta, Semarang, Surabaya and Bandung from excessive groundwater pumping for both domestic and industrial uses. This decrease is due to pumping that exceeds the capacity of natural recharge. For the case of Jakarta, for example, in the 10-year period since 1975-1985 a decline in groundwater level reached 15 meters (Sumawijaya, 1994).
3) Land subsidence is caused by over-pumping or withdrawal of groundwater in excess of natural recharge rates. Land subsidence occurs in big cities such as Jakarta, Semarang, and Bandung.
4) Seawater intrusion. Seawater intrusion is related to groundwater withdrawal in coastal areas. Seawater intrusion can contaminate groundwater and make it unsuitable for drinking water. Areas like Jakarta and Semarang, in Central Java continue to be affected by seawater intrusion (See Appendix 2.10);
5) Changes to layout and land cover can affect water availability in quality and quantity
6) Local initiatives based on socio-cultural initiatives can be found in many areas of Indonesia. Such initiatives are essential tools for implementing sustainable water resource management
7) Climate change raises new challenges for water resource management. Water resource management, is critical to sustainable water supply, water demand, water distribution and water quality. Based on Law Number 7 of Year 2007 on Water Resources, the main governmental institution having authority for water resource management at national level are the Ministry of Public Works (for surface water management), and the Ministry of Energy and Mineral Resources (for management of groundwater resources). Some authorities have been delegated to the regional level.
2.2 Current Capacities
2.2.1 Response to Climate Change
Indonesia signed the UN Framework Convention on Climate Change (UNFCCC) in 1994. This Convention mandates three main things: 1) stabilizing greenhouse gas concentrations in the atmosphere at a safe level; 2) promoting common but differentiated responsibilities in protecting the atmosphere; and
3) establishing vehicles for multilateral cooperation with other countries to inance adaptation, insurance, and technology transfer. The irst element provides a solid base for mitigation measures. The second
element encourages adaptation measures. The third element facilitates achieving both mitigation and adaptation.
Adaptation is deined as technological and social measures to reduce the damages due to impacts of
climate change. Adaptive measures may include: a) direct measures to reduce social and economical impact of climate change, b) capacity building in community and ecosystem, and c) measures to enhance resilience and to increase local community welfare.
2.2.2 Policies in connection with climate change
The Ministry of Public Works has developed a policy on adaptation and mitigation to climate change in order to achieve the following goals:
(1) To enhance security (against hazard potentials), convenience (good environmental conditions), productivity (the dynamic relationships of social and economical livelihood), and sustainability (to meet both current and future demand);
(2) To improve the water infrastructure and service quality in the framework of strengthening national
food security and minimizing the risks of loods, landslides and droughts;
(3) To improve the quality of service provided by water infrastructure in urban and rural areas so as to
minimize risks from lood, water shortage, and sanitation crisis; and
(4) To improve the quality of service provided by land infrastructure in order to facilitate mobility and access by citizens to Indonesia’s social and economic facilities.
The above goals drive MPW’s strategy and development program plan in relation to mitigation of
GHGs and adaptation to climate change (details provided in Appendix 2.2). Speciic policy objectives
2.3 Speciic Challenges to the Water Resource Sector in relation to Climate Change
Challenges for the water resource sector are mainly due to hazards or risks particular for the water sector which may potentially be caused by climate change. Those hazards are the secondary impacts of climate change that devolve from direct impacts such as temperature rise, change in rainfall patterns, increase of frequency and intensity of extreme weather, and sea level rise. Direct effects of climate change are
derived from studies of climate science (scientiic basis).
2.3.1 Direct Impacts of Climate Change
The monthly temperature is increasing only around 0,50 C in wet season but it could be reach 1.50 C in dry season compared to the condition baseline in period 2010-2030s. The results of the sensitivity analysis on Lombok island show prove in the results of the sensitivity analysis in the Lombok Island, that temperature in general is increasing 10 C within the next 50 years and until 30 C within 100 years time. It is also proven from the result of analysis of temperature data in Jakarta station which is shown
signiicant temperature increase between years in 1870s and 1980s. Temperature increase during dry the season month in Jakarta is most likely inluenced by local condition in the form of urban heat island (Tri
Wahyu Hadi, 2009).
The rainfall in projection period is shown the increasing of standard deviation that can be interpreted as an increase in climate uncertainties as a result of the strength of climate variability in a particular area. For example, Sumatera still has the potential to undergo rainfall increase until 2020 and the potential threat of change in mean value and its variability are projected to happen in 2015-2020. In some area like as Nusa Tenggara and in Java Island, rainfall is tend to decrease in January, with increasing of variability although not a great extent (Tri Wahyu Hadi, 2009).
The Extreme Event (EE) aspect and Sea Level Rise (SLR) are based on results of the same study also increasing in the future. In this study, the EE effect was included in results of the projection of the temperature and rainfall. As for the SLR effect, it was studied further by the coastal sector, except the aspect of the intrusion of sea water. Further information about the direct effect of climate change are shown in Appendix 2.3.1.
2.3.2 Water Sector Hazards Due to Climate Change
the projection of the climate or the direct effect of the hazard, such as projection of the temperature and rainfall. Physical potential hazards are land use, slope of the land, porosity of soil or rock that is matched with another hazard had been analyzed. Based on period that involved in analysis, it is done on two time periods that is 30 (2000-2030) and 5 yearly periods. First, 30 year periods, the results have a higher level of
coni dence due to the periods that same which use in scientii c basis (rainfall and temperature analysis). Second, 5 year periods, the results have low level of coni dence due to simplify assumption from the scientii c basis.
Based on our analysis, the climate change hazards for the water sector in Indonesia include:
1) Water Supply Shortage (PKA). The calculation of PKA is based on two indicators that are physic potential (land use and geology) and climate condition. The Total Runoff (TRO) is calculated from water balance analysis, that is rainfall (CH) and temperature (T). PKA is total decreasing of total runoff at projection time to total run off at baseline time. Based on the analysis of TRO and annual CH during normal condition (TRON), PKA hazard is likely to occur when the TRON value during the future projection period (TRON,P), is smaller than baseline TRON (TRON,B), or TRON,P - TRON,B < 0, is 169 to 0 mm/year.
Based on PKA calculation in 30 yearly analysis (period of 2000-2030), it shown the area with high risk is Java, Province Bengkulu and Bangka-Belitung. Whereas the whole of Sumatera Island, Western Kalimantan, Nusa Tenggara and South Sulawesi is middle risk to happen the water supply shortage. The main factors are land use condition (cultivation area) and geological condition which
makes it difi cult to ini ltrate water into aquifers.
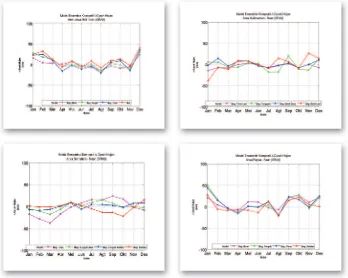
Based on the 30 year climate projection, a decrease of annual rainfall average and an increase of annual temperature is assumed. The highest decreasing of temperature is in February at Maluku Utara and decreasing again in November (Figure 2.2, left), otherwise the increasing of temperature is in North Sumatera Area and Northern Middle Sumatera (reach 20C) in March (Figure 2.2, right).
Climate condition (Figure 2.2) is shown difference with the result of PKA calculation. Therefore,
it shown here that the main factor which inl uenced to PKA is physical condition of those area
(land use and lithology).
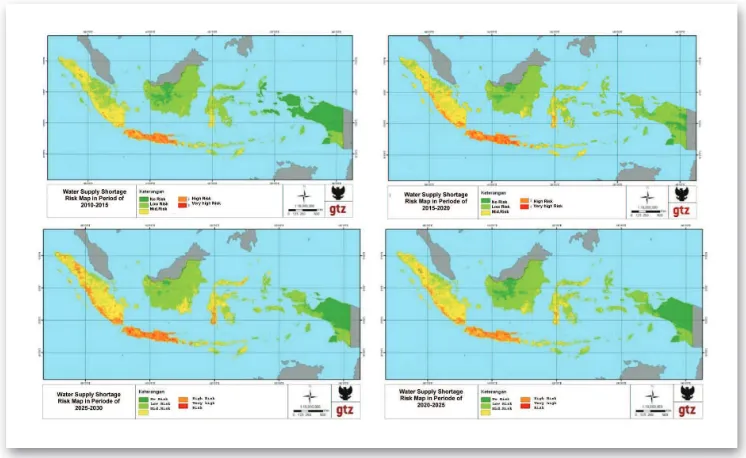
Based on 5 yearly periods analysis, PKA hazard happens in all time periods but not in a permanent area with hazard intensity increasing from 2010-2015 period to 2015-2020 period, decreasing in 2020-2025 period, and rebounding on 2025-2030 period; the distribution of hazard area in each period. Figure 2.1 illustrate the distribution of hazards and show that the Java-Bali and Sumatera regions are the regions most vulnerable to these hazards. Meanwhile, the regions with the lowest hazard threat are found in Papua and Maluku.
Figure 2. 3Water supply shortage risk, SRA2, from top left clockwise: 2010-2015 period, 2015-2020, 2020-2025, and 2025-2030
Flood.There is a threat of l ood hazard during periods with above normal rainfall (CH),
temperature increase, and physical conditions with a slope gradient <3o and accumulation of water index 10,000 based on DEM analysis;. Based on CFD analysis on total TRO data from above
normal average monthly CH (DROmax) and slope gradient of <3o, l ood hazard is highest when
DROmax for the projection period (DROmax, P) is bigger than CFD 50% of baseline condition or DROmax,CDF50,B (DROmax,P – DROmax,CDF50,B) occurs in land with slope <3o and
accumulation of index l ow >10,000. The maximum l ood hazard happens when DROmax,P –
DROmax,CDF 50,B equals 89 mm/month.
From result of 30 yearly analysis the l ood occurs in the major rivers and the surrounding area and
in lowlands particularly in Java Island, on Sumatra’s East Coast, West and South Kalimantan and
Southern Papua. The regions that are relatively safe from l ood hazard are Sulawesi, Maluku and
Figure 2. 4 Flood hazard, SRA2 2000-2030 period
Otherwise at western Kalimantan has increasing of rainfall in February and December, eastern Kalimantan has increasing rainfall in September (Figure 2.5, upper right). In the other side, Papua area has increasing rainfall in January, September, October and December and especially in January at West
Papua 50 mm is reached (Figure 2.5, lower right). Otherwise, Sumatera region has potential of l ood is middle Sumatera area both in north and south. Generally, in Sumatera region is not signii cance that rainfall inl uenced l ood compare to others area, but big watershed and environmental degradation would be potential to increasing l ood in this region (Figure 2.5, lower left).
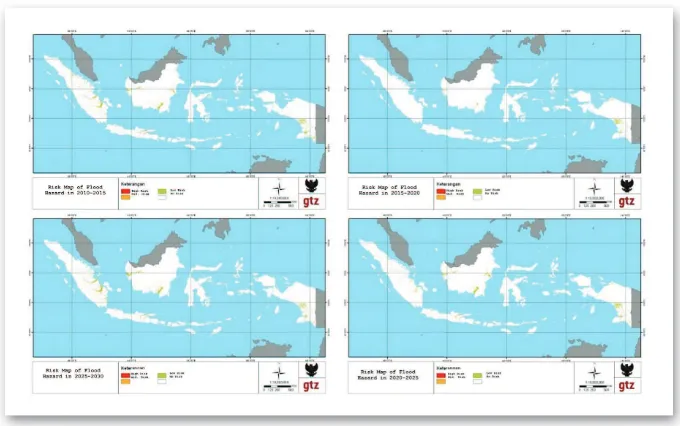
Based on analysis of 5 year periods, l ood hazard will occur in all period on the areas that are relatively
the same but with different total area and intensity pattern varying from one period to another. The
l ood occurs in the major rivers and the surrounding area and in lowlands particularly in Java Island,
on Sumatera’s East Coast, West and South Kalimantan and Southern Papua. The regions that are
relatively safe from l ood hazard are Sulawesi, Maluku and Nusatenggara (Figure 2.6).
Figure 2.6 Flood risk, SRA2, from top left clockwise: 2010-2015 period, 2015-2020, 2020-2025, and 2025-2030
2) Drought. There is increased threat of drought hazard during periods when mean rainfall (CH) is below normal and temperature is increased. Drought hazard occurs in all periods but not in any single permanent area. Based on CFD analysis of CH TRO data from under normal conditions average annual (TROmin), the danger of drought in TROmin projection period (TROmin,, P) is smaller than 996 mm / year or less TROmin in CFD 50% of baseline condition (TROmin, CFD 50. Based on 30 yearly periods, the highest risk of drought is Nothern Sumatera, southern Java, middle and east Java and Nusa Tenggara (Figure 2.7)
Based on 30 yearly climate projection (scenario SRA2), Northern Sumatera is the highest decreasing of rainfall (reach 50 mm) with increasing highest temperature (reach 20C) as shown in Figure 2.8 (upper). In Java Island, due to an increase in temperature and a decrease of rainfall as well as minimal levels of water after the monsoonal dry season, the probability of drought s highest in August. (June, July August) previously. Also in November there is a high probability of drought as shown by decreasing of rainfall and increasing of temperature (Figure 2.8, middle). In Nusa Tenggara, the highest decreasing of rainfall is in July following by increasing of temperature although not
signii cant, but physically (land use and lithology) is dried area that inl uenced to more drought in
increasing of temperature and decreasing of rainfall (Figure 2.8, lower).
Based on analysis of 5 yearly, there is increased threat of drought hazard during periods when mean rainfall (CH) is below normal and temperature is increased. Drought hazard occurs in all periods but not in any single permanent area. The hazard intensity tends to increase from 2010-2015 periods until 2025-2030; with distribution of affected area on each period as shown in Figure 2.9 and Appendix 2.3.2.3. Java-Bali, Sumatera, and Nusatenggara regions are the regions with relatively high hazard threat. On the other hand, Kalimantan, Sulawesi, Papua and Maluku are regions with relatively low hazard threat.
3) Landslide. Landslide hazard occurs when mean rainfall (CH) is above normal, and slope gradient is high. Based on CFD analysis on total TRO data from above normal average annual (TROmax), landslide hazard is TROmax projection period (TROmax,) bigger than 89 mm / month or bigger than TROmax at CFD 50% of baseline condition (TROmax, CFD 50, B).
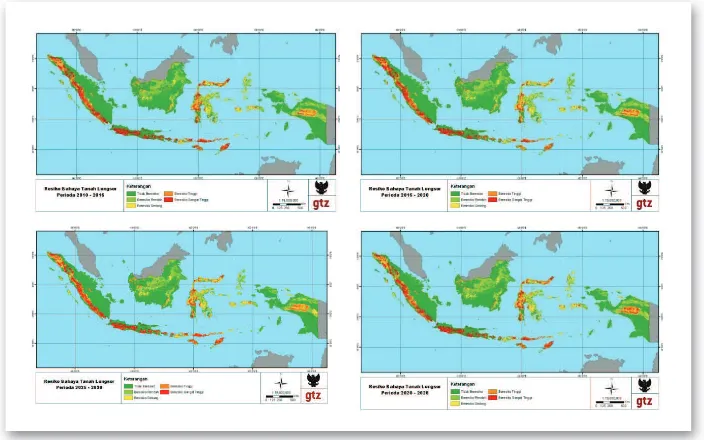
Based on analysis of 30 year periods, the areas with high hazard threat are NAD, West Sumatera, Bengkulu (Sumatera), central area of Papua, central and southern Sulawesi (Sulawesi), and the central to southern part of Java (Java-Bali). Other regions have relatively lower landslide hazard threat (Figure 2.10).
Figure 2.10 Landslide hazard, SRA2 2000-2030 period
Based on 30 year climate projection, North Sumatera area has increasing of landslide risk especially in September (Figure 2.11, upper left). Otherwise in Java-Bali, the increasing of landslide is in December, January and February, wherein it could be evaluated that in February due to rainfall accumulation (Figure 2.11, upper right). In Sulawesi, especially in North Sulawesi, the increasing
of rainfall is in September, otherwise in Middle Sulawesi is in December which is not signii cant
increase and reversal in another month (Figure 2.11, lower right). In the other hand, in Papua has high increasing rainfall especially in January (Figure 2.11, lower left).
.
Based on a 5 year analysis, landslide hazard is present throughout all periods of analysis but not in the same area with the highest hazard intensity occurs in 2015-2020 period and the intensity stays relatively the same in 2010-2015, 2020-2025, and 2025-2030; with distribution of hazard area on each period as shown in Figure 2.912 and Appendix 2.3.2.4..The areas with high hazard threat are NAD, West Sumatera, Bengkulu (Sumatera), central area of Papua, central and southern Sulawesi, and the central to southern part of Java. Other regions have relatively lower landslide hazard threat
4) Seawater Intrusion. Seawater intrusion hazard is primarily a function of excessive groundwater intake in coastal areas, but it is also affected by sea level rise (SLR). Based on groundwater and SLR data 1986-1994 on Jakarta coast (Java-Bali), seawater intrusion occurs whenever SLR exceeds 4-6 mm/year, water table (MAT) varies from 0-5 m below sea level (amsl) and hydraulic interface between 0.15%-53% for non-suppressed aquifer.; and MAT 0-50 m with a speed reduction BML 0,5-2,3 m/year and 0.1% slope hydraulic -1.33% for aquifer pressure (up to 250 m depth); capture groundwater 33.8 x 10⁶ m3/year are rate 9.03% (Appendix 2.3.2.5).
2.3.3 Strategic Issues for the Water Resources Sector in Relation with Climate Change
Based on the current conditions, problems, and future challenges of water resources, eight water resources
strategic issues in relation with climate change have been identiied, comprising of three main water sector issues and ive main cross-sectoral issues. All of the issues, while constituting threats, also contain potential beneit.
• Main water resource sector issues
The three main issues most relevant for the water sector are the following:
1) Water balance between water supply and demand (water balance), be it its temporal or spatial aspect, or its distribution. Climate change creates a threat of water supply shortage, so the related vulnerability and risk needs to be understood to identify the necessary adaptation steps. The demand of water from the residential sector should be the main priority, in every region on every season. For example, shallow groundwater and water springs in urban areas should be prioritized for residential water demand;
2) Adequate water infrastructure and provision of alternative water sources in special areas. The impact of climate change can be reduced through adequate provision and maintenance of water infrastructure function. On the contrary, inadequate or damaged water infrastructure can increase the risk for the water resource sector. Temporal and seasonal aspect of water availability is very important in relation to the operation of water infrastructure such as dams - both dams for irrigation and hydro power plants. Aside from that, special areas such as small islands, peatlands, and karsts area need breakthrough in water resource provision according to the characteristics of potentials in each area.
3) Database, technology, management, and research. The irst three issues have arisen since the
1990s. In particular, databases related to climate change play a key role now. Technology—in this case intermediate technology—is supposed to provide affordable solutions to the problems and in the same time, opportunity from climate change. For all those reason, research is still lacking and needs to be prioritized.
• Cross sectoral issues
Basically, given the range of functions of water in society, policies in the water sector are connected with almost all the other development sectors. There is not any development activity that is detached from the availability of water. The solution to main issues of water resource as mentioned above still needs the role of other sectors. In several cases, several cross-sectoral solutions will be encountered, which is also a synergic effort between adaptation and mitigation efforts.
1) Water-agriculture-forestry and disasters. Flood, drought, and landslides will bring disaster when they strike society in a highly vulnerable area. The vulnerability of key areas and risk of the three hazards needs to be known well both in their spatial and temporal aspects in order to identify and implement the appropriate adaptation steps. Reserving adequate conservation forest will increase
water resources security, helping to prevent lood, drought, and landslides; and can contribute to a
climate change mitigation effort;
2) Water and health. The lack of clean water is given impact to people use low water quality in daily activities and water drinking, they could increase the sensitivity towards the illness as well as the
decline in the health. The lood could trigger the outbreak and dengue fever of the diarrhoea illness.
Clean water facilities in rural areas that were densely-populated and bordering with the forest could reduce the possibility of the illness outbreak malaria. Drought could cause the food shortage.
3) Water and energy. There are proit opportunities in understanding the mutual relation between
water and energy in suitable areas. The greatest likelihood of commercial success lies in applying intermediate technology for water provision using alternative methods. is the use of intermediate technologies can reduce the need for burning coal or other fossil fuels, contributing to the global and national climate change mitigation effort. For this to happen, the right policy and strategy is needed;
4) Improved water use eficiency can be achieved through integrated water resource management,
particularly watershed management in the water source area or water capture area (DAS or SWS). Equally important is downstream management of water usage. The cohesiveness of various stakeholders on both parts is crucial for the successful implementation of policies.
5) Indonesia has a large and unique potential for water conservation and improved water resource management based on innovation, participation of community, local wisdom, and revitalization of existing infrastructure. Building iniltration wells or iniltration pools and water harvesting from rain fall are some of the alternatives of water provision, much of traditional local wisdom has been proven capable of maintaining the existence of water resource, but the knowledge of the system has not really been developed for optimal water use management
2.4 Concluding Remarks
This chapter explains conditions and problems of water resources, covering aspects of conservation, use of water and water hazards. This chapter also outlines future water sector hazards due to climate change and important issues in water sector and its implications.
surface water and ground water in Indonesia demonstrates that in Java-Bali the balance of water already
shows a deicit. In Nusa Tenggara, Sulawesi, the Moluccas and Sumatra the availability is already critical,
Kalimantan and Papua still being safe. Looking at the distribution of water resources in Indonesia, it could be stated that water resources are not equitably distributed. In Papua and Kalimantan the availability of water is the highest, the requirement for water is lowest with low populations, agriculture and also
industry growth. On the other hand, Java-Bali has insuficient availability, because of very high demand
and high population growth and growth of industry. The quality of water in Indonesia will need more attention, especially from the side of the provider of data and study. Water quality information generally is available in the region of cities western part in Indonesian especially in Java Island. The problems of the quality of water for the public are as follows: 1) Java-Bali region has experienced levels of relatively high pollution, especially in urban areas in Java Island; 2) Outside Java-Bali the quality of water is still
good. Other problems for the water sector are lood, drought, landslide, and sea water intrusion.
The potential hazards due to impacts of climate change for the water sector are as follows:
• Water Supply Shortage (PKA) was identiied by seeing the total runoff decreasing in the normal
condition of climate (TRON) in the period of the projection (TRON,P). TRON is taken from water balance (WB) analysis and the decline in the availability of water is taken from Cumulative Distribution Frequency analysis against TRON. The results show that the hazard of water availability is decreasing of TRON in the projection period for which the value TRON,P is smaller than 0, that is 169 to 0 mm/year. Java-Bali-Sumatra is the area most hazard by decreasing of PKA, and lowest hazard level show Papua and Moluccas.
• Flood hazard. The extreme rainfall is potential to cause of looding. In viewpoint of hydro-climatology, lood could happen if rainfall (CH) is above normal (> 400 mm/the month as encountered to CH projection). The analysis of lood counted also as a condition for the land cover and slope, and low of river. The parameter used in the analysis of lood is direct runoff (DRO) with condition of rainfall above normal (DROmax). The lood hazard is formulated as the
condition for rainfall above normal in the period of the projection that produced direct runoff
(DROmax,P) > 89 mm/year with the slope of the land < 3o. The potential of lood hazard is in big
rivers and their surroundings, and also the lowland area especially in Java Island, Eastern Sumatra, West and South Kalimantan, and southern parts of Papua. The regions which are relatively safe
from lood hazard are Sulawesi, Moluccas, and Nusa Tenggara.
• Drought hazard. Hydrological drought comes from the extreme of PKA hazard, it has the potential to emerge in the period of projection. In this study, the physical aspect of drought as of climate is involved
in the aspect of sensitivity. The identiication of drought hazard is carried out from CDF analysis. It is
found that the potential for drought hazard is relatively high in the region of Java-Bali, Sumatra, Nusa Tenggara, Kalimantan, and Sulawesi; whereas in Papua and Moluccas it is relatively low.
encountered to CH the projection), the slope of the land, as well as the porosity of the rock or the land. It is shown that landslide hazard of being the condition for the rainfall was supervised
normal in the period of the projection that produced TRO min, P ≥ 89 mm/year. The area with
high potential landslide hazard is: Nangroe Aceh Darussalam, West Sumatra, Bengkulu (Sumatra), middle potential hazard is in Papua, South Sulawesi, and South Java.
There are 8 (eight) strategic issues (SDA) related to climate change as follows: 1) The balance between availability and requirement for water (the balance of water); 2) Water Infrastructure that has to be adequate and the provision of alternative sources of water to affected areas; 3) Database, technology,
management and research, and i ve main cross-sector issue are following: 1) Water-agriculture-forestry, l ood danger, drought, and landslide; 2) Water and health; 3) Water and energy; 4) Management water
vulnerability of Water
Sector against Climate
Change
3.1 Identify the Vulnerability Components
The overall vulnerability of Indonesia’s water sector has been analyzed using the GIS Analysis. The seven
primary components of vulnerability (based on quantitative data) and ive (based on qualitative data)
additional vulnerability components are described below.
1. River Basin and Land Use. River basins damaged by development are vulnerable to loods,
droughts, and landslide. The areal extent of damaged river basins is increasing every year. In the
period from 1994/1995 until 1998/1999, 49 damaged river basins were identiied as “super priority”
areas. The number of such basins increased to 60 in the period of 1999/2000 – 20006 (excerpted from SLHI data, 2006). (See Appendix 3.1.1.)
2. Population Density (PD). In general, Indonesia has a high population density (PD) with uneven distribution. Regions such as Java and Bali have the highest population and the highest density, followed by Sumatra. In 2005, Indonesia’s total population was almost 219 million people and the PD was 112/km2. The Government of Indonesia estimates that population growth until 2030 is estimated 1.4 million people/year (excepted from BPS, 2006). High population density increases Indonesia’s vulnerability to all climate change hazards and is the largest contributor to the nation’s elevated vulnerability level. (See Appendix 3.1.2).
3. Land-use planning Land-use patterns also make a major contribution to Indonesia’s vulnerability component to climate change-related hazards. Based on poor land-cover patterns and the declining area of forest cover, regions such as Java, Bali, and Sumatra have the highest vulnerability level. Sulawesi and the Eastern part of Nusa Tenggara have a moderate vulnerability level in terms of land cover area. Areas like Kalimantan, Maluku islands, and Papua are relatively less vulnerable to climate change-related hazards. (See Appendix 3.1.3).
5. Conined aquifer1 and Aquifers (CAT) Potential. Conined aquifers in Indonesia are largely in
good condition and somewhat evenly distributed among regions. The total water resource inlow to conined aquifers is estimated to be nearly 18.841,37 x 106 m3/year spread among 465 aquifers. (Data excerpted from Geological Body, 2005). Areas with the highest groundwater potential are Java-Bali, followed by Sumatera, Papua and Mollucas. Sulawesi and Nusa Tenggara have moderate
groundwater levels. Kalimantan has the lowest level of conined aquifer. Since conined aquifers
play an important role in the water supply because they are not rechargeable in short periods of rainfall, it is considered as a major vulnerability component to climate change hazard such as water-supply shortage and droughts. (See Appendix 3.1.5).
6. Land Elevation contributes to lood risk potential. Indonesian geological land elevation level
can be divided into two categories of slope: high – very high level (5 - 36o) and low – mid level (0o- 5o). Falling into high to very high level category are areas such as central and northern part of Papua, some parts of Mollucas and Sulawesi, central part of Nusa Tenggara, central part of Java-Bali, central and western part of Sumatera, and central part of Kalimantan. The remainder of Indonesia falls into low – mid level category, including, for example, the eastern coast of Sumatra. (See Appendix 3.1.6)
7. Soil properties are a permanent feature of the landscape and one of the major contributors to
physical components of vulnerability to hazards such as landslides, loods and droughts. One of the land characteristics that contribute to risks of lood and drought hazard is the presence of clay
sediments. It is important to identify the types and distribution of these rocks accurately based on information from reviewed geologic maps, landslide susceptibility maps, and reports of landslide disasters (Appendix 3.1.7)
8. Water quality is a qualitative vulnerability component and contributes to the assessment of risks of water shortage. In general, Indonesia has relatively good water quality. The existing water supply can cover most of the water needs in several areas, especially in rural areas. Water quality in urban areas, particularly in big cities in Java-Bali has degraded in recent years. Water quality in some big cities in Sumatera, Kalimantan and a few in Sulawesi and Nusa Tenggara, particularly Nusa
Tenggara Barat, have degraded signiicantly. (Appendix 3.1.8.)