Dirman Hanafi
1,
Mohd. Fua’ad bin Rahmat
2 1Electrical Engineering Department, Faculty of Industrial Technology, Universitas Bung Hatta, Jl. Sumatera Ulak Karang Padang 25133, Indonesia,
Tel: +62-751-51678, 52096, Fax: +62-751-55475, 443160 E-mail: [email protected]
2
Instrumentation and Control Engineering Department, Faculty of Electrical Engineering Universiti Teknologi Malaysia, 81310 Skudai, Johor Darul Ta’zim
Phone: 07-5535900, Fax: 07-5566272 E-mail: [email protected]
ABSTRACT
Neural networks system identification have been widely used for estimate the nonlinear model of system. In this paper, multilayer perceptron neural network is used for identifying the Nonlinear AutoRegressive with eXogenous input (NARX) model of a quarter car passive suspension system. Input output data are acquired by driving a car on a special road event. The networks structure is developed based on system model. The Networks learning algorithm is derived using Fisher’s scoring method. Then the Fisher information is given as a weighted covariance matrix of inputs and outputs the network hidden layer. Unitwise Fisher’s scoring method reduces to the algorithm in which each unit estimate its own weights by a weighted least square method. The results show that the method uses suitable for modeling a quarter car passive suspension systems.
Keywords: neural network system identification, NARX model, multilayer perceptron, weighted least square, fisher’s
scoring, fisher information.
INTRODUCTION
Multilayer perceptrons have been applied success-fully to solve some difficult and diverse problems by training them in a supervised manner. The highly popular training algorithm is known as the error backpropagation algorithm [1,2]. Squared error criterion is usually used as a cost function. The cost function is minimized for update the networks weights by the steepest decent method [3].
In this paper, the error is assumed has Gaussian distribution. The cost function minimizing is inter-preted as maximum likelihood parameter estimation [3,4,5]. The iterative weighted least squares algorithm is derived from the cross entropy cost function by applying maximum likelihood estimation procedure [3]. A learning algorithm is presented based on Fisher’s scoring method. The Hessian matrix is constructed using Newton Raphson method and Fisher’s information matrix. The algorithm is presented as iterative weighted least square method [3,6]. Fisher information is also given as weighted covariance matrix of hidden layer neuron input and output. In this research, the values of delta weight are controlled to keep them in a special range.
Note: Discussion of this paper must be submitted before June, 1st 2008. The proper discussion will be published in Electrical Engineering Journal volume 8, number 2, September 2008.
The neural network develop in this research is used to identify nonlinear model of a quarter car passive suspension system. One of the well known nonlinear model structure is NARX, where it has been widely use for modeling the nonlinear system dynamics [7,8]. Therefore, the car suspension system model is derived in NARX structure. The input output data of car is measured in experimental way. The car is driven on the random type of artificial road surface.
Objectives
1. To design the neural networks structure based on nonlinear model of a quarter car passive sus-pension system. The network type is a multilayer perceptron.
2. To design and to implement the system identi-fication algorithm combination between neural networks and weighted least square method. The algorithm is called Multilayer Perceptron Weighted Least Square (MLPWLS) Neural Networks.
3. To identify model parameters of NARX model of a quarter car passive suspension system applied MLPLS neural network.
A Quarter Car Mathematical Model
ground, minimize transient force to the body, maintain good ride comfort and enhance handling performance [9,10].
The suspension systems are influenced by the excitations due to the road unevenness and variable velocity. In earlier work on the analysis of car response, the car velocity was considered as constant, since it was difficult to introduce the effect of variable velocity formulation of the model [10].
The physical constraint of the suspension system is the limited suspension travel. A basic passive suspension consists of a spring with a parallel damper at each wheel.
In this paper, a generic of quarter car passive suspension model has been modified for analysis [11,12,13,14,15,16]. Related to the current trend using four independent suspensions on a single car, a quarter car systems offer a quite reasonable representation of the actual suspension system [12]. Figure 1 shows the schematic diagram of this model.
Figure 1. A quarter car suspension schematic diagram
where, M ,s Mus are their respective masses. Between these masses,
us s K
K , are the spring rates and C ,s Cus
are the damping rates. Zs,Zus,Zo are respectively the vertical displacement of sprung mass, the vertical displacement of unsprung mass, and road surface elevation.
The dynamics of real suspensions are inherently non-linear. Therefore in past decade, the car suspension system dynamic has been modeled in nonlinear formulation [12,14,15,16]. The Nonlinear Auto-Regressive with eXogenous input (NARX) structure model of a quarter car passive suspension system is determined based on Figure 1. Equation 1 and 2 respectively show the vehicle body vertical displace-ment and vehicle axle vertical displacedisplace-ment. Equation 3 represented the suspension displacement as output model. Equation 4 is a nonlinear function of the model. sampling time.
),
where,
net
is the sum of multiple input with related weight, C is sigmoid constant and c is exponential constant.Network Structure Based on NARX Model of a Quarter Car Passive Suspension Systems
Model parameters are taken to be the neural networks weights. Input vector for each layer of the networks is written as the following:
• First part of hidden layer input vector
,
• Second part of hidden layer input vector
,
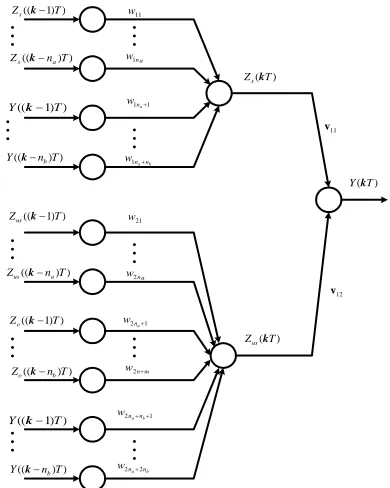
The network block diagram is shown by Figure 2.
M
MLPWLS Neural Network Training Algorithm
The cost function in this research is formulated in log likelihood formulation [3].
Likelihood
In this case, we assumed that: j=1,2,...,Jare numbers of hidden layer neuron; k=1,2,...,Kare numbers of output layer neuron; i=1,2,...,Iare numbers of input layer neuron or unit input; and
P The output vector of the network in Figure 2,
]
Y = L is determined for an input vector
, multiple input with related weight of output layer.
Let the set of learning samples be
{
<xpi,tpk> p=1,2,L,P}
, P is a number of input variable. tpk is the teacher’s signal. The error isassumed has normal Gaussian distribution. If each element of output vector of the network is conditionally independent, then the log likelihood of the network for the set of learning samples is given by
Fisher Information
In this network, Fisher Information for hidden layer is calculated explicitly [3]. The first and second derivative of Equation 7 are given as
• The first derivatives
∑ ∑
= =• The second derivatives =
Minimization of criteria function define as
)
Fisher Information (F) related for each weight vector of network is written as the following
∑
Iterative Weighted Least Squares Algorithm
The learning algorithm for weight updating is done by minimizing Equation 7. We apply steepest decent optimization method with use the first derivative of objective function [3]. Assumed the current estimate of the weights is W and
α
is learning rate. Then estimate process is repeatedly updated byl W
W ∗ = −α∇ (19)
If weights are updated to each set of learning sample, Equation 19 can be modified to be:
p
called steepest decent method.
In this case Fisher’s scoring algorithm is developed with uses Fisher’s information. The estimated is repeatedly changed by
W W
W∗ = +δ (21)
where the increment δWis calculated by solving the following equation.
l W
Fδ =∇ (22)
This is called Fisher’s scoring method.
Unitwise Iterative Weighted Least Squares Algorithm
Fisher’s Information related with the weights from input layer to hidden layer are given by [3]
∑
and j is the number of hidden neuron. This is a weighted covariance matrix of input vectors. Using Equation 22 and 23, the normal equation of weighted least squares estimation to obtain the current estimates of the weights Ww∗jas the following
Similarly, Fisher’s information for output layer weights and corresponding normal equation are written as:
[
z y z]
Z Q Zrepeatedly update by solving normal equation. This method is called Unitwise Fisher’s scoring method. In this algorithm each neuron weights is a unit of the networks estimate by the iterative weighted least squares algorithm.
Next we will consider the recursive formulas to solve these normal equations for the weighted least squares. This reveals the close relation between the proposed Unitwise Fisher’s Scoring algorithm and the backpropagation learning algorithm.
The optimal estimate parameters respect to the set of earlier learning samples and the new learning samples. The recursive equation is written as
Nj
where the matrix Rwjgives the estimates of the
inverse of the weighted covariance matrix
X
( and its recursive formula is
N N w T N Nj Njj Nj N N N N
N w T N N N w Nj Njj Nj N N N N N
j N
j y x R x
R x x R y
R R
j j j
w
w 1
1 1 1
) ) 2 1 ( ( 1
) ) 2 1 ( (
− − − −
Ω − − +
Ω − − −
= δ δ ω ω υ χυ υχ υ (34)
In the same way the recursive formula for the estimate
v
vk is given byNk Nk N N v N
k N
k v R z
v
k
v
v = − + δ ω
1
(35)
N T N Nk pk Nk
T N N Nk pk Nk
z R z y
R z z R y
R
R N
k N
k N
k N
k N
k
v v v
v
v 1
1 1
1
) 2 1 ( 1
) 2 1 (
− − −
−
− +
− − =
ω δ
ω δ
(36)
MODEL VALIDATION
Model validation is needed to verify that identified model fulfills the modeling requirement according to subjective and objective criteria of good model approximation. In this paper several criteria are applied among:
1. Compare between the signal graph of system output and estimate model output.
2. Residual analysis: auto correlation and cross correlation, and test statistic.
3. Percent Variance Accounted For (% VAF).
Data Collection
Input variable is one of decisive factor for system identification. The input data must be able to generate the dynamic properties of system. The major source of vehicle vibration is road surface [9]. Therefore in this research, the experimental was carried out using driving test car on the artificial road surface. The artificial road surface is designed for imitate the real road surface. The random type of artificial road surface is made using the three different beams. They are arranged with random dimension and distance. The random artificial road surface used in this research is shown in Figure 3.
Figure 3. Random type artificial road surface
Three signals are carried out from this experiment. First the road surface signal as input variable is produced by converting the road surface parameter in to signal form. Second, the vehicle suspension
displacement signal is collected using displacement sensor (LVDTs) and the third is vehicle body acceleration signal is acquired using accelerometer sensor. All signals are needed in system identifi-cation.
System Identification Result
The data sampling (T) is assumed 1 second.
The graph of input signal and output signal of system are shown by Figure 4 and 5. The data will be divided in to two parts. Half of them use for estimating the model parameter and other part use for model validation.
Figure 4. Random type of artificial road surface
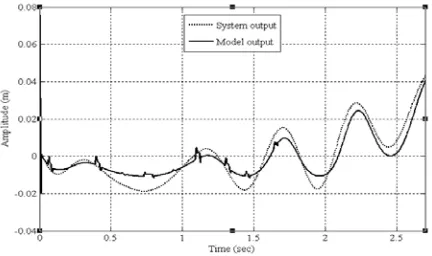
Figure 5. The signal graph of output system
Figure (6) shows the signal graph comparing between output system (acquired signal) and output estimate model. The model output has similar trend with the system output. It means the model has same dynamic with the system.
The MSE as a parameter in neural networks training is represented in Figure 7. The minimum value is 3.29x10⁻⁴ and it defined after 1843 iterations. The training process was stopped at that iteration number.
Figure 7. MSE value
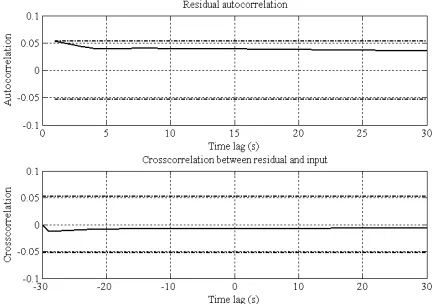
The residual autocorrelation graph closely laid in the 99% confidence interval limit while the cross-correlation with input exactly laid in the 99% confidence interval limit as shown in Figure 8. Therefore, the residual can be said not correlate.
Figure 8. Residual autocorrelation and crosscorrela-tion with input with 99% confidence interval.
A typical training is reported in Figure 6. The MSE on the training set is reported as a function of the number of iterations. A standard way to present the decision problem in the case of interactive system identification is to show a diagram of residual auto-correlation. Figure 7 is shown residual autocorre-lation and crosscorreautocorre-lation with the input with 99% confident interval limit. A test for the independence of input and residual is based on the cross correlation covariance function. Both of the graphs are laid in the interval limit. It means the residual has not corre-lation with the input.
The best identified model has na=5and nb=7. From statistical analysis, we defined the value of the
autocorrelation test statistic is 34.66 and cross correlation test statistic is 23.91 (for l=30 theses value must be less than 50.9). Loss function and %VAF are respectively 0.0033 and 97.0%.
DISCUSSION
Determination of the nonlinear model of a quarter car suspension system has been discussed. The model is formulated in NARX structure and used to design the neural network structure. The network structure is defined as a Multilayer Perceptron. The networks training algorithm is written down applying Fisher’s information and Fisher’s scoring algorithm. The algorithm is interpreted as iterations of weighted least square method. The system input output data are acquired from experimental by running the test car on artificial road surface. The development algorithm examined using those data. A detailed description of the taken to perform the modeling, i.e. the data acquisition and application of neural network structures and algorithm, is given and the results are displayed.
CONCLUSION
In this paper system identification technique for a quarter car suspension systems dynamic has been developed. The neural network weight update is done using weighted least squares method. The weighted least square works as a function for tuning the network weights. The system identification algorithm is used to identify nonlinear model of a quarter car passive suspension system. The results show that the trend of output signal of estimate model is nearly similar with output signal of system. The autocorre-lation graph of residual and cross correautocorre-lation graph between residual and input signal is laying in 99% confident limit. The value of Percent Variance Accounted For (%AVF) and loss function are acceptable.
ACKNOWLEDGMENTS
This work has been supported by the Research Management Centre (RMC) Universiti Teknologi Malaysia under Contract no 74112.
REFERENCES
[1] Rumelhart, D.E., Hinton, G.E., and Williams, R.J. Learning Representation by Back Propa-gation Error. Nature, 1986. 323(9): 533-536. [2] Hayykin, Simon, Neural Networks: a
[3] Kurita, Takio, “Iterative weighted least squares algorithms for neural networks”. In Proceeding of the 3rd Workshop ALT, 1992. 77-89, Berlin. [4] Hinton, G.E., “Connectionist Learning
Proce-dures”. Artificial Intelligence 40, 1989. pp. 185-234.
[5] Bridle, J.S., “Training stochastic model recog-nition algorithms as networks can lead to maximum mutual information estimation of parameters”. In Neural Information Processing Systems 2, 1990. pp. 211-217.
[6] McCullagh, P. and Nelder FRS, J.A. Genera-lized Linear Model, Chapman and Hall, 1989. [7] Siegelmann, H., Horne, B., and Geles, L.
“Computational Capabilities of Recurrent Neural Networks”. IEEE Trans. System, Man and Cybernetics, 1997. 27 (B): 208-218. [8] Chen, S., Billings, S., and Grand, P., “Nonlinear
System Identification Using Neural Networks”. International Journal of Control, 1990. 51: 1191-1214.
[9] Gillespie, Thomas D., Fundamentals of Vehicle Dynamics. Society of Automotive Engineer. Inc, Warrendale, 1992.
[10] Majjad, R., “Estimation of Suspension Para-meters”. In Proceeding of IEEE International Conference on Control Applications, 1997. 552-527, Hartford.
[11] Buckner, G.D., and Schuetze, K.T., Intelligent Estimation of System Parameters for Active Vehicle Suspension Control. Society of Automotive Engineer, 1999. 1999-01-0729:1-6. [12] Kim, C., and Ro, P.I., Reduced Order Modeling
and Parameter Estimation for A Quarter Car Suspension System. Instrumentation Mechanical Engineering, 2000. 214(D):851-864.
[13] Hardier, Georges, “Recurrent RBF Networks for Suspension System Modeling and Wear Diagnosis of A Damper”. IEEE, 1998. 0-7803-4859-I/98: 2441-2446.
[14] Tan, Han-Shue, “Model Identification of An Automotive Hydraulic Active Suspension System”. In Proceeding of the American Control Conference Albuquerque, 1997. 2920-2924, New Mexico.
[15] Votrubec, Radek, “Nonlinear Identification of Global Characteristic of Damping Car System”. In Proceeding of the Seminar Instrumentation and Control, 2001. 1-9, Ostrava.