COMPARISON PRODUCTION BIOETHANOL FROM CELLULOSE
USING BATCH DISTILLATION AND FLASH DISTILLATION
PROCESS
*
Ni Ketut Sari1and Dira Ernawati21Department of Chemical Engineering,2Department of Industry Engineering, Faculty of Engineering, Universitas Pembangunan Nasional Veteran Jawa Timur, Indonesia
*[email protected], Received: 00 Oct. 2017, Revised: 00 Nov. 2017, Accepted: 00 Dec. 2017 ABSTRACT:The process of distillation in either a batch distillation or flash distillation each have positions and disadvantages, and the areas of batch distillation that have high columns can be synchronized with some the stage more than one phases, and flash distillation have tall columns that matched equally to one step. The advantages of flash distillation have a shorter distillation time versus batch distillation, distillation bioethanol yield on flash batch distillation more than it is. This research aims to get purer bioethanol, more amount of bioethanol as well as shorter time. Bamboo contains cellulose and high glucose, reduce the amount of lignin and pentose with pretreatment and lignification process, filtrate glucose produced in the fermentation using enzymes. From the process of fermentation obtained bioethanol with 15%, then conducted the process of distillation, with variable timing and temperature. Bioethanol achieved with the levels of approximately 95%, of the process of batch distillation bioethanol yield obtained is smaller, longer time and higher levels of the flash distillation process, obtained yield bioethanol larger, shorter time and the lower levels.
Keywords: Batch, bioethanol, cellulose, flash
1. INTRODUCTION
In the process of separation, data
thermodynamic the most dominant influence
on the performance of the process is the
equilibrium phase. One of the modern
thermodynamic correlation in the presentation
are not ideal mixture is an approximate
equation of equilibrium systems UNIQUAC,
ternary, and Quaternary can be done only by
experimental data of binary systems. Activity
coefficient models UNIQUAC equations
developed from a mixture of binary, and has
the advantage to be applications on multi-core
system mix component because it only
requires binary parameters (requires no
additional parameters) [1], but the loss of such
models do not always succeed in estimating
the equilibrium system of multi-component
that shows a very mixed ideally not more in
the mix which has limited solubility with
couples such as ethanol-water. To address the
required equilibrium data of binary system of
measurement to accurately model and
estimation of parameters of the model
coefficients activities so that the parameters
can be used to estimate the liquid-vapor
equilibrium system of multi-component
correctly [1]. The procedure of the iteration to
find the temperature of the bubble that is
looking for a price of the saturated
temperature of pure component (Ti
sat) on
pressure (P) [2]. The amount of T as the
starting price will be used to find out the
saturated vapor pressure of a substance which
will be was estimated with equation Antoine,
activity coefficient (γ
i) UNIQUAC equations.
with the ternary system of benzene-toluene binary system approached the same results.
2. MULTICOMPONENT SYSTEMS SEPARATION
In the separation of multicomponent systems, assuming that perfect mixed liquid which Xw = xi and yD= yi, then [3]:
Which: at the bottom liquid composition (Xw), the composition of component-i liquid (xi), the composition of the vapor in the distillate (yD) and the composition of the component-i vapor (yi). With initial conditions: x = x0dan W = W0, then change into integral form:
Defined dimensionless time () as below:
Which, = dimensionless number that depends on time, and then substituted and obtained equation as below:
The equation above is a model Differential-Algebraic-Equations (DAEs) for simple batch distillation of multi-component systems, assuming no phase was forming two liquids. The equation above is the forward-finite-difference, will be obtained in the bottom liquid composition (xi,j+1) as a function of, thus obtained as follows [6]:
xi,j+1= xi,j+ (yi,j– xi,j) (6) Where the composition of the first liquid at bot (xi,j) dan determined, while the structure of the vapor (yi,j) is calculated using equation BUBL T [7].
3. THE PROCESS OF MAKING ETHANOL
From the result of laboratory analysis, it was known that ethanol forming element was cellulose, glucose, and starch. The average concentration of
cellulose was 48%, glucose was 5 %, and starch was 20%. The cutting of cellulose with an approximate length of 5 cm and obtain the high level of glucose and cellulose during the hydrolyzed process by Bacillus and H-Cl. The quality of bioethanol was determined by various influencing parameter such as the acidity (pH), the volume of H-Cl to cellulose, and the volume of Bacillus to the filtrate, Saccharomyces
Cerevisiae (SC) starter
concentration, fermentation time, and batch distillation time. The quality analysis of raw materials and Bioethanol product is done by laboratory analysis. It conducted on the instrumentation and gravimetric analysis by using
Gas Chromatography (GC), and
Spectrophotometer, which analyzed items were the concentration of starch, glucose, ethanol, H-Cl, crude protein level, and N, P, K, Ca, Mg, S. 3.1. The Procedure of Hydrolysis Process
Hydrolysis process was done in stable condition: temperature of 30oC, water volume in 7 liters, and hydrolysis time in 1 hour with 200 rotations per minute (RPM). For the changing condition: bulrush weight of 50, 100, 150, 200, 250 (grams), the ratio of bacillus to filtrate volume 1:2; 5:4; 10:7 and H-Cl solution volume 10, 20, 30, 40, 50 (ml). The level of glucose in hydrolysis filtrate yield was analyzed before the fermentation process and done.
3.2. The Procedure of Fermentation Process
The addition process of citrate acid and Na-OH to the glucose yield from hydrolysis process which is unqualified the requirements done. Then citrate acid was added to the hydrolysis filtrate yield which would be fermented reaching the fermentation acidity (pH) of 4.5. Next, the starter was put into the solution that would be fermented in anaerobic condition then sealed tightly the bottle and observed during a certain time. In fermentation process such Figure 1, the stable conditions were the temperature of 30oC, acidity (pH) of 4.5; the volume of fermentation was the same amount as the volume of hydrolysis process filtrate. The changing condition was fermentation time 4, 5, 6, 7, 8 (days), starter 8, 10, 12 (%), then the ethanol content was analyzed.
3.3. The Procedure of Distillation Process
bottom solution volume remained 10% from its initial size, the distillation process stopped then the ethanol content was analyzed.
4. FLASH AND BATCH DISTILLATION
Fig.1 Flash distillation process
Based on the picture (Figure 1) above the bioethanol production process to produce the quality of bioethanol by examining some of the influential parameters such as the degree of acidity (pH), the ratio the volume enzyme against the volume of filtrate glucose, time distillation process and temperature distillation process [8].
Fig.2 Batch distillation process Image captions :
(1) Still Pot (2) Oil batch (3) Heater (4) Thermocouple (5) Controller (6) Contactor
(7) Regulator (8) Thermometer (9) Measuring cup (10) Condensers
(11) Thermocouple RTD (12) Separation column (13) Packed column
5. RESULT AND DISCUSSION
In acid hydrolysis, H-Cl or H2SO4 was at the individual level. Hydrolysis process in a particular specialized tank made of stainless steel or copper pipe connected to the heating ducts and exhaust pipes to regulate the air pressure. The cellulose (bulrush) could be converted into glucose by concentrated acid hydrolysis process with absolute concentration.
Fig. 3 Changes glucose contains addition H-Cl volume in bulrush
Figure 3 showed the various weight of bulrush: 50 100, 150, 200, and 250 (grams) by the addition of various HCl volumes: 10, 20, 30, 40, 50 ml. After the extraction process finished, the solid, and filtrate obtained. The filtrate will be processed by the fermentation process to obtain ethanol concentration, and solids can use as compost. The effect of pH was essential in the fermentation process so filtrate must be measured for pH in the minimum level of 3.5 until the maximum level of 4.5 because SC can survive on that range of pH. Maintain pH in 4.5, the addition of Na-OH would do if filtrate pH was under 4.5 and the addition of citric acid would do if the pH of the filtrate were above 4.5.
lower than 16%, the addition of pure glucose would do.
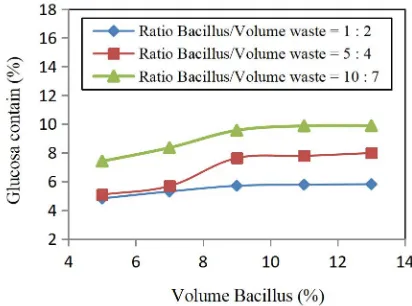
Figure 4 showed the effect of glucose level on bacillus volume. The more significant amount of an additional bacillus volume, the higher glucose level would be gained. The Bacillus volume between 3-9 (%) showed the increase of glucose concentration because that condition was growing phase of Bacillus, so the cellulose-containing in bulrush turned into glucose. On the Bacillus volume above 9%, the graph showed constant, the decreasing of Bacillus performance caused this from time to time when they finally died, so it was necessary to regenerate Bacillus. The yield glucose concentration on hydrolysis process by using Bacillus was 10%, while by using HCl was 37%, so the glucose concentration by using Bacillus was lower than by using H-Cl because the chemical process for glucose concentration was higher than biological process, a however biological process was environmentally friendly [11].
The using fermentation process was not used oxygen, in another word, anaerobic process. To control the production of ethanol from sugar was quite complicated because the concentration of substrate and oxygen influenced yeast metabolism, cell survival, cell growth, cell division, and ethanol production. The selection of a suitable SC, high concentration tolerance, and a substrate was an essential point for improving the ethanol concentration and yield. The most critical points in fermentation were starter preparation, inoculation process until it was completely ready to be put into a fermentation tank.
Fig. 4 Changes glucose contains addition volume bacillus inbulrush
Figure 5 showed the best filtrate fermentation process from bulrush hydrolysis result was 250 grams, 8, 10, and 12 (%) starter additions (liquid SC), fermentation time of 4, 5, 6, 7, and 8 (days). The addition of 10% starter of liquid volume showed the higher ethanol concentration than
8-12% starter addition. Then, the remaining glucose level was analyzed. The addition of 10% starter showed the lower remaining glucose level compared to the addition of 8-12% starter. After fermentation process done on 250 grams bulrush, 10% SC starter, and six days, it was gained ethanol concentration of 31.7%, ethanol concentration in our research was higher than the study conducting which was under 16%.
Fig. 5 Changes glucose contains with fermentation time in bulrush
Figure 5 showed the best result of batch distillation process from fermentation process was on 10% SC starter and six days fermentation time. After hydrolysis and fermentation process do on 250 grams bulrush, 10% SC starter and six days fermentation time, it was obtained 96% ethanol concentration and 33.3% ethanol yield. Ethanol concentration from our research result was higher than the research conducting 77.54%, and ethanol yield resulting in our study was economically profitable.
Batch distillation process conducted at the temperature 780C, completed by total condenser and gas stove heating, after bottom solution volume remained 10% from initial amount, batch distillation was stopped. Ethanol gained from the fermentation process and a batch distillation process, by selecting the best conditions of the fermentation process, at 10-day fermentation, and volume filtrate glucose at 5 liters. The obtaining ethanol concentration from the distillation batch showed the range of (91-96) %, time distillation process (3-4) hours. The obtaining ethanol concentration from the distillation flash showed the range of (90-95) %, time distillation process (1-2) hours. Economically it fulfills the requirements to be commercialized because the required technical ethanol is 95% and the resulting yield is also high [9].
the distillate, since the process of distillation operation in conditions of total reflux. Therefore, the temperature profile of the simulated results like, is the number of the component temperature after the normalization of liquid in composition multiplied bottom component. The element that evaporated with the more significant portion is a component of ethanol, so it takes a higher temperature to vaporize ingredient of butanol that hasn't disappeared [10].
Profile temperature at three regions, to region one coefficient of butanol activities, showed a declining profile and activity coefficients of ethanol rose so there is no effect on the temperature profile. The higher the composition of butanol on incoming feeds showed a steep drop in the temperature slope is more because the structure of butanol on incoming feeds dramatically affects the temperature of the mixture of bioethanol, the higher the form of bioethanol on the incoming temperature of the feed mix the higher.
For region two profiles of temperature rise for all of the runs, the higher the composition of
ethanol on incoming feeds showed a more temperature rise slope ramps. The structure of ethanol on incoming feeds dramatically affects the temperature of the mixture of bioethanol, the higher the form of ethanol on the incoming temperature of the feed mixture is fewer.
For the three profiles of temperature rise and most constant, temperature profiles for the rise in the separation of a mixture of ethanol are still there that bioethanol has not evaporated, while for the continuous composition profile means it's been all ethanol evaporated. The higher the composition of butanol on incoming feed then the temperature of the mixture is higher and more rapid temperature profile constant. For the dimensionless time, 3.5 patterns of temperature hasn't been continuous, so the dimensionless time required to obtain a constant temperature profile. If a pure batch distillation forwarded to dimensionless time, it will be retrieved the value composition of each mixture is negative, undesirable things like this.
Table 1 The results of batch and flash distillation process with ratio enzyme again filtrate (F) glucose
6. CONCLUSION
Temperature profile bioethanol overall rise against the dimensionless time, except at the beginning of the process shows temperature profile decreased, due to the nature of the characteristics of the mixture. With the same yield range (31.66 to 33.3) %, glucose filtrate volume at 5 liters, the obtaining ethanol concentration from the distillation batch showed the range of (91-96) %,
time distillation process (3-4) hours. The obtaining ethanol concentration from the distillation flash showed the range of (90-95) %, time distillation process (1-2) hours.
7. ACKNOWLEDGMENTS
The authors would like to acknowledge the financial support of the Ministry of National Education of the Republic of Indonesia with the Ratio
Enzyme/ F. Glucose
Volume Enzyme
(ml)
Glucose level
(%)
Enzyme level (%)
Enzyme Level (%) Batch Flash
5 4.82 19.63 91.5 90.0
7 5.30 20.15 93.0 92.3
1: 2 9 5.70 20.01 94.0 93.4
11 5.78 19.99 92.5 90.3
13 5.81 18.87 91.0 90.3
5 5.08 18.63 92.0 91.1
7 5.68 20.46 94.5 93.2
5: 4 9 7.63 20.88 96.0 95.0
11 7.78 19.33 95.0 93.5
13 7.98 18.27 94.0 92.6
5 7.41 19.63 94.0 93.0
7 8.35 21.90 94.5 93.7
10: 7 9 9.56 20.44 95.0 94.5
11 9.87 19.66 94.5 92.3
Research-based Competence Grant, Contract Number: 1/UN63.8/LT-Contract//III/2017.
8. REFERENCES
[1] Doherty and Perkins, John Wiley & Sons, Inc., New York, 1978.
[2] Handogo R. and Wibawa G., Experiments and Correlations of Vapor-Liquid Equilibria of Acetone-1-Butanol-Ethanol Ternary Mixture, International Conference on Fluid and Thermal Energy Conversion, Yogyakarta, Indonesia, 1997.
[3] Henley and Seader, John Wiley & Sons, Inc., New York, 1998, pp. 586-712.
[4] Sari N.K., Kuswandi, Nonot S., and Handogo R., Journal REAKTOR Department of Chemical Engineering University of Diponegoro, volume 13, nomor 2, 2006. [5] Sari N.K., Kuswandi, Nonot S., and Renanto
H., Separation of Ethanol-Water System of Binary and Ternary Systems with Simple Batch Distillation ABE Indonesia, Journal INDUSTRI Faculty of Industry Engineering Institute of Technology Surabaya, Volume 6, Nomor 5, 2007.
[6] Prausnitz J.M., The Properties of Gases and Liquids, Mc. Graw-Hill New York, Edition 5, 2001, pp. 50-51.
[7] Widagdo S. and Seader W. D., Journal Review Azeotropic Distillation, AIChE J., Volume 42, Nomor 1, 1996, pp. 96-130.
[8] Sari N.K., Sutiyono S., Luluk E., Dira E., Wesen P., and Tatik S. H., Bioethanol Production from Liquid Waste of Rice Flour with Batch Process, Web of Conferences, Volume 58, Nomor 01003, 2016, pp. 1-5, doi. 10.1051/matecconf/20165801003.
[9] Sari N.K., Abdi Y.I., Wesen P., and Retno D., Numerical of Bioethanol Production from Liquid Waste of Rise Flour by Distillation Processs, Web of Conferences, Volume 58, Nomor 01014, 2016, pp. 1-5, doi. 10.1051/matecconf/20165801014.
[10] Sari N.K., Nico Y., Tika L., and Dira E., Hydrolysis of Cellulose from Bamboo with Biology Process using Enzyme, J. Advance Science Letters, vol. 23, no. 12, 2017, 12235-12238, doi.org/10.1166/asl.2017.10610. [11] Sari N.K., Pudjiastuti C., and Sumada K.,