Full Length Research Paper
Some chemical properties of oil palm decanter meal
M. Afdal
1,2, Azhar Kasim
1*, A. R. Alimon
1and N. Abdullah
31
Department of Animal Science, Faculty of Agriculture, Universiti Putra Malaysia, Selangor 43300, Malaysia.
2
Faculty of Animal Husbandry, Jambi University Kampus Mandalo Darat, 36361, Indonesia.
3
Department of Biochemistry, Faculty of Biotechnology and Biomolecular Science, Universiti Putra Malaysia, Selangor 43300, Malaysia.
Accepted 15 November, 2011
The aims of this study were to investigate the rancidity and chemical properties of oil palm decanter meal (OPDM) after been kept over an extended period of time. Samples were collected daily and analyzed for some rancidity properties, including peroxide value (PV) and thiobarbituric acid (TBA), and for chemical composition, including proximate analysis, fiber, mineral and fatty acid (FA) content. The correlation coefficient between time of storage and the rancidity (PV and TBA) of OPDM were positive with R2 of 0.9792 and 0.9678, respectively. During ten days of observation, the compositions of long-chain FA, including stearic, oleic, linoleic and linolenic except for palmitic were significantly (P<0.05) different. The compositions of short-chain FA, including acetic, propionic, isobutyric, butiryc, isovaleric and valeric, were also significantly (P<0.05) different. Furthermore, PV and TBA were significantly (P<0.05) different during the extended time of 10-days storage. The correlation coefficient between PV and long-chain FA (palmitic, stearic, oleic, linoleic, and linolenic) were 0.61, 0.16, -0.82, -0.3 and -0.84, respectively, and the correlation composition between TBA and the composition of long-chain FA (palmitic, stearic, oleic, linoleic and linolenic) were 0.40, 0.34, -0.91, -0.02 and 0.62, respectively. It could be summarized that physically and chemically, the fresh OPDM might be used as an alternative feed, especially for ruminant.
Key word: Oil palm decanter meal, fatty acid, oxidation, rancidity, peroxide, thiobarbituric.
INTRODUCTION
Oil palm decanter meal (OPDM) is a pasty-type by-product derived from mechanical extraction of crude palm oil (Afdal et al., 2011). It is slightly different from palm oil mill effluent or palm oil sludge as it is processed by a specific processing machine. The OPDM is produced after passing through a process of decanting, centrifuging and then drying within the machine system (Southworth, 1985). Utomo and Widjaja (2004) clarified that OPDM was produced by the separation of liquid from palm oil sludge so it looks like a solid by-product, like tofu. The typical characteristic color of OPDM is soft blackish brown. OPDM consists of 81.65, 12.63, 7.12, 25.79, 0.03 and 0.003%, respectively, of dry matter (DM), crude protein (CP), ether extract (EE), crude fiber, calcium and phosphorous, and 154.52 Kcal/kg energy (Southworth,
*Corresponding author. Email: [email protected].
1985). The fatty acids (FA) components of OPDM are usually palmitic, oleic, linoleic, stearic and miristic acids (Macfarlane et al., 1975). OPDM is also rich in beta-carotene content and is a source of natural vitamin A with 900 IU g-1. This is slightly higher than the content of natural vitamin A of fish oil (600 IU g-1) (Macfarlane et al., 1975). It is a valuable and potential by-product that can be utilized as an alternative source of feed for animals (Southworth, 1985).
properties of OPDM.
The aims of these studies were to describe some properties of OPDM namely, the chemical composition, rancidity (PV and TBA) and the involvement of the deterioration of FA such as palmitic, stearic, oleic, linoleic and linolenic after been kept at 10-extended days.
MATERIALS AND METHODS
Sample preparation and procedure
Fresh OPDM sample was collected from the palm oil plant in Kemaman Trenggano Malaysia and transported to the laboratory of Animal Nutrition, Universiti Putra Malaysia. The samples were placed in a big bucket and kept standing at a room temperature prior to the data collection. One kilogram of a composite sample was collected from the bucket at 05.00 pm everyday for 10 consecutive days. Collected samples were arranged inside the different plastic bags and subsequently transferred into a fridge at -20°C prior to the analysis.
Property evaluation
Fresh sample was evaluated for physical properties, including appearance, color, smell and tenderness. Samples from the fridge were analyzed for the rancidity (PV and TBA), the compositions of FA, nutrients, including DM, ash, CP, EE, neutral detergent fiber (NDF), acid detergent fiber (ADF), and some minerals. The pH was measured as soon as the fresh OPDM was collected from the content, including NDF and ADF, was done following the procedure of VanSoest (1963). Mineral analysis for Cr, Fe, Mn, Ni and Cu were carried out using atomic absorption spectrometry (AAS).
Rancidity analysis 3:2) were added, shaken by hand and kept standing on a table for 1 h. The mixture was filtered using filter paper (Whatman 125 mm Ø Cat No 1001 125, Whatman International Ltd Maidstone, England) into an Erlenmeyer flask and treated with 1.5 ml of saturated potassium iodide. The solution was kept on the table for a while and shaken by hand, after which 30 ml distilled water and one or two drops of an indicator (starch solutions) were added. The solution was subsequently titrated with sodium thiosulphate (0.1 N Na2S2O3)
until the purple color disappeared. The blank sample was also done under the same condition as PV determination itself. PV was Tadlargis et al., (1960). 10 g of OPDM sample were mixed for 2 min with 50 ml distilled water using a blender. The mixture was then poured into a distillation flask and washed with 47.5 ml of distilled water. It was afterward treated with 2.5 ml of 4 N hydrochloric-acid together with an anti foam agent and marble. The flask was heated for about 10 min and 50 ml of distillate was collected. 5 ml of this distillate was pipeted into a 15-ml-glass stopper tube and 5 ml of 0.2883% (w/v) TBA solution in 90% glacial acetic acid was added. The tubes were capped, shaken and then heated to the boiling point in a water bath for 35 min. A blank tube preparation was made in the same way using 5 ml of distilled water and 5 ml of the reagent. Both sample and blank were cooled in tapped water for 10 min, and the absorbance (D) was recorded against the blank at 538 nm using 1.5 ml cuvette. The TBA number was calculated in mg of malondialdehyde kg-1 of samples, which was equal to 7.8 times using the formula:
TBA = D × 7.8
Where, TBA is thiobarbituric number and D is absorbance.
Fatty acids analysis
Extraction of lipids
Table 1. Physical properties, rancidity and chemical temperature was 300°C. The column temperature program initiated runs at 100°C, for 2 min, warmed to 170°C at 10°C/min, held for 2 min, warmed to 200°C at 7.5°C/min, and then held for 20 min to facilitate optimal separation. The peaks of samples were identified, and concentrations were calculated based on the retention time and peak area of known standards (Sigma Chemical). The fatty acid concentrations were expressed as a percentage of total identified fatty acids.
Experimental design and statistical analysis
The completely randomized design with four treatments of sampling time (on day 0, 3, 5, 7 and 10) and three replications were applied to these experiments. ANOVA followed by Duncan test were applied to analyze the mean of FA, PV and TBA during these studies. Analysis of correlation was done for time of sampling, rancidity and FA content using Microsoft SAS 9 (SAS, 2008).
RESULTS
The properties of fresh OPDM are presented in Table 1. It included the physical appearance, rancidity, FA, chemical and mineral content, and was investigated 24 h after sample collection. The contents of palmitic and oleic were dominant; more than 40% of OPDM lipid. The CP content was moderate, and the contents of NDF and ADF were relatively high. The contents of Fe and Cu were also quite high and ranged from 12.60 to 13.59 ppm and from4.28 to 8.80 ppm, respectively.
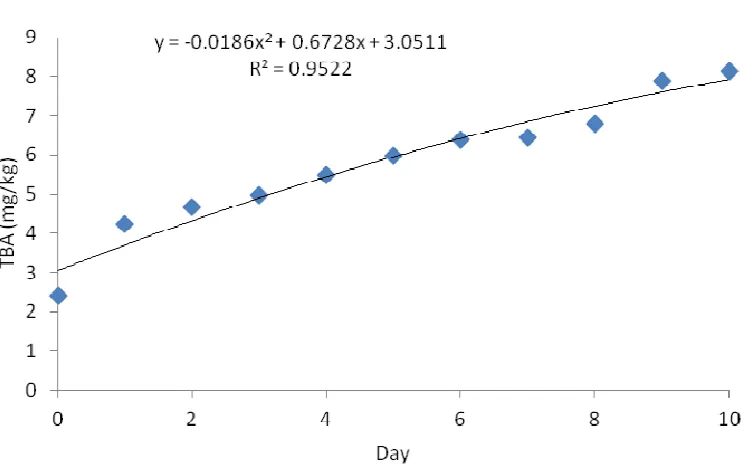
Figures 1 and 2 show the daily value of PV and TBA of OPDM during the 10 days of observation. The correlation between sampling time and rancidity (PV and TBA) was positive with the correlation coefficient (R2) of 0.9792 and 0.9678 for PV and TBA, respectively.
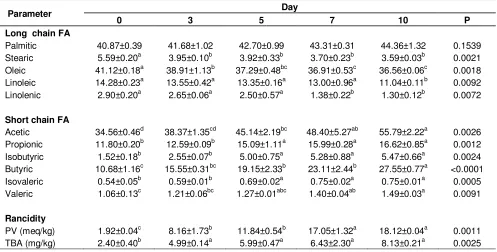
The variation of FA composition and rancidity of OPDM during the 10 days after sample collection can be seen in Table 2. Most of the composition of long-chain FA significantly (P<0.05) decreased except palmitic and all the compositions of short-chain FA significantly (P<0.05) increased. In terms of rancidity, PV and TBA were significantly (P<0.05) increased.
The correlation coefficient between rancidity (PV and TBA) and the composition of each long-chain FA as well as palmitic, stearic, oleic, linoleic and linolenic is shown in Table 3. The correlation coefficient between rancidity (PV and TBA) and the concentration of unsaturated FA namely oleic, linoleic and linolenic acid was negative. On the other hand, the correlation coefficient between rancidity (PV and TBA) and the concentration of saturated FA (palmitic and stearic) was positive.
Figure 1. Peroxide value of OPDM during the 10 days observation.
Figure 2. TBA value of OPDM during the 10 days observation.
which ranged from 22.9 to 48.6% and 34.6 to 54.8%, respectively (Macfarlane et al., 1975). All these might be due to the different breed and different geographical location. Oleic, linoleic and linolenic acids might possibly cause the rancidity of OPDM as it is an unsaturated FA. Nawar (1996) explained that hydrogen abstraction at a carbon chain on oleic, linoleic and linolenic resulted in formation of free allylic radical, causing rancidity.
The composition of CP was medium and ranged from 11.58 to 11.87%, while EE content was low and ranged
Table 2. The composition of fatty acids, PV and TBA of OPDM over 10 days (%).
Parameter Day
0 3 5 7 10 P
Long chain FA
Palmitic 40.87±0.39 41.68±1.02 42.70±0.99 43.31±0.31 44.36±1.32 0.1539
Stearic 5.59±0.20a 3.95±0.10b 3.92±0.33b 3.70±0.23b 3.59±0.03b 0.0021
Oleic 41.12±0.18a 38.91±1.13b 37.29±0.48bc 36.91±0.53c 36.56±0.06c 0.0018
Linoleic 14.28±0.23a 13.55±0.42a 13.35±0.16a 13.00±0.96a 11.04±0.11b 0.0092
Linolenic 2.90±0.20a 2.65±0.06a 2.50±0.57a 1.38±0.22b 1.30±0.12b 0.0072
Short chain FA
Acetic 34.56±0.46d 38.37±1.35cd 45.14±2.19bc 48.40±5.27ab 55.79±2.22a 0.0026
Propionic 11.80±0.20b 12.59±0.09b 15.09±1.11a 15.99±0.28a 16.62±0.85a 0.0012
Isobutyric 1.52±0.18b 2.55±0.07b 5.00±0.75a 5.28±0.88a 5.47±0.66a 0.0024
Butyric 10.68±1.16c 15.55±0.31bc 19.15±2.33b 23.11±2.44b 27.55±0.77a <0.0001
Isovaleric 0.54±0.05b 0.59±0.01b 0.69±0.02a 0.75±0.02a 0.75±0.01a 0.0005
Valeric 1.06±0.13c 1.21±0.06bc 1.27±0.01abc 1.40±0.04ab 1.49±0.03a 0.0091
Rancidity
PV (meq/kg) 1.92±0.04c 8.16±1.73b 11.84±0.54b 17.05±1.32a 18.12±0.04a 0.0011
TBA (mg/kg) 2.40±0.40b 4.99±0.14a 5.99±0.47a 6.43±2.30a 8.13±0.21a 0.0025
Different superscript within the same row is significantly different (P<0.05).
Table 3. The correlation coefficient between TBA, PV and the composition of some FA within OPDM.
Parameter Palmitic Stearic Oleic Linoleic Linolenic
PV 0.61 0.16 -0.82 -0.3 -0.84
TBA 0.4 0.34 -0.91 -0.02 -0.62
which ruminant could tolerate (McDonald et al., 1988; Utomo et al., 2004). It might be possibly prepared as a single feed or as a mixed diet for animal feeding.
The content of Fe and Cu was quite high and ranged from 12.60 to 13.59 ppm and from 4.28 to 8.80 ppm for Fe and Cu, respectively. The content of Fe might be a potential component to affect the rancidity of OPDM. Nawar (1996) reported that one of the factors influencing the rate of lipid oxidation in foods was Fe, a catalyst in lipid metabolism. Therefore, the Fe content of OPDM has to be considered in preserving OPDM and in preparing it in a diet of animal. Overall, the nutrient composition of OPDM is not so far different from those of the conventional feed.
Figures 1 and 2 show PV and TBA during 10-day extended time of storage. The correlation coefficient (R2) between the extended time of storage and the rancidity was 0.9792 and 0.9678 for PV and TBA, respectively. This might probably be due to the enhancement of oxi-dative rancidity that forms hydroperoxide and increases attack of oxygen at allylic position of unsaturated FA (Nawar, 1996) during the period. The formation of hydro-peroxide was probably as a result of the deterioration of
FA such as oleic, linoleic and linolenic acids, which are the main unsaturated FA, existing within OPDM. More specifically, the development of the hydroperoxide might have originated from the deterioration of the double bond of oleic acid since the oleic acid was the most concentrated unsaturated FA among the other three FAs within OPDM. In addition, the concentration of oleic acids significantly (P<0.05) declined over 10 days of sampling (Table 2). The increase in the concentration of hydro-peroxide was followed by a decrease in the concentration of unsaturated lipid over time of oxidation (Nawar, 1996).
OPDM easily becomes rancid because of its previous exposure to high temperature at the factory which obstructs the aldehyde, alkanal, hydrodcarbon and other chemicals. Peroxide value is sensitive to temperature, which plays a role in the formation of carbonyl and hydroxy compound (Kamal-Eldin et al., 2003). There appears to be a strong correlation between time and PV (R2 = 0.9792). This might possibly be the primary reason of oxidation with the formation and liberation of peroxide (H2O2) from unsaturated FA like oleic, linoleic and
linolenic acids.
as a catalyst. High content of Fe and Cu in OPDM (Table 1) might possibly oxidize unsaturated FAs and then speed up the rancidity. This might also be related to the composition of unsaturated FA namely oleic, a dominant FA in OPDM. In this circumstance, mineral Fe and Cu might also possibly play a role as a catalyst to oxidize unsaturated FA, oleic, linoleic and linolenic (Nawar, 1996).
This might be interpreted as a lower rate of hydrolytic rancidity than oxidative rancidity as TBA regularly represents hydrolytic rancidity. TBA figures out the amount of aldehyde formations that previously comes from the attack of peroxide (Hamilton, 1994). Rancidity is normally initiated with the oxidative rancidity followed by hydrolytic rancidity. Therefore, the correlation between PV and TBA is usually positive. Hoyland and Taylor (1991) reviewed that malondialdehyde, a product of lipid oxidation, is the major TBA reactive substance and the chemical reaction is still uncertain (Labuza, 1971). The other oxidation products involved in TBA activity includes α,β-unsaturated aldehyde and several other un-recognized non-volatile precursor of these substances (Kamal-Eldin et al., 2003). incorporate any treatment into OPDM that would reduce the rancidity. Rancidity is usually caused by an oxidation process that is influenced by air, heat and light. It is a biochemical reaction that leads to an attack on the double bond within unsaturated FA, followed by the formation of free radical. This might be prevented by using a synthetic antioxidant like BHT, BHA and TBHQ which are forbidden in some developed countries or a natural antioxidant from a plant tree. Using a natural antioxidant might be a very good alternative approach to overcome the rancidity in OPDM as it is safe and natural.
Moreover, the correlation between long-chain FA (oleic, linoleic and linolenic) and both PV and TBA was both negative (Table 3). It could be highlighted that the ran-cidity was due to the deterioration of these unsaturated FA. The oxidation process usually occurs at a double-bond unsaturated spot of the glyceride molecules (Ladikos and Lougovois, 1990).
The composition of palmitic acid is also another domi-nant component of FA within OPDM. There was no significant difference (P>0.05) in the composition of the palmitic acid in over 10 days of sample collection. The increase of rancidity might not be linked to the degra-dation of palmitic acid since it is a saturated FA molecule which is relatively stable and is not susceptible to oxidation (Hamilton, 1994).
Overall, the unsaturated FA component of OPDM such as oleic, linoleic and linolenic would lead to formation of rancidity when it is kept in an open air condition. The
number of PV and TBA would increase within 10 days when fresh OPDM is kept standing in an open air without any treatment. The results show an initial rise in the composition of palmitic, linoleic and linolenic for the first few days before a subsequent decline. This might be due to the formation of FA by a microorganism in the initial step of the storage which was then followed by oxidation. Fulco (1977) explained that FA synthesis (FAS) could be done by a microorganism like bacteria and also by algae, fungi, protozoa and other higher plant and animals. The FAS might be in anaerobic and aerobic condition. Alberts and Greenspan (1984) reported that the action of bacterial FA synthetase enzyme might form FA from Acetil-CoA and 7 malonyl-CoA. Kaneda and Smith (1980) reported that there are bacteria producing the FA synthetase like Bacterium subtilis, Corynebacterium
cyclohexanicum, Micrococcus luteus, Psedomonas
maltophila (Bryan), Escherichia coli B and P flourescens.
Furthermore, the decrease in the composition at the end might be due to the fact that FA has started to be oxidized. The decrease in the composition of stearic and oleic acids could be linked to the only oxidation that occurred in this circumstance without any synthesis of these FAs.
Table 3 represents the correlation coefficient between the rancidity (PV and TBA) and long-chain FA compositions for 10 days. The correlation coefficient between rancidity (PV and TBA) and the concentration of oleic, linoleic and linolenic acid was negative. This portrays that the increase of both PV and TBA might be attributed mostly to the degradation of oleic, linoleic and linolenic acids. The main source of rancidity in this study may possibly be indicated by the oxidation from unsaturated oleic and linolenic acids. This is marked by a strong negative correlation between the rancidity (PV and TBA) and the composition of oleic and linolenic acids, and a very low negative correlation between rancidity (PV and TBA) and the composition of linoleic acid.
Conclusion rancidity in order for it to be used as animal feed.
ACKNOWLEDGEMENT
REFERENCES
Afdal M, Azhar K, Alimon AR, Abdullah N (2011). The peroxide value and thiobarbituric acids profiles of palm oil decanter meal kept over extended time. British Soc. Ani. Sci. Nottingham Univ. Jubilee Campus 4-6 April. p. 264.
Albert AW, Greenspan MD (1984). Animal and bacterial fatty acid synthetase in Fatty acid metabolism and its regulation. In S. Numa, New Comp. Biochem. 7: 29-58.
AOAC (1990). Official method of analysis. Washington DC: Association of Official Analytical Chemist. Washington, DC, USA.
AOAC (2000). Official Methods of Analysis, 17th edn. Association of Official Analytical Chemists, Washington, DC, USA.
Folch J, Lees M, Sloan-Stanley GH (1957). A simple method for the isolation and purification of total lipids from animal tissues. J. Biol. Chem. 226(1): 497-509.
Fulco AJ (1977). Fatty acid desaturation in microorganism. In Kunau WH & Holman RT, Polysaturated fatty acid, Am. Oil. Soc. pp. 19-36. Hamilton RJ (1994). The chemistry of rancidty in foods. In Allen JC, &
Hamilton RJ. Rancidity in Food 3th. London: Blackie Academic and Professional.
Hoylan DV, Taylor AJ (1991). A review of the methodology of the 2-thiobarbituric acid test. Food Chem. 40: 271-291.
Kamal-Eldin A, Mäkinen M, Lampi AM (2003). The challenging contribution of hydroperoxidesto the Lipid Oxidation Mechanism In: Lipids oxidation pathways. AOCS Press.
Kaneda T, Smith E (1980). Relatonship of primer specificity of fatty acid de novo synthetase to fatty acid composition in 10 species of bacteria and yeast . Can J. Microb. 26: 893-898.
Labuza TP (1971). Kinetics of lipid oxidation in foods. CRC. Crit. Rev. Food. Tech. 2: 355-405.
Ladikos D, Lougovois V (1990). Lipid oxidation in muscle foods: A review. Food Chem. 35: 295-314.
Macfarlane N, Swetman T, Cornelius JA (1975). Analysis of mesocarp and kernel oils from the American oil palm and F1 hybrids with the W
Afric oil palm. J. Sci. Food. Agric. 26: 1293-1298.
McDonald P, Edwards RA, Grennhalgh JF (1988). Animal Nutrition. Essex England: Scientific and Technical.
Nawar WW (1996). Lipid. In O. R. Fenema, Food Chemistry 3rd NewYork USA: Marcel Dekkerb Inc. pp. 225-319.
Rajion MA, McLean JG, Cahill RN (1985). Essential fatty acids in the fetal and newborn lamb. Aust. J. Biol. Sci. 38: 33-40.
SAS. (2008). SAS 9.2 TS Level 1MO. Cary NC USA: SAS Institute Inc. Southworth A (1985). Palm oil and palm kernels. J. Am. Oil. Chem. Soc.
62(2): 250-254.
Tarladgis BG, Watts BM, Younathan MT, Dugan LJ (1960). A distilation method for the quantitative determination of malonaldehyde in rancid foods. J. Am. Oil. Chem. Soc. 37 : 44-48.
Utomo BN, Widjaja E, Hartono A, Sintha E, Adriansyah (2004). A final report of technology exibition: The utilisation of solid sawit by-product as broiler feed. Palangkaraya Indonesia: BPTP Central Kalimantan. Van Soest PJ (1963). Use of detergents in the analysis of fibrous feeds.
II A rapid method for teh determination of fiber and lignin. J. Assoc. Off. Agric Chem. 46 : 829-835.